


 Arguments


Recent Comments
Prev 1474 1475 1476 1477 1478 1479 1480 1481 1482 1483 1484 1485 1486 1487 1488 1489 Next
Comments 74051 to 74100:
-
Hyperactive Hydrologist at 00:39 AM on 14 October 2011Pielke Sr. and SkS Disagreements and Open Questions
Maybe I should have read Dikran Marsupial post @ 90. I think my girlfriend uses a different method, I will have to ask her. -
Hyperactive Hydrologist at 00:36 AM on 14 October 2011Pielke Sr. and SkS Disagreements and Open Questions
Prof. Peilke @88, Would it be possible to do a statistical test to determine whether there is a change point in the data. My girlfriend does this with rainfall data, I don't pretend to understand the methodology but it basically detects if there is a change in the data to a new trend or phase. With rainfall these changes can often be partially attributed to teleconnections such as the NAO. I believe it can also be applied to discharge data but I'm not sure whether it would be applicable to temperature data. -
Dikran Marsupial at 00:09 AM on 14 October 2011Pielke Sr. and SkS Disagreements and Open Questions
Prof. Pielke wrote: "You split data when you see an obvious breakpoint but do not have a preconceived test of what you are expecting." This is simply incorrect. There are statistical tests for determining whether there is significant evidence for the existence of a breakpoint (e.g. segmented regression, although I personally would probably use a Bayes factor based approach). Seeing an "obvious breakpoint" would be a good reason to perform the test, but it would not be good scientific practice to assert the existence of a breakpoint without first demonstrating that there were statistically significant evidence for that hypothesis (or a physical reason as muoncounter suggests). "You would not split the data if you are examining an hypothesis (i.e. a "weak long term" global warming)." This is also incorrect, whether you split the data or not would depend on the nature of the hypothesis. If the hypothesis were "the climate has warmed more slowly since 1998", for example, it would be difficult to formulate an appropriate statistical test without splitting the data. "Both approaches are appropriate." I certainly agree with that, however regarldless of which approach is taken, it would not be good scientific practice to base an argument on a trend in the absence of statistically signifiant evidence. It is a very bad idea to analyse the data using your eyes only, as I said human beings are very good at seeing patterns in data where they don't actually exist, which is why we have statistics so we can test objectively if our intuitions are reasonable. It is a safety valve that science has found very useful over the years. -
Peter Hogarth at 00:04 AM on 14 October 2011The Deep Ocean Warms When Global Surface Temperatures Stall
Hi Rob, just posted this over on the Heat energy post (link Glenn provided). Looking at five year averages of the difference between the 700m heat Ocean content and the 2000m data, (assuming the data is treated consistently and I haven’t messed up) we see a significant increase in this difference in all ocean basins (and also checked for both hemispheres) over the past decade, against a background of continuing global increase in 0 to 2000m heat content. The departure from the very small global 700m to 2000m differences over the 1980 to 2000 period is marked. This would indicate continued and consistent warming of deeper layers during short term changes nearer the surface. Useful for this post I think.
-
pielkesr at 00:00 AM on 14 October 2011Pielke Sr. and SkS Disagreements and Open Questions
dana1981 - Regarding "We appreciate your acknowledgment that your blog post claiming that OHC has not increased since 2003 was incorrect. We agree that increase in OHC for the upper 700 meters has slowed in recent years. However, as we discussed in the post above, and Rob P's recent post, and John's post today, heat is also accumulating in the oceans at depths below 700 meters." The OHC accumulation for the upper 700m since 2003 is positive but small [see http://oceans.pmel.noaa.gov/]. We seem to agree on tha (as does others such as Kevin Trenberth). If there is heat accumulating at depth (and I have been discussing this issue at Real Climate, the question is whether we see this transfer of heat downward in the Argo data). Regardless, if the heat is actually there, it has important consequences: 1. The use of the global annual average surface temperature to monitor global warming misses a component of this heating. This means the current trends using this metric underestimate global warming, but also make the difference between its trend and that of the lower tropospher even greater. 2. The reduction of surface ocean heating means that the evaporation of water vapor into the atmosphere would be less. Indeed, in recent years, the water vapor content in the tropsphere does not seem to have been increasing. 3. If there is heat at depth, it is hard to see how it quickly remerge back into the atmosphere in order to affect weather. Thus, the identification of greater heating at depth introduces yet another complexity into the real climate system. -
Peter Hogarth at 23:58 PM on 13 October 2011The Earth continues to build up heat
Looking at five year averages of the difference between the 700m heat Ocean content and the 2000m data, (assuming the data is treated consistently and I haven’t messed up) we see a significant increase in this difference in all ocean basins (and also checked for both hemispheres) over the past decade, against a background of continuing global increase in 0 to 2000m heat content. The departure from the very small global 700m to 2000m differences over the 1980 to 2000 period is marked. This would indicate continued and consistent warming of deeper layers during short term changes nearer the surface.
-
Dikran Marsupial at 23:54 PM on 13 October 2011There is no consensus
Jonathon The individual scientists may not agree on the most likely value of equilibrium climate sensitivity, but that does not mean there is not consensus on the distribution of plausible values for equilibrium climate sensitivity, which is what the IPCC actually presents. The scientists are well aware that there are different ways of estimating climate sensitivity and each will give a different answer, thus there is uncertainty involved, and there is no good reason to think of any of the point estimates as the truth, but instead look how the various estimate constrain the values that can be considered plausible according to what we do know. Of course Spencer won't agree, but that is becuase his estimate of climate senistivity lies outside the range considered plausible by the mainstream consensus view. Note Spencer would have a hard time explaining many paleoclimate events with such a low sensitivity, which is why the concenssu is that a value that ow isn't plausible. -
Anne-Marie Blackburn at 23:53 PM on 13 October 2011Greenland ice loss continues to accelerate
Hyperactive Hydrologist I reached the same conclusion when I first read about Konikow's paper. However, as someone pointed out to me, Konikow doesn't take into account the construction of dams in his calculations. Dams offset most of the sea-level increase you would expect following groundwater extraction. This paper by Church probably gives a more comprehensive analysis of the situation. -
pielkesr at 23:52 PM on 13 October 2011Pielke Sr. and SkS Disagreements and Open Questions
muoncounter - You split data when you see an obvious breakpoint but do not have a preconceived test of what you are expecting. You would not split the data if you are examining an hypothesis (i.e. a "weak long term" global warming). Both approaches are appropriate. -
pielkesr at 23:48 PM on 13 October 2011Pielke Sr. and SkS Disagreements and Open Questions
Tom Curtis - You write "....they show that intervals at least 17 years are needed to reliably distinguish a weak warming signal (as predicted for climate models in the early 21st century) against background natural variablity?" This "weak" signal is why we need to broaden the metrics we use to assess the role of humans on the climate system. Such a hiatus in global warming was not anticipated by anyone that I am aware of prior to the last few years. Indeed, Jim Hansen specifically said [http://pielkeclimatesci.files.wordpress.com/2009/09/1116592hansen.pdf] "Contrary to the claim of Pielke and Christy, our simulated ocean heat storage (Hansen et al., 2005) agrees closely with the observational analysis of Willis et al. (2004). All matters raised by Pielke and Christy were considered in our analysis and none of them alters our conclusions. The Willis et al. measured heat storage of 0.62 W/m2 refers to the decadal mean for the upper 750 m of the ocean. Our simulated 1993-2003 heat storage rate was 0.6 W/m2 in the upper 750 m of the ocean. The decadal mean planetary energy imbalance, 0.75 W/m2, includes heat storage in the deeper ocean and energy used to melt ice and warm the air and land. 0.85 W/m2 is the imbalance at the end of the decade. Certainly the energy imbalance is less in earlier years, even negative, especially in years following large volcanic eruptions. Our analysis focused on the past decade because: (1) this is the period when it was predicted that, in the absence of a large volcanic eruption, the increasing greenhouse effect would cause the planetary energy imbalance and ocean heat storage to rise above the level of natural variability (Hansen et al., 1997), and (2) improved ocean temperature measurements and precise satellite altimetry yield an uncertainty in the ocean heat storage, ~15% of the observed value, smaller than that of earlier times when unsampled regions of the ocean created larger uncertainty." Also, the issue of El Nino causing a warming signal. This is why in the 1990s, with the 1998 one being an example, it was claimed we would be having more of them. This has not, however, occurred as anticipated. The bottom line, in my view, is that we do not understand the climate system as well as claimed on SkS (and by the IPCC). It does not mean the human role is less important, but that it is more diverse in its forcings, and the natural climate forcings and feedbacks are larger than previously assumed. Judy Curry has very well spoken to this later issue, and if you have not already done so, I recommend you read her view on this on her weblog. Focusing on a "weak long term warming" signal, as the primary focus is not an effective way to present the climate issues to the public and policy communities. -
muoncounter at 23:45 PM on 13 October 2011Book review: The Inquisition of Climate Science
Climate Progress nicely covers the censorship of any mention of sea level rise in Texas, including the markup of the chapter written by Anderson with edits. It would be astounding, if it were not happening in Rick Perry's Texas. “We can’t even present a conservative viewpoint” The edits are stunning. For example:the very existence of Galveston Bay is attributed to sea level rise. It is ironic that its future will be strongly regulated by the now-rising sea.A must-read. -
Jonathon at 23:29 PM on 13 October 2011There is no consensus
Skywatcher, I disagree that just because a value is not zero, that there is a consensus among all players. Do you really believe that Lindzen, who published that the climate sensitivity is 0.5, Link - 1.1, Spencer - 1.3, Annan - 3, Hansen - 6, and Pagani - 9.4 are all in agreement? This seems odd to me, especially since there are many from this site who constantly argue against Lindzen and Spencer (and anyone else who claims a low climate sensitivity). Do you really believe that they are part of the "consensus" just because their values are nonzero? -
Jonathon at 22:54 PM on 13 October 2011Greenland ice loss continues to accelerate
Hyper, Yes, groundwater depletion has been an important factor in SLR, but often ignored in the conversation. Considering that Greenland has contributed 0.28 mm/yr averaged over the past half century (16% of the total), the estimated groundwater depletion over the same time frame (~0.23 mm/yr) is similar. The only larger contributors are mountain glaciers and thermal expansion. -
CBDunkerson at 22:10 PM on 13 October 2011Pielke Sr. and SkS Disagreements and Open Questions
Dr. Pielke wrote in #76: "This is why, in my view, you are so vigorously defending the model-predicted linear trend of the global average surface temperature when anyone presents data that conflicts, even if on a short time period." I'm sorry, but what model(s) are we talking about here? I'm not aware of any which are stated to predict a linear trend on short time scales. Obviously, that wouldn't make any sense given that there will inevitably be deviations due to major volcanic eruptions, solar output variation, internal heat transfer, and other such factors. Thus, if we accept that linear trend projections are meant to refer only to the long term outcome then rejecting the idea that short term deviations invalidate the projection is not indicative of an 'agenda', but rather simply awareness of the (long term) intent and adherence to basic statistical analysis. -
CBDunkerson at 21:51 PM on 13 October 2011The Earth continues to build up heat
From Peru, my reading of Albatross's article above is that, while Church et al 2011 only includes a 'snapshot' of the change in heat content over time, the research behind that involved tracking the heat content for the entire period... which data they then supplied to Albatross. Thus, the 'original source' for that graph is the short article at the top of this page... though the underlying data is the same that was compiled for Church 2011.Response:[DB] CBD, Albatross' image links back to that furnished in a comment response by Gavin over at RealClimate.
-
Hyperactive Hydrologist at 21:36 PM on 13 October 2011Greenland ice loss continues to accelerate
Slightly off topic but I though it might be of interest Contribution of global groundwater depletion since 1900 to sea‐level rise Estimated global groundwater depletion during 1900–2008 totals ∼4,500 km3, equivalent to a sea‐level rise of 12.6 mm (>6% of the total). Furthermore, the rate of groundwater depletion has increased markedly since about 1950, with maximum rates occurring during the most recent period (2000–2008), when it averaged ∼145 km3/yr (equivalent to 0.40 mm/yr of sea‐level rise, or 13% of the reported rate of 3.1 mm/yr during this recent period). Considering groundwater comprises 30% of the total freshwater on the planet, increases in abstraction may have a significant contribution to future sea level rise. -
Arkadiusz Semczyszak at 21:01 PM on 13 October 2011The Earth continues to build up heat
Of course we can accept this point of view here (and finish the discussion): “In a recent study (Loeb et al. 2011) Co-Chair Norman Loeb addresses a seemingly contradictory issue with respect to observed interannual variations in net TOA radiation and ocean heat storage raised by Trenberth and Fasullo (2010). On a global annual scale, interannual variations in net TOA radiation and ocean heat storage should be correlated, since oceans serve as the main reservoir for heat added to the Earth-atmosphere system. Wong et al. (2006) showed that these two data sources are in good agreement for 1992–2003. In the ensuing 5 years, however, Trenberth and Fasullo (2010) note that the two diverge from one another. The new paper by Loeb and co-authors uses improved satellite top-of-atmosphere (TOA) radiation measurements and a new analysis of ocean heat content data to show that while Earth’s energy imbalance and ocean heating rate have exhibited variability consistent with El Niño-Southern Oscillation (ENSO), there is no evidence of a decline during the past decade. Satellite observations of top-of-atmosphere (TOA) net radiation constrained by recent in situ ocean heat content data indicate that during the past decade Earth has been accumulating energy at the rate 0.52 ±0.43 Wm–2. These results suggest that although Earth’s surface has not warmed significantly during the 2000s, energy is continuing to accumulate in the sub-surface ocean at a rate consistent with anthropogenic radiative forcing.” ... however: I. I would - finally - know “mythical” “study (Loeb et al. 2011)” ... II. Also remind these sentences with von Shuckmann and Le Traon 2011.: “Our results show that GOIs derived from the Argo measurements are ideally suitable to monitor the state of the global ocean, especially after November 2007, i.e. when Argo sampling was 100% complete. They also show that there is significant interannual global variability at global scale, especially for global OFC. Before the end of 2007, error bars are too large to deliver robust short-term trends of GOIs and thus an interpretation in terms of long-term climate signals are still questionable, especially since uncertainties due to interannual fluctuations are not included in our error estimation.” “Uncertainty estimations due to the data handling reveal that this increase is significant during the years 2005–2010 (this does not mean, of course, that these are long term trends).” 2007 years ... - When was that? 10 - 20 - 30 years ago? The (possible) " error bars" interesting writes (and discuss) R. Spencer.Response:[DB] Perhaps it's the language barrier, but your extensive quotations lack a summary conclusion by you. You are not making any point that makes any sense.
-
Stevo at 16:52 PM on 13 October 2011Every Picture Tells A Story
Nice resource, Daniel. I spent some rewarding time at the Earth Observatory site. -
From Peru at 16:27 PM on 13 October 2011The Earth continues to build up heat
Yes Glenn, that graph is great. If only Albatross give us the reference (and if possible, the link) to the paper from which it was extracted... ... Title of the paper - authors - date of the paper N.B: The title is the most important reference to find the paper on an internet search. -
scaddenp at 15:09 PM on 13 October 2011Understanding climate denial
But its not. Lindzen is saying "most likely" <2 from memory. IPCC review concluded sensitivity "most likely" 3, and between 2 and 4. Furthermore, this estimate is backed by several different estimation methods. Estimates lower than 2 depend on hope. -
Rob Painting at 14:23 PM on 13 October 2011The Deep Ocean Warms When Global Surface Temperatures Stall
Aware of that thanks Glenn, I was involved in the discussion at Real Climate when Gavin Schmidt posted the graph. Just affirms what the data from the 700mtr and 1500 mtr ocean depth observations were suggesting. I might e-mail a few scientists and find out if there's any studies on this in the pipeline. -
dana1981 at 14:23 PM on 13 October 2011Pielke Sr. and SkS Disagreements and Open Questions
Moving on to point #3: 3) We appreciate your acknowledgment that your blog post claiming that OHC has not increased since 2003 was incorrect. We agree that increase in OHC for the upper 700 meters has slowed in recent years. However, as we discussed in the post above, and Rob P's recent post, and John's post today, heat is also accumulating in the oceans at depths below 700 meters. Hansen et al. (2011) note that
 "The inferred planetary energy imbalance, 0.59 ± 0.15 W/m2 during the 6-year period 2005-2010, confirms the dominant role of the human-made greenhouse effect in driving global climate change."
See their Figure 10, which uses ARGO data to 1500 meters: We do not agree with recommending OHC as the primary metric to monitor global warming. Firstly, the OHC data is sparser and younger than surface temperature measurements, and deep ocean data is lacking. Hansen et al. estimate that only ~55% of the global energy imbalance between 2005 and 2010 went into the upper 700 meters, and ~70% into the upper 1500 meters of ocean. Thus relying exclusively on ARGO data would result in neglecting 30 to 45% of the global energy imbalance over this period.
Additionally, as we have repeatedly noted, we do not endorse or understand the need or the logic behind adoption of any single metric as 'the primary assessment tool' to monitor global warming. Arguably, the climate system of the Earth is as complex as the human body, yet we don't expect any single metric to indicate the health status of the body. It's critical to take all metrics and lines of evidence into account.
We do not agree with recommending OHC as the primary metric to monitor global warming. Firstly, the OHC data is sparser and younger than surface temperature measurements, and deep ocean data is lacking. Hansen et al. estimate that only ~55% of the global energy imbalance between 2005 and 2010 went into the upper 700 meters, and ~70% into the upper 1500 meters of ocean. Thus relying exclusively on ARGO data would result in neglecting 30 to 45% of the global energy imbalance over this period.
Additionally, as we have repeatedly noted, we do not endorse or understand the need or the logic behind adoption of any single metric as 'the primary assessment tool' to monitor global warming. Arguably, the climate system of the Earth is as complex as the human body, yet we don't expect any single metric to indicate the health status of the body. It's critical to take all metrics and lines of evidence into account.
-
Glenn Tamblyn at 14:02 PM on 13 October 2011The Deep Ocean Warms When Global Surface Temperatures Stall
David, Rob, Skywatcher. Take a look at a graph Albatross just posted on this thread. The sooner this data appears in a papoer the better. -
Composer99 at 13:51 PM on 13 October 2011Understanding climate denial
Jonathon: skywatcher has attempted to move the discussion on consensus to the appropriate thread. Might I suggest you re-post your comment there and continue the conversation on consensus where it is on topic?Response:[DB] Yes, by all means, the discussion on consensus should go there.
-
Rob Painting at 13:42 PM on 13 October 2011Greenland ice loss continues to accelerate
Adrain Smits @31 - "Hasn't anyone looked at sea level rise for the last 3 years?" See comments 21 & 30. Links are provided there. And note the large short-term exchange of water mass in the pic below, which affects sea level. Adrian Smits -"......or the ocean is not warming"
 I think you've been here long enough to navigate your way around this site. Further attempts to derail this thread will be deleted.
-
Jonathon at 13:38 PM on 13 October 2011Understanding climate denial
If that is the right question Bibliovermis, then yes. Therefore, everyone from SKS, myself, and other scientists like Roger Pielke Sr. and Richard Lindzen all agree with the consensus about AGW. Interesting perspective. -
muoncounter at 13:25 PM on 13 October 2011Pielke Sr. and SkS Disagreements and Open Questions
pielkesr#81: I cited the source of the graph in #78, which was the same source as used here. Wouldn't splitting the linear regression at 2002 require some physical justification for so doing? Or is it just to get 'a better fit'? -
Glenn Tamblyn at 13:25 PM on 13 October 2011The Earth continues to build up heat
Put Albatross's graph from NOAA @3 together with Rob Painting's post on Meehl (2011) and you have a thing of beauty. As the Skeptics keep asking, 'why did the Earth stop warming over the last decade?'. Answer. It Didn't, it just went deeper. And even during the deep solar minimum a couple of years back, it still kept warming. That graph needs to be disseminated widely!! -
Tom Curtis at 13:21 PM on 13 October 2011Pielke Sr. and SkS Disagreements and Open Questions
Dr Pielke @75, 1) The comments on your blog where made in a critique of Santer et al, 2011. They discuss detecting the signal of human effects on tropospheric temperature, and conclude (from their abstract):"A single decade of observational TLT data is therefore inadequate for identifying a slowly evolving anthropogenic warming signal. Our results show that temperature records of at least 17 years in length are required for identifying human effects on global-mean tropospheric temperature."
Therefore, for their purposes, and by extension for the purposes of this discussion, the change in tropospheric temperatures due to human influences are the signal, while changes due to natural variability are noise. If we where studying the effect of ENSO on global temperatures, then the anthropogenic warming and solar and volcanic influences would be noise, and ENSO related variability would be signal. But we are not. 2) Nobody that I know of says the linear trend of the data between 1998 and 2011 exlcusive, or 2004 and 2011 exclusive is not flat. What is disputed is whether that flatness is because the anthropogenic warming (signal) has ceased or significantly reduced; or because those intervals coincide with particularly strong natural variations which obscure the anthropogenic signal. Given that is the core issue, IMO at least, would you be so kind as to clearly state whether you think the flatness in the temperature trend between those intervals is due to a reduction of the anthropogenic warming (signal) or due to coincidence with strong natural variations (noise)? If the former, would you also state what relevance the flatness has to Santer et al, 2011 beyond the fact that they show that intervals at least 17 years are needed to reliably distinguish a weak warming signal (as predicted for climate models in the early 21st century) against background natural variablity? Frankly, I can see none! 3) Given that we know that El Nino's introduce a strong warming effect, and La Nina's a strong cooling effect to global temperatures, and given that Santer et al, 2011 where discussing detection of an anthropogenic warming signal, can you explain the appropriateness of choosing as a start date the year with one of the three strongest El Nino's in 136 years of records (1998) (SOI) and ending with one of the strongest La Nina's over the same period and the second weakest solar minimum in over a hundred years. Does not such a choice of start and end date maximize the influence of natural variability on the data, and thereby minimize the ability to detect the anthropogenic trend in the signal?
Given that a very large number of people, including politicians in control of our policy response to climate change, believe that the flat temperatures between 1998 and 2011 are a result of a cessation of anthropogenic warming, do you not wish to correct the record and firmly indicate that that flatness is only the consequence of natural variability and in no way indicates that we can afford to not respond to climate change?
Does not such a choice of start and end date maximize the influence of natural variability on the data, and thereby minimize the ability to detect the anthropogenic trend in the signal?
Given that a very large number of people, including politicians in control of our policy response to climate change, believe that the flat temperatures between 1998 and 2011 are a result of a cessation of anthropogenic warming, do you not wish to correct the record and firmly indicate that that flatness is only the consequence of natural variability and in no way indicates that we can afford to not respond to climate change?
-
pielkesr at 13:15 PM on 13 October 2011Pielke Sr. and SkS Disagreements and Open Questions
dana1981 - Regarding "However, as Santer et al. (2011) showed, "Because of the pronounced effect of interannual noise on decadal trends, a multi-model ensemble of anthropogenically-forced simulations displays many 10-year periods with little warming." In short, you're asking the wrong question. The long-term trend is often masked by short-term noise over periods on the order of a decade." I assume you are convinced the linear trend will then pick up soon. I am not as convinced as you are as I have less confidence in the models. However, time will tell which of us is correct. I agree; its time to move on. -
skywatcher at 13:14 PM on 13 October 2011Understanding climate denial
Bibliovermis, quite correct. Jonathon, if three scientists say the Earth is warming at 0.1, 0.2 and 0.3C per decade, +/-0.05C, is there a consensus that the Earth is warming? Note I did not ask if there is a consensus on how much, or if the warming rates are harmful in any way. That is a different, diversionary question. In real climate science, there is not agreement on every detail, such as the exact values of climate sensitivity, but there is agreement that the climate is sensitive to forcing, and that the forcing is mostly our fault. -
pielkesr at 13:12 PM on 13 October 2011Pielke Sr. and SkS Disagreements and Open Questions
muoncounter - The linear regression is certainly correct. However, it appears a two-piece linear regression split about 2002 fits the data better. Also, why have you not extended to to September 2011? -
Bibliovermis at 13:09 PM on 13 October 2011Pielke Sr. and SkS Disagreements and Open Questions
WoodForTrees: RSS MSU TLT plotted with 17 year mean The 17 year timespan determined by Santer, et al. is not flat. Based on this dataset, my expectation of the 17 year mean is 0.32 for 2016 and 0.42 for 2021. The raw temperature anomaly has wide divergence from that mean, so I am not going to hazard a guess. -
dana1981 at 13:03 PM on 13 October 2011Pielke Sr. and SkS Disagreements and Open Questions
Dr. Pielke, you suggest TLT is not evolving the way models predict, and ask"what is your expectation of the RSS MSU LT temperature anomalies over the next 5 and next 10 years?"
However, as Santer et al. (2011) showed,"Because of the pronounced effect of interannual noise on decadal trends, a multi-model ensemble of anthropogenically-forced simulations displays many 10-year periods with little warming."
In short, you're asking the wrong question. The long-term trend is often masked by short-term noise over periods on the order of a decade. However, we're going to explore this issue in greater depth in an upcoming blog post, so unless you have anything more to add to this particular discussion, we should move on to point #3. -
muoncounter at 12:50 PM on 13 October 2011Pielke Sr. and SkS Disagreements and Open Questions
pielkesr#76: "What is the purpose in disagreeing with a plot of the data?" So if we do not disagree with a plot such as this: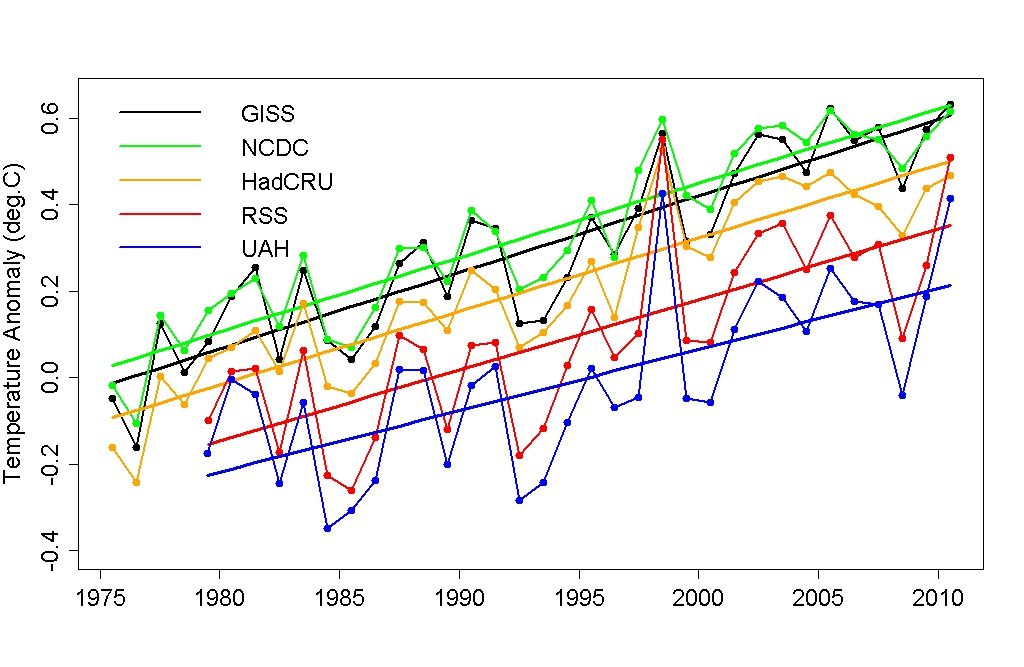 we must conclude there a number of short periods with 'little if any warming.' If these short flat spots are real and if they can be taken as signals of 'natural variation,' why would that matter over the long term? The long term warming trend swamps these supposed natural variations.
-
Bibliovermis at 12:22 PM on 13 October 2011Understanding climate denial
If the question is "Is the value greater than zero?", then yes - they are in consensus. -
Jonathon at 12:13 PM on 13 October 2011Understanding climate denial
Let me get this straight skywatcher. You feel that if one person believes that the climate sensitivity is one, and another believes that it is five, then they are both part of a consensus that believes that the range is between the two values? I think that constitutes disagreement. That is where we differ. I believe you are the one being debunked here. For the record, death would be a catastrophic event (on a personal level) as oppose to a minor injury. It was very relevant to the example, and not a diversion as you claim. It is awfully arrogant to claim that someone who disagrees with you is in error, especially since you have failed to show how I am wrong. -
Bibliovermis at 12:13 PM on 13 October 2011Pielke Sr. and SkS Disagreements and Open Questions
It is not a disagreement with the data. It is a disagreement with the usage of the data. You agree that the timespan is too small to smooth out natural variability. Why push an irrelevant point then? It would not be valid to say that there was rapid warming in 2009 and 2010. -
pielkesr at 12:08 PM on 13 October 2011Pielke Sr. and SkS Disagreements and Open Questions
Albatross - Linear trends are used in Christy et al since that is what everyone is using and we were examining the data using that widely applied (but inadequate) metric. If you look at the RSS MSU data, the data tells us that there has been little if any warming in the lower troposphere since ~2002. There is no other way to spin the data. You can make the claim that this is due to natural variability and I agree with that. However, it does not change that the trend is ~flat over recent years. I am quite puzzled by any disagreement with the obvious. You could also say there was rapid warming in 2009 and 2010 in that data and you would be right. What is the purpose in disagreeing with a plot of the data? My recommendation is to focus on the fact that CO2 concentrations are steadily going up. By linking to the temperature trends, if it does not evolve the way the models predict, you are fueling those who conclude that CO2 is not a problem to be concerned with. By focusing on the increase in atmospheric concentration, however, which has (very incompletely known) biogeochemical effects, you would be able to build a broader consensus that this an issue to be dealt with. As it is you are exposed to the more complex response of the climate system in terms of temperatures to the wide diversity of climate forcings. This is why, in my view, you are so vigorously defending the model-predicted linear trend of the global average surface temperature when anyone presents data that conflicts, even if on a short time period. My question to you, is what is your expectation of the RSS MSU LT temperature anomalies over the next 5 and next 10 years? -
pielkesr at 11:55 AM on 13 October 2011Pielke Sr. and SkS Disagreements and Open Questions
Tom Curtis - You write "As Dr Pielke believes the "flat" trend from 1998 (and 2002) is significant, perhaps he could point to the flat trend in the data once adjusted for these well known sources of noise?" First over the period ~2002 to 2011 the trend in the RSS MSU LT data is nearly flat - http://www.ssmi.com/msu/msu_data_description.html; see Fig 7. I never said it was statistically significant, but it certainly is distinct from the plots you have above. The surface and lower tropospheric trends are supposed to be in synch and they clearly are not as we reported in Klotzbach, P.J., R.A. Pielke Sr., R.A. Pielke Jr., J.R. Christy, and R.T. McNider, 2009: An alternative explanation for differential temperature trends at the surface and in the lower troposphere. J. Geophys. Res., 114, D21102, doi:10.1029/2009JD011841. http://pielkeclimatesci.wordpress.com/files/2009/11/r-345.pdf Klotzbach, P.J., R.A. Pielke Sr., R.A. Pielke Jr., J.R. Christy, and R.T. McNider, 2010: Correction to: "An alternative explanation for differential temperature trends at the surface and in the lower troposphere. J. Geophys. Res., 114, D21102, doi:10.1029/2009JD011841", J. Geophys. Res., 115, D1, doi:10.1029/2009JD013655. http://pielkeclimatesci.wordpress.com/files/2010/03/r-345a.pdf In terms of the "well known sources of noise" these are not noise but part of the climate system. -
Bibliovermis at 11:23 AM on 13 October 2011Understanding climate denial
"Denier" isn't an insult either. It's a basic definition straight out of a dictionary. -
muoncounter at 10:26 AM on 13 October 2011Understanding climate denial
warmist: A person who believes that the current global warming trend is the result of man-made factors. Among climatologists, global warming is just one scenario for the unusual atmospheric changes that have been observed throughout the world. Those who accept the global-warming theory are said to take the warmist position. ... —Howard Rheingold, "On Language; Succinctly Spoken," The New York Times, August 27, 1989 This has somehow morphed into an insult? Is that the best you've got? -
Tom Curtis at 10:22 AM on 13 October 2011Greenland ice loss continues to accelerate
mspelto @29, I had in mind specifically the reduction of permafrost in the inhabited areas of Greenland in terms of increase of arable land. However, I bow to your much greater knowledge in this area. -
skywatcher at 10:15 AM on 13 October 2011Understanding climate denial
#235 Jonathon, debunking what you said in #214 is not diversion. I focused on something you said 'for the record', and showed it was wrong. You brought up 'catastrophic' and you brought up 'strawman' (I never mentioned the word), maybe trying to divert from your prior errors? In fact, you're now providing a nice case study for this thread. See Is there a consensus for an on-topic comment on consensus occuring in the presence of a large range of values. -
Tom Curtis at 10:13 AM on 13 October 2011Pielke Sr. and SkS Warming Estimates
EliRabbet @78, you have quoted my comments, and I must say that I reject your comments. IMO, given the large scale motion of air due to the global circulation, specifically the Hadley and Ferrel cells, the effect of "purely local" forcings is more analogous to holding a magnifying glass to a stream of water than to a piece of paper. This is true even of non-dispersing radiative forcings (such as LC/LUC). It is certainly true of dispersing forcing agents such as aerosols, tropospheric ozone and BC which can disperse up to 12,000 km east/west, and 3,500 km north/south. -
skywatcher at 10:13 AM on 13 October 2011There is no consensus
From a debate on another thread where Jonathon argued: "For the record, I do not believe that a large range of values (whether it be climate sensitivity, projected warming, etc.) indicates that there is a consensus on the issue. On the contrary, it argues the opposite." I do think 'consensus' that some variable is changing can apply to a wide range of estimated values so long as that range does not include zero. There has been for many years a large range on estimated climate sensitivity (e.g. the oft-quoted 2C-4.5C per doubling CO2). I want to give another example where there was, for a great many years, a lot of uncertainty in the magnitude of a value, yet the existence of the change it implied was not questioned. For many years, there was a large range for estimated values of H0, the expansion rate of the Universe, which only recently has been narrowed down considerably. As recently as 1996, there were estimates as low as 40km/s/Mpc and as high as 100km/s/Mpc, it is now closer to 74km/s/Mpc. Edwin Hubble's initial estimate in 1929, after he first measured the redshift of spectral lines in Cepheid variables, was 500km/s/Mpc. Was there consensus in 1996 that the Universe is expanding? There certainly was. Was that based on a tightly-constrained value for the expansion rate? Absolutely not.
-
Michael Hauber at 10:11 AM on 13 October 2011The Earth continues to build up heat
From section 5: This more negative aerosol (or other) forcing is required for energy balance, as there was little surface warming over the last decade even though greenhouse gas concentrations continued to increase (with a small decrease in solar input) and the ocean continued to warm and sea level continued to rise. If I understand this correctly then the 'missing heat' is still missing. Deniers have seriously mis-represented the issue of missing heat. It is not that there is less heat in the ocean than the models predict. The missing heat arises if we total all the heat that we can track going into and out of the climate system; it doesn't agree with the total heat being accumulated in the system. Hence the 'more negative (or other)' forcing required to balance the heat budget. Finally as far as I can tell the total heat content of the ocean is not directly measured in this paper, but inferred from sea level rise, correcting for factors such as ice sheet melt, ground aquifer depletion, and then assuming the rest of the sea level rise is thermal expansion. The advance of this paper over previous studies is that the sea level budget has been balanced (as per introduction), although I haven't yet figured out what that actually means. -
Daniel Bailey at 10:10 AM on 13 October 2011Understanding climate denial
Ah, I see. Since "denier" is used to refer to those who deny climate science, "warmist" is thus used by deniers to refer to those who affirm climate science. Got it. -
Jonathon at 09:57 AM on 13 October 2011Understanding climate denial
Probably true Lloyd. Warmist appears similar, but opposite to denier. -
Albatross at 09:27 AM on 13 October 2011Pielke Sr. and SkS Disagreements and Open Questions
Hello Dr. Pielke, The discussion is getting side tracked. Let us recall that the topic at issue here is the choice of 1998 as a start date to support the claim (made on your blog) that there has been little or no warming for 13 years. Do you agree that it was perhaps an inappropriate start date and is without statistical significance? I'm sure that Lucia and Tamino would concur. Further, the choice of 1998 (and more recently 2002) is also puzzling given that you said on your blog that "I agree with Santer et al that “[m]inimal warming over a single decade does not disprove the existence of a slowly-evolving anthropogenic warming signal". Your arguments against using linear trends are also puzzling, especially given that in a recent paper that you co-authored with Christy et al. (2010), you used linear trends extensively. In fact, Adobe tells me that the word "trend" appears 126 times in your paper. Additionally, why is using a linear trend acceptable to suggest that there has been no warming for 13 years, but using a linear trend to challenge that assertion is not?
Prev 1474 1475 1476 1477 1478 1479 1480 1481 1482 1483 1484 1485 1486 1487 1488 1489 Next


