


 Arguments


Recent Comments
Prev 1563 1564 1565 1566 1567 1568 1569 1570 1571 1572 1573 1574 1575 1576 1577 1578 Next
Comments 78501 to 78550:
-
Tom Curtis at 19:21 PM on 15 August 2011Blaming nature for the CO2 rise doesn't add up
Crispy, you may wish to add to your homeworkd Indermühle et al, 1999 which discusses variation in atmospheric CO2 over the last 10,000 years: They ascribe the 15 ppm increase in CO2 concentrations over the course of the Holocene partly to deforestation, and partly to a rise in global sea surface temperatures. Such a rise is consistent with what is known about the Holocene Climactic Optimum (and should introduce due caution about overstating its extent) in that the high temperatures 8,000 years ago where primarily a Northern Hemisphere phenomenon, while the majority of the worlds ocean surface is in the Southern Hemisphere, which has been warming over that interval. The deforestation is ascribed partly to the desertification of the Sahara, but significantly (>50%) to the introduction and spread of agriculture. In other words, a significant part of the rise in CO2 levels over that period are anthropogenic.
Indermühle et al cite Bacastow, R. B. "The effect of temperature change of the warm surface waters of the oceans on atmospheric CO2" Glob. Biogeochem. Cycles 10, 319±333, (1996) and Takahashi et al, "Seasonal variation of CO2 and nutrients in the high-latitude surface oceans: A comparative study" Glob. Biogeochem. Cycles 7, 843±878 (1993), to say:
They ascribe the 15 ppm increase in CO2 concentrations over the course of the Holocene partly to deforestation, and partly to a rise in global sea surface temperatures. Such a rise is consistent with what is known about the Holocene Climactic Optimum (and should introduce due caution about overstating its extent) in that the high temperatures 8,000 years ago where primarily a Northern Hemisphere phenomenon, while the majority of the worlds ocean surface is in the Southern Hemisphere, which has been warming over that interval. The deforestation is ascribed partly to the desertification of the Sahara, but significantly (>50%) to the introduction and spread of agriculture. In other words, a significant part of the rise in CO2 levels over that period are anthropogenic.
Indermühle et al cite Bacastow, R. B. "The effect of temperature change of the warm surface waters of the oceans on atmospheric CO2" Glob. Biogeochem. Cycles 10, 319±333, (1996) and Takahashi et al, "Seasonal variation of CO2 and nutrients in the high-latitude surface oceans: A comparative study" Glob. Biogeochem. Cycles 7, 843±878 (1993), to say:
"A change of SST by 10C causes a change in the surface ocean's CO2 partial pressure by 4.2% which translates into an atmospheric change of similar magnitude."
That figure is consistent with the 10 ppm difference in CO2 concentration between the peak Medieval Warm Period and the minimum Little Ice Age values, for a temperature differential of just under 1 degree C, ie, consistent with various proxy reconstructions. What must puzzle anyone paying attention to the data is why, if the MWP only caused a 10 ppm excursion in CO2 concentrations, why did the only slightly warmer (to date) modern warm period cause a 120 ppm excursion in CO2 concentration (to date)? -
Crispy at 18:13 PM on 15 August 2011Blaming nature for the CO2 rise doesn't add up
Thanks guyz. Partial pressure, Henry's Law, Archer et al and 'OA is not OK' parts one to eleventy-seven. I have my homework. -
MarkR at 17:39 PM on 15 August 2011Blaming nature for the CO2 rise doesn't add up
18. keith , I haven't seen Salby's paper so I don't know. I'll be very surprised if it matches up with Bastardi's claims. Since that means he's breaking conservation of matter and that makes me (but apparently not Bastardi, Curry or Watts) very skeptical. 19. Crispy : for a very short answer, look up Henry's Law. Global temperatures have increased by 0.3% whilst partial pressure (related to concentration) has gone up 30%. It turns out that this pressure increase is enough to put plenty of CO2 into the oceans, which accounts for some of it. Without the increase in CO2 partial pressure (thanks to fossil fuel burning), the oceans would be taking up much less. -
Dikran Marsupial at 17:30 PM on 15 August 2011Blaming nature for the CO2 rise doesn't add up
Crispy As far as I know there hasn't been a discussion of this specifically. The pre-indistrial carbon cycle was in a state of approximate dynamic equilibrium. The equilibrium is established by the various positive and negative feedbacks being balanced. If the system is peturbed, then the feedbacks will no longer be balanced, but in a way that tends to drive the system back to its equilibrium state. If that were not the case then the system would not have been equilibrium in the first place. In the case of the oceans, the carbon fluxes between ocean and atmosphere depend on temperature (higher temperatures -> more CO2 emission/less uptake) and the difference in partial pressures (more atmospheric CO2 -> less emissions/more uptake). So if temperatures increase, more CO2 is released from the first mechanism, but only until the resulting increase in atmospheric CO2 leads to more uptake from the second mechanism. That is why small temperature changes don't result in large CO2 emissions from the oceans. If atmospheric CO2 rises (e.g. due to anthropogenic emissions) then the additional greenhouse effect means that there is a bit more emission from the oceans, but this is dominated by the second mechansim, which reduces emissions because the greater CO2 concnetration in the atmosphere makes ocean uptake increase. I suspect the additional uptake is going into both the oceans and the terrestrial biosphere, but it will be the oceans that ultimately do most of the work, as the capacity of the deep ocean is vast, but the rate at which carbon is moved from the surface ocean to deep ocean is slow. See this paper for details. -
Bern at 17:29 PM on 15 August 2011Blaming nature for the CO2 rise doesn't add up
Crispy: re oceanic uptake, I recommend you read the "OA is not OK" article series on here - it's giving a thorough overview of how & why the oceans are taking up CO2 from the atmosphere. I also understand that some research is showing that, yes, there has been some increase in biomass in some areas, but it's small compared to the oceanic uptake. I think there are two main reason things have been relatively stable for the last 10,000 years: 1) natural climate change is quite a slow process, by human standards - the rise from the last glacial maximum, while rapid by geological timeframes, took on the order of 10,000 years, twice as long as all of recorded human history (which is ~5,000 years); 2) the natural factors that induce 'rapid' natural climate swings (~10,000 year ones!) haven't been present - the Earth's climate appears to have spent most of the past 10 millennia in a quasi-equilibrium state, although some reconstructions suggest there was a gradual cooling trend from a peak ~8,000 years ago, which we've managed to completely reverse in just 250 years (mostly in the past century, and half in the last three decades). -
Dikran Marsupial at 17:08 PM on 15 August 2011Murry Salby - Confused About The Carbon Cycle
Dale While the natural carbon cycle does contain sources as well as sinks, the mass balance argument (presented numerous times here on SkS, in the IPCC WG1 reports and numerous peer reviewed papers) rules out the possibility that sources exceed sinks over the past fifty years beyond reasonable doubt. I have heard his podcast and he presented no argument that would refute the mass balance argument. -
Glenn Tamblyn at 17:07 PM on 15 August 2011OA not OK part 16: Omega
And WOW! There is a second series of posts on projections! How soon? -
Glenn Tamblyn at 17:05 PM on 15 August 2011OA not OK part 16: Omega
Great series. The interesting figure here is Aragonite in the Pacific. Already at 1000 m and farely steep slope to the surface. This looks like where we will see problems first as the curve shifts left. How much do the curves vary within and around each basin? -
mandas at 16:28 PM on 15 August 2011Blaming nature for the CO2 rise doesn't add up
I'm confused. Don't denialists claim that the globe is cooling, or that - at the very least - temperatures have not increased over the past decade? If so, how come CO2 is increasing? -
Dale at 16:26 PM on 15 August 2011Murry Salby - Confused About The Carbon Cycle
Albatross, affecting the climate is not just limited to CO2. As to accepting what he says, without seeing his evidence that brought him to his conclusion I can't presume if he's right or wrong. But I do accept there are natural causes of CO2 which may lead to an imbalance. I can also entertain his claim about ice cores, though not without scepticism before I see his evidence. -
Crispy at 16:07 PM on 15 August 2011Blaming nature for the CO2 rise doesn't add up
2 Dikran Marsupial: "BTW anthropogenic CO2 emissions do affect natural uptake and emissions; the reason that the natural environment is currently a net carbon sink is a response to rising CO2 levels caused by anthropogenic emissions." Has there been a discussion of that point here? I assumed some mechanism must be at play, since atmos C levels have been so steady for 10^5 years, prior to the last two hundred. Is there a gas pressure equation that dictates more oceanic uptake? Is all of the 15Gt going into the oceans each year? Or is all the extra plant food making things extra lush in the tropics? :) -
Albatross at 15:30 PM on 15 August 2011Murry Salby - Confused About The Carbon Cycle
Dale @18, "That humans alter the climate is no argument. " But that is the very point that Salby is denying. Salby is claiming that our CO2 emissions are not driving CO2 levels. So he is stating from the outset that we cannot affect global temperatures by emitting CO2, b/c he believes that we are not responsible for the increase in CO2 or the warming that he alleges has caused the increase in CO2. Therefore he is denying the reality that is the theory of AGW, and so is anyone (like Watts) who agrees with his hypothesis. With that all said, I gather from your odd posts (and the quote) that you agree that the theory of AGW is real. Good. This thread is about the fatal flaws Salby's hypothesis, so please do not try and drag us all off-topic by being argumentative or floating red herrings or making strawman arguments. And DSL @24 asked you a very pertinent question about Salby's work-- do you accept it? I'll add another, do you, trying to be truly skeptical, see any potential flaws in his reasoning? Answer those directly (no obfuscating or hand waving) and you'll be staying on topic. -
alan_marshall at 15:18 PM on 15 August 2011Soil Carbon in the Australian Political Debate (Part 1 of 2)
Marcus @3 I agree that the CO2 emissions from burning fossil fuels vastly exceed that which can readily be sequestered by agricultural means. However, with the CO2 at 393ppm and rising, we are on a trajectory that will take us into the “red zone” within a few decades. A growing number of voices, such as Bill McKibbin’s 350.org are calling for the world to adopt a more ambitious target of 350 ppm. We are in an “overshoot” scenario. If we are ever to return to a safe level, we will need to sequester the excess CO2 now in the atmosphere. I want to thank you all for your feedback. Your comments have been thoughtful. Take another look on Thursday, when Part 2, looking at the political implications, will be posted. -
alan_marshall at 14:02 PM on 15 August 2011Soil Carbon in the Australian Political Debate (Part 1 of 2)
adelady @1, lazyteenager @2 You are both right in recognising the virtues of charcoal / biochar, of which I am a big fan. It would be worthy of a separate post. The reason I have focused on soil carbon is its prominence in the current political debate in Australia. The first and greatest virtue of biochar for sequestration purposes is its stability. That automatically leads on to its second virtue, which is the ease with which the stored carbon can be accounted. The third virtue is the quantity that can be stored on a given area of land, and the fourth virtue, which it shares with soil carbon, is its enhancement of fertility. Indeed, the terra preta soils in the Amazon Basin cover great swathes of land, and suggest that the fertility of that area once allowed it to sustain a much higher population. Biochar is a stable form of charcoal produced from heating natural organic materials (crop and other waste, woodchips, manure) in a high temperature, low oxygen process known as pyrolysis. Click here for fact sheet. The by-products of the process are the gases carbon monoxide and hydrogen, which together can be synthesised into bio-fuel. It is not easy to get consistent figures for the cost of production of biochar. My estimate of $65 per tonne is based on the price of agricultural charcoal, offset for the value of bio-fuel. If anyone has a more reliable figure, please let me know. The potential of biochar was recognised and promoted by Australia’s previous leader of the opposition, Malcolm Turnbull. However, interest in the technology has been quietly dropped by the current opposition leader, who is not prepared to put serious money into mitigation. -
Bob Lacatena at 13:52 PM on 15 August 2011One Confusedi Bastardi
3, muoncounter, Which only goes to show the old expression, you can lead a horse to water, but you can't drag him in against his will, drown him, cook him, and sell him as gourmet beef without the assistance of an entire Fox News news team (or at least Fox andFriendsFrauds). -
Dale at 13:38 PM on 15 August 2011Murry Salby - Confused About The Carbon Cycle
I thought my initial comment was obvious that I'm not presuming anything about Salbys work till I've seen the data.Moderator Response: (DB) Actually, you were calling out the SkS author as being presumptuous to do a takedown of Salby's work even though it isn't published yet (which reduces Salby to offering up unsupported handwaving blandishments in his public discoursing and also makes the "skeptic" community look quite foolish for buying the pig unseen). -
skywatcher at 12:56 PM on 15 August 2011Trenberth on Tracking Earth’s energy: A key to climate variability and change
Doug, as others have said, you're clearly making up an alternative universe here, and ignoring the physics and mathematics, and most crucially the evidence along the way. You should be aware that a major in physics and maths does not automatically confer an understanding about earth science or climate science, just as the reverse is true. You have been directed to a number of excellent initial sources of information by the patient commenters above. Have a read of them, and you can begin your journey into the world of real climate science. I admire the patience of people here dealing with you, but I am also disappointed that you have been allowed to totally derail a thread in which Kevin Trenberth at #68 took the time to answer queries regarding his opening article. It's kudos to SkSci that he did this as you don't often get a chance to exchange views with the most active climate scientists in the world, but a shame the discussion could not have continued from there. Up until that point I was learning quite a lot. I presume he's no longer reading this thread, but I appreciated both the article and his reply to some of the first 67 posts. Perhaps this is another example where a RC-like 'bore hole' or 'climastrology' thread into which to drop these kinds of persistently made up and irrelevant posts by DougCotton would be a good addition to Skeptical Science? The fish can be shot in the barrel in a place where they do not detract from interesting topics! -
DSL at 12:47 PM on 15 August 2011Murry Salby - Confused About The Carbon Cycle
Dale, I never stereotyped you. I responded to the odd logic of your comments and your quite deliberate word choice. I could go a bit further than DB's quite adequate reply, since it's one of my areas of study, but I won't. You've provided nothing resembling a defense of Salby. Your short initial comment was responded to by DM, and you've done nothing but hem-haw and dance around since. What do you think of Salby's work, Dale? Do you accept it? -
alan_marshall at 12:40 PM on 15 August 2011Soil Carbon in the Australian Political Debate (Part 1 of 2)
LazyTeenager @1 Mature forest is of course in equilibrium as far as the carbon cycle is concerned. It is important to preserve them as stores of carbon, but as you point out, sequestration only occurs in growing forests. In Australia, much of our eucalypt forest has been logged, so the secondary growth is a potential carbon sink. Eucalypts are fast growing, and include some of the tallest species of trees on Earth. So there is plenty of "upside". As far as the economics is concerned, my source is "The Cost-Effectiveness of Carbon Sequestration in Harvested and Unharvested Eucalyptus Plantations" by A. J. Richardson. On my website www.climatechangeanswers.org, I have published a cost comparison of carbon sequestration options. I have been a little more conservative than Richardson, estimating the cost of the unharvested eucalypt plantation option at $20 per tonne of CO2. That makes it cheaper than soil carbon, but the land cannot be used for other agricultural purposes. Your other point is also well made. It is estimated that between 70% and 90% of the carbon in crop residue is returned to the atmosphere within a few years, therefore involving minimal sequestration. That is why my post focuses on the gel-like humus, which degrades much more slowly, returning just 2% of stored carbon back to the atmosphere per year. (Forgive me, I am still searching for the scientific paper in which I recently read these figures.) Where land use switches to no-till practices, carbon levels will increase to a point where the fresh humus created each year is in equilibrium with that which is lost. -
muoncounter at 12:38 PM on 15 August 2011Trenberth on Tracking Earth’s energy: A key to climate variability and change
Doug#190: No one said anything of the kind; please try to read carefully. You, on the other hand, have denied the role of solar radiation in the energy balance of the earth. Good luck selling that! Now say goodbye for real. -
DougCotton at 12:31 PM on 15 August 2011Trenberth on Tracking Earth’s energy: A key to climate variability and change
( -Snip- )Response:[DB] Mr. Cotton, as you have previously stated that you wouldn't be back and then rescinded that offer, and have continued (despite able advice to the contrary) to avoid supporting your position with actual physics-based mechanisms with roots in the literature, and since you have expressed being away for 2 weeks on business anyway, it is time for a break.
I'll leave this up for a bit, then your SkS account posting privileges will be suspended until September. You may then resume participating here, but you will still be held to the mandate of basing your comments on scientifically supported basis' and also to "not make stuff up".
-
Dawei at 12:20 PM on 15 August 2011SkS Weekly Digest #11
Hah! I think that's the first toon I've seen that actually made me lol. -
adelady at 12:19 PM on 15 August 2011Trenberth on Tracking Earth’s energy: A key to climate variability and change
One more try. Doug, we've referred to Science of Doom a few times. This page is helpfully titled "Confusion over the basics". It refers to just one of the sections on back-radiation and several other nice expositions on various topics. I've been through most of these myself. You may be like me and sign up for the "skip the equations" club. It makes my life easier - but - it does mean that I'm obliged to take experts at their word on the content and meaning of those equations. (and sometimes just sit back and watch admiringly when they argue about arcane minutiae I've decided not to expend effort on myself.) Either way, you're in for a fair amount of reading. And if you really want to be fully involved in technical discussions, you're in for a lot of detailed note taking and serious brain work. -
muoncounter at 12:17 PM on 15 August 2011Trenberth on Tracking Earth’s energy: A key to climate variability and change
DC#187: "I carefully chose the words "for whatever reason."" Yes, and empty words they are. "Physics tells us " You are using no physics. You are making things up on the fly to suit your preconceived notions. Your analogies are bogus. In other lines of work, that would be called 'fraud' (but not here, because of the Comments Policy). -
DougCotton at 12:11 PM on 15 August 2011Trenberth on Tracking Earth’s energy: A key to climate variability and change
#179 Muon: (a) There is as yet no scientifically proven theory (out of at least half a dozen suggested by various scientists and academics) which explains the natural variations in climate which are part of the historic record. Hence I carefully chose the words "for whatever reason." (b) It is irrelevant what you or anyone calls what I call the "break out" temperature. It is derived by extrapolating the linear trend of the downward temperature gradient from the core to the surface, and so it is the intercept of that trend line at the surface. (c) Physics tells us that the rate of terrestrial heat flow is not what is important - yes it is slow, simply because the rate of conduction of rock and clay etc is slow. So too is the rate of conduction of the heat through the glass in the room. It doesn't matter. There has been plenty of time in the life of the Earth. (d) If you or anyone is trying to tell me that the heat in the oceans is going to affect the heat under the whole of the Earth's surface including the core, rather than vice versa (as Physics dictates) then you are not correct.Response:[DB] Mr. Cotton, I simply cannot tell if you are being intentionally obtuse and evasive or merely relying upon natural ability and giftedness.
In any event, you are completely and utterly wrong here. I suggest starting at square one and grabbing a physics textbook for starters. You are many years of study from being able to get a good handle on climate science.
-
DougCotton at 11:51 AM on 15 August 2011Trenberth on Tracking Earth’s energy: A key to climate variability and change
( -Snip- )Response:[DB] Please note my replies to you upthread in 180 and 184. Tom has already expressed his frustration in dealing with your disingenuousness.
Either follow the direction given or give it a rest.
-
scaddenp at 11:45 AM on 15 August 2011Trenberth on Tracking Earth’s energy: A key to climate variability and change
Sigh - so know we have argument from Personal Incredibility? You have been pointed to papers, articles, had question patiently explained but no, it appears you prefer ignorance to actually finding the answer. You can "suggest" whatever, but I will stick to strong mathematical theory, rigorously tested against empirical data thanks. -
Bern at 11:35 AM on 15 August 2011SkS Weekly Digest #11
newcrusader: that's what all the funding for 'skeptical' scientists is for. So long as there are 'climate scientists' who are preaching that global warming isn't happening, the deniers can point to that and say "but these experts said it wasn't happening!". As for the 'experts' themselves... well, it becomes difficult to prove criminal behaviour without any direct evidence that they knew they were wrong, as opposed to just being wrong, also that they knew their actions would result in significant damage or losses to others. Similarly, there is lots of circumstantial evidence that certain 'experts' were paid a lot of money to cast unsubstantiated doubt on claims that smoking causes cancer, but is it enough to stand up in a court of law? Then you need to have someone actually interested in prosecuting the case. Even if that happens, will they just hide behind the corporate veil, and have the company pay a fine while none of the individuals concerned actually suffer any direct consequences? That seems to be a common outcome - and, to me, is a key argument as to why corporations should not be classed as 'natural persons' legally - they don't share the risks that real people do, such as spending time in prison. Penalties are normally limited to fines, it takes something exceptional for the actual people within a corporation to be punished directly. -
DougCotton at 11:25 AM on 15 August 2011Trenberth on Tracking Earth’s energy: A key to climate variability and change
Tom: Re #181 Just briefly, then I must get on with business matters for 2 weeks: please read my #180 then note .. ( -Snip- )Response:[DB] Please note that posting comments here at SkS is a privilege, not a right. This privilege can and will be rescinded if the posting individual continues to treat adherence to the Comments Policy as optional, rather than the mandatory condition of participating in this online forum.
Moderating this site is a tiresome chore, particularly when commentators repeatedly submit offensive, off-topic posts or intentionally misleading comments and graphics or simply make things up. We really appreciate people's cooperation in abiding by the Comments Policy, which is largely responsible for the quality of this site.
Finally, please understand that moderation policies are not open for discussion. If you find yourself incapable of abiding by these common set of rules that everyone else observes, then a change of venues is in the offing.Please take the time to review the policy and ensure future comments are in full compliance with it. Thanks for your understanding and compliance in this matter, as no further warnings shall be given.
-
Bern at 11:18 AM on 15 August 2011OA not OK part 16: Omega
Hmm... if I've understood this correctly, does this mean that deep coral reefs will start to dissolve first? I have to admit, that's a novel idea for me - I had assumed that increasing atmospheric CO2 would mean surface reefs would be affected first, but I guess that's just not so! Could this undermine some old, 'tall' reefs, leading to some rather dramatic collapses as their foundations literally dissolve away? I imagine any other islands or other pieces of land with significant carbonate content will also have this problem. Could be interesting (in the Chinese proverbial sense). -
Tom Curtis at 11:12 AM on 15 August 2011Trenberth on Tracking Earth’s energy: A key to climate variability and change
"Remember that, according to 2008 NASA diagrams, 5% of total incident insolation is conducted to the atmosphere (not radiated) and then drifts upwards by convection. This may take months to get to the top of the troposphere, for example."
In fact it takes mere days for heat to get to the top of the atmosphere in its optically thick wavelengths by radiation, and mere hours by convection. Again Doug just makes things up with no attempt to check his assumptions against reliable sources. I do not find this game of wack-a-mole amusing. I participate in these threads to counter disinformation for the benefit of interested readers who have not made up their minds to believe anti-science rather than reality. If a denier comes along who just throws out falsehoods as fast as he can imagine them, I cannot keep up, and nor should I have to. We are frequently reminded that posting on Skeptical Science is a privilege, not a right. DougCotton is clearly intent on abusing that privilege. Can I suggest that in future his posts be simply deleted unless he backs every disputed or dubious claim with a reference to either a text book or the peer reviewed literature. For me it is a matter of both good manners and ethical necessity to take reasonable efforts to ensure that the information you provide is accurate (and to correct it when you discover it is not). I think that is a reasonable standard to expect of any poster on this site. I would go further. Anybody who does not accept the obligation to self fact-check shows by their actions that the truth of what they say is of no consequence to them. They value that truth at the same level as the effort they are prepared to expend to ensure that what they say is true, which in DougCotton's case is clearly no effort at all. At that point the question as to whether they are actively dishonest (ie, the knowingly tell untruths) or simply negligently dishonest (ie, they tell untruths because the cannot be bothered to make the effort of telling truths) is purely academic. They are enemies of truth regardless and have no place in public discourse. ( -Snip- )Response:[DB] A-step-too-far snipped.
-
adelady at 11:07 AM on 15 August 2011Trenberth on Tracking Earth’s energy: A key to climate variability and change
This thread may have been annoying and irritating. But. I will treasure forever "data is not a Rorschach test". -
Tom Curtis at 10:56 AM on 15 August 2011Trenberth on Tracking Earth’s energy: A key to climate variability and change
DougCotton @176, data is not a Rorchach Test for you to read in whatever your preferred theory. It carries distinctive information which tends to confirm some theories, and invalidates others. In this case, the observed OLR clearly invalidates any theory that does not acknowledge that CO2 in the atmosphere has a warming effect on the surface. In fact, the observed data is logically inconsistent with any theory that does not include a warming effect from CO2. In order to continue your rorschach approach to science, you focus on the size of the reduction in Outgoing Long wave Radiation as proof that the down welling long wave radiation must be small. It never occurs to you to look at the down welling long wave radiation itself, or to accept its measured values, and the global estimates derived from those measurements. Well, here is some actual data. Anybody committed to following the data rather than imposing their view regardless of the data will clearly see the down welling long wave radiation is very significant: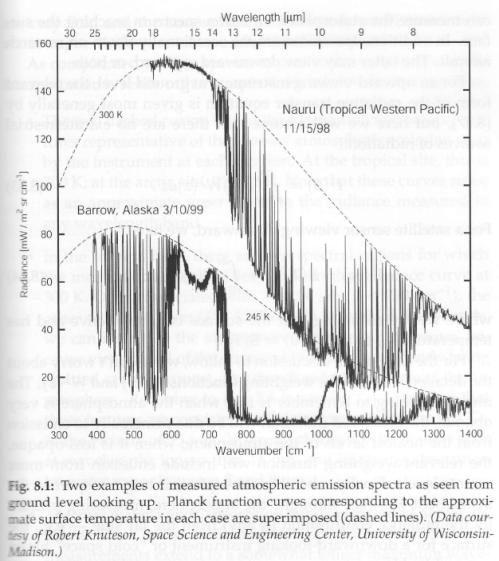

 As can be seen, the down welling long wave radiation is large, particularly in the tropics. In Darwin in winter (June), it still has a mean value of 372 W/m^2. In summer (January) that rises to 430 W/m^2.
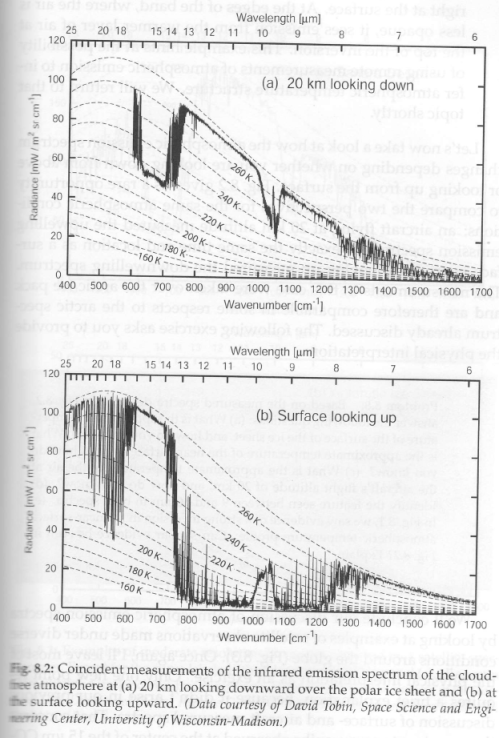
You want to ignore that fact because of the size of the CO2 notch. As can be seen from the following simultaneous spectrums over Barrow Island (in the Arctic) the size of the CO2 notch is not a reliable guide to the amount of back radiation, and certainly does not determine the quantity of that radiation. That you should think so suggests you are again employing your absurd single layer atmosphere model.
As can be seen, the down welling long wave radiation is large, particularly in the tropics. In Darwin in winter (June), it still has a mean value of 372 W/m^2. In summer (January) that rises to 430 W/m^2.
You want to ignore that fact because of the size of the CO2 notch. As can be seen from the following simultaneous spectrums over Barrow Island (in the Arctic) the size of the CO2 notch is not a reliable guide to the amount of back radiation, and certainly does not determine the quantity of that radiation. That you should think so suggests you are again employing your absurd single layer atmosphere model.
 And just to prevent a confusion before it starts, the back radiation has not effect on the long term energy balance, which is governed by the net Top of Atmosphere energy balance. If Back Radiation is high, that just results in more convection carrying heat away from the surface - if it is low, that is compensated for by less convection. In the end the TOA balance governs all.
-
DougCotton at 10:55 AM on 15 August 2011Trenberth on Tracking Earth’s energy: A key to climate variability and change
Just one more thing for you to think about for the next two weeks before I return... Note the conclusion of the quote in #167 about there being inadequate records of all the mentioned factors for climate models. This means that it is impossible to determine whether or not all radiation is escaping to space from empirical measurements of radiative flux, due to the inadequate information we currently have on other factors that could causes differences between incoming and outgoing radiation. I have put forward a sound physical argument (#176) as to why I believe all radiation is escaping. Remember that, according to 2008 NASA diagrams, 5% of total incident insolation is conducted to the atmosphere (not radiated) and then drifts upwards by convection. This may take months to get to the top of the troposphere, for example. The rate at which it does determines the temperature gradient of the atmosphere, not any supposed warming due to CO2 captures. You cannot produce any evidence that all radiation is not escaping, including that originating from the extra energy in any molecules which may have been warmed by CO2 captures. Carbon dioxide is but a small leaking dam at the foot of a mountain which can never cause the gradient of the creeks coming down to alter, and never cause a flood at the top.Response:[DB] "I have put forward a sound physical argument (#176) as to why I believe all radiation is escaping."
Umm, nope, not so much. You have spent many an electron detailing fanciful conjecture with no supportive physics. In short, you are spinning yarns. Fiction. As in "making things up".
This is a science forum wherein interested individuals discuss the science of climate and climate change. Please spend some time trying to learn enough of it to carry on some 2-way dialogue with other parties here.
Muoncounter asked you some excellent questions in number 172 above. I will hold you to answering them before this can go on to other things. As it stands right now, you are wasting others time due to a lack of interest in actually learning.
-
muoncounter at 10:52 AM on 15 August 2011Trenberth on Tracking Earth’s energy: A key to climate variability and change
adelady#178: "Check the definition" Mr. Cotton doesn't need definitions; he prefers making stuff up (break out temperature?) For the rest, we could start with the fact that geothermal forcing is much much less than radiative forcing (its on a prior thread). So his 'small glass in a room/drop in a hot coin' analogy is yet another case of not enough fact, too much hot air. "Vary naturally for whatever reasons"? And this is what we are supposed to believe is physics? -
keithpickering at 10:50 AM on 15 August 2011Blaming nature for the CO2 rise doesn't add up
Make it simple: Murray Salby is violating Conservation of Matter. His paper cannot possibly pass peer-review for that reason. -
adelady at 10:41 AM on 15 August 2011Trenberth on Tracking Earth’s energy: A key to climate variability and change
#177 "It certainly must have done so during ice ages for example." Doug! Check the definition of 'ice age'. I'll leave others to deal with the rest of this one. -
newcrusader at 10:21 AM on 15 August 2011SkS Weekly Digest #11
Funny Cartoon- sadly true. but those who are lying- the question in the future are they criminally going to be responsible? -
Daniel Bailey at 10:05 AM on 15 August 2011SkS Weekly Digest #11
Nice 'toon. I deal with reassured people every day. -
DougCotton at 09:55 AM on 15 August 2011Trenberth on Tracking Earth’s energy: A key to climate variability and change
Tom #173: Regarding your point on thermal inertia, let me start with an analogy which I will come back to at the end: Imagine a small glass of water in an air conditioned room. The water represents the oceans and the room represents the whole of the Earth beneath the surface. Leave the glass for a few hours and the water ends up at the same temperature as the room. Drop a hot coin in the glass (representing the warming by the sun that day) and it also cools down to a "base" temperature supported by the heat in the room. To warm everything you have to alter the air conditioner setting. Now, as we have seen in this Trenberth article, the heat above the crust is contained in (roughly) 90% ocean, 6% land, 4% atmosphere. Compared with all of this, the heat in the rest of the Earth below the surface (and below the floor of the oceans) is many orders of magnitude greater. What the atmosphere and oceans "see" is what I call the "break out" temperature at the surface (or floor of ocean) of the temperature gradient of the heat flow from the core. For example, German borehole data showed 270 deg.C at 9,000 metres with a linear trend down to about 12 deg.C at the surface. (I suggest it would be about 25 deg.C at the equator and well below freezing point at the poles. It is roughly the 4am temperature on a calm night.) I suggest that this "break out" temperature can vary naturally for whatever reasons. It certainly must have done so during ice ages for example. It is the "temperature in the room" in my example, and the natural causes affecting it are the air conditioner. The oceans, the land and the atmosphere are all controlled by it, just as is the temperature of the water in the glass and that of the coin. -
DSL at 09:55 AM on 15 August 2011Murry Salby - Confused About The Carbon Cycle
Dale, seriously. Do you not understand how the economic activity of just ten billion human beings over the course of the last century has significantly altered the biosphere, atmosphere, and geosphere? The published evidence would take days to sort through, but the observable evidence is all around. -
DSL at 09:47 AM on 15 August 2011Murry Salby - Confused About The Carbon Cycle
"The system is so complex that our understanding of how climate inter-relates is still really just scratching the surface." Not really, Dale. Atmospheric composition is well established. The physics of the components are well-established. Cyclical processes are well-understood. Long-term cycles are less well understood, but the range of possible basic mechanisms has been narrowed considerably. "To say that humans are 'almost entirely responsible' . . ." I believe the claim was that humans are responsible for the increase in CO2. Do you not find this to be likely with a very high level of confidence? If so, why not? " . . . for climate change is, IMO, a bit silly considering the power of nature to alter its own course," Yikes, talk about religion. If nature can alter its own course without recourse to its physical 'laws' then we can toss the entire project of science right now. This is why religion and science truly cannot co-exist, unless the deity/ies is/are constrained by their own initial laws. "and the fact we still really don't know how each part of the system inter-relates and feeds back on itself. To not acknowledge these facts is a form of denial itself." We have a very firm grip on this, Dale. Are you suggesting that we stop trying to learn more? Because if you're suggesting that 150 years of our best efforts have ended up fruitless, you truly have a lot to learn. Grab a textbook, dude. -
adelady at 09:33 AM on 15 August 2011Soil Carbon in the Australian Political Debate (Part 1 of 2)
LazyTeenager. If you look at the archeology of terra preta soils you'll see that if manures and other nutrients are combined with charcoal, the structure and carbon content can be retained for millennia. Without using charcoal or biochar, you may not get much more than a century or so. Seeing as farmers are committed to improving their soils on decade/generation timescales, this isn't much of a problem. They already spend bulk money on their current land management practices. It's really a matter of finding ways to make a different regime of land management maintain profitability. (Fertility is not the main issue because higher humus soils are almost automatically more fertile.) The central problem is that this issue has been ignored for such a long time. The research is likely to be playing catch-up (or leap-frog) with implementation for quite a while. The eternal issue in farms and forestry is continuation of good practice when land is sold. Every farming community has horror stories of how a 'beautiful' property was absolutely wrecked by a new owner (or the next generation) overgrazing or denuding vegetation or drying up a creek by their incompetent management. I think it will eventually become a bit like windfarms. A small annual payment for increasing and maintaining carbon values - by some agreed formula for measurement. That word 'agree' will likely ensure that the policy won't be easy or quick to implement. -
DougCotton at 09:28 AM on 15 August 2011Trenberth on Tracking Earth’s energy: A key to climate variability and change
In response to all: Please respect the fact that I am behind with business matters and, whilst I believe I can respond satisfactorarily to all points raised, posts on here are not the place because it will require much more detail. I will be adding a page about all this (you know where) in about two weeks time. In the meantime I shall address the key issue in the final paragraph of #165, because, unless anyone can show sound reasons (based on physics) that what I say there is incorrect, then my case stands. Here then is a more detailed explanation which needs to answer the question ... What happens to back radiation (which I have also called feedback) in particular that from CO2 when it strikes the solid surface? It creates heat which flows into the surface during the "warm-up" phase in the morning and maybe early afternoon. As the night approaches that heat can flow out at a similar rate to which it flowed in. Allowing for cloud cover, there are less than 12 hours of direct sunlight on average, so it has a reasonable, though not certain, probability of cooling off by about 4am (say) half way between summer and winter. In summer it may not cool off entirely, so heat builds up in that hemisphere, particularly in the oceans which hold about 90% of all heat (continents ~6%, atmosphere ~4%.) We know the local surf is warmer in summer. So, what comes in as CO2 frequency photons then becomes heat. Then that heat (along with the heat that came from direct sunlight) is radiated as the surface cools and that radiation contains many other IR frequencies (ie it is "full IR spectrum" near enough.) From the area of the notch in the chart Tom provided, we can see that only a small percentage is captured by CO2. And so, when the process repeats over and over, it rapidly approaches a limit where virtually all go to space. It makes little difference what size that notch is because it is still a small portion of the total area under the curve. -
Tom Curtis at 09:26 AM on 15 August 2011Murry Salby - Confused About The Carbon Cycle
Dale @18, "to preach", according to the Shorter Oxford English Dictionary, is to "pronounce a public discourse about sacred subjects", or "to utter an earnest exhortation, especially moral or religious". Consequently your claim that "preach" is not specifically religious is dubious, and to suggest that the IPCC "Summary for Policy Makers" or the various testimonies of scientists to Congress are preaching is an abuse of the word. It is also clearly suggests their evidence constitutes, at minimum, a moral exhortation rather that what it actually is, the presentation of scientific fact. -
muoncounter at 09:21 AM on 15 August 2011Murry Salby - Confused About The Carbon Cycle
Dale#18: "to preach is to urge or publicly proclaim" Cherrypick! The full definition your cut from (google dictionary): Publicly proclaim or teach (a religious message or belief) -- emphasis added This is not how science is communicated. -
Marcus at 09:19 AM on 15 August 2011Soil Carbon in the Australian Political Debate (Part 1 of 2)
I'm afraid that LazyTeenager is correct. Though Soil Sequestration in an option, certain people have massively overstated its benefits, usually as a means of overlooking the obvious-namely reduction of our use of fossil fuels! -
LazyTeenager at 09:19 AM on 15 August 2011Soil Carbon in the Australian Political Debate (Part 1 of 2)
One crazy idea I had was that soil carbon could be increased by forestry slow burns. As long as the temperature was not hot enough to oxidize the soil and the charcoal yield was high, the sequestration rate would be high and cumulative over time as the process was repeated. Charcoal of course is very resistant to oxidation when buried and so the sequestration time scales should be very long. -
Marcus at 09:14 AM on 15 August 2011Murry Salby - Confused About The Carbon Cycle
Dale, there are very few advocates of AGW who are of the view that climate change has *no* natural component. The problem is that all the recent, natural climate change factors-like Sunspots-should have resulted in a modest cooling, if anything, yet we're currently encountering the most rapid warming we've ever seen in the historical records. Yet we have people like Watts denying that its even happening! -
Dale at 09:10 AM on 15 August 2011Murry Salby - Confused About The Carbon Cycle
@Mod #16 The terms "preach" and "doctrine" do not specifically have religious definitions. To preach is to urge or publicly proclaim (which is exactly what the IPCC "Summary for Policy makers" does as well as scientists in front of Govt hearings), and a doctrine is a position in a branch of knowledge or belief. These terms fit very tightly with AGW, as the position of the branch of knowledge is proclaimed publicly through the urgings of scientists and the IPCC. Doctrine is also the term used for Govt agreements on an International level, which as far as I'm concerned what a lot of all this is about, how we deal with this at a global level. Also, Albatross wrote "The underlying foundation of the theory of AGW, is as the name suggests that we are almost entirely responsible for increasing CO2 (and other GHGs), so to deny that or not accept that is to be a denier of AGW." That humans alter the climate is no argument. That the Earth has warmed is no argument. The extent to which humans are responsible for the warming, IS the argument. The term "almost entirely responsible" is the real unknown in climate science. The system is so complex that our understanding of how climate inter-relates is still really just scratching the surface. To say that humans are "almost entirely responsible" for climate change is, IMO, a bit silly considering the power of nature to alter its own course, and the fact we still really don't know how each part of the system inter-relates and feeds back on itself. To not acknowledge these facts is a form of denial itself.Response:[DB] "the fact we still really don't know how each part of the system inter-relates and feeds back on itself"
When you say "we" you really mean "I". The people who've made a profession of studying climate science actually have a pretty good handle on all of the things you mention. That you characterize it as being (in large part) uncertain merely demonstrates that you haven't put much time and energy into its study.
Albatross, being a working scientist in the field, speaks from a point of strength of knowledge about the subject.
Per Dictionary.com:
preach
[preech]verb (used with object)1. to proclaim or make known by sermon (the gospel, good tidings, etc.).
2. to deliver (a sermon).3. to advocate or inculcate (religious or moral truth, right conduct, etc.) in speech or writing.verb (used without object)4. to deliver a sermon.5. to give earnest advice, as on religious or moral subjects or the like.6. to do this in an obtrusive or tedious way.noun1. a particular principle, position, or policy taught or advocated, as of a religion or government: Catholic doctrines; the Monroe Doctrine.2. something that is taught; teachings collectively: religious doctrine.3. a body or system of teachings relating to a particular subject: the doctrine of the Catholic Church.
Prev 1563 1564 1565 1566 1567 1568 1569 1570 1571 1572 1573 1574 1575 1576 1577 1578 Next


