


 Arguments


Recent Comments
Prev 1565 1566 1567 1568 1569 1570 1571 1572 1573 1574 1575 1576 1577 1578 1579 1580 Next
Comments 78601 to 78650:
-
Dikran Marsupial at 04:39 AM on 14 August 2011Climate Denial Video #3: Polluters Use Same Tactics As Tobacco Industry
apiratelooksat50 wrote "And, you know all this how?" reading the documentation for the petition project would tell you that they organisers make no distinction between climate graduates and those actively pursuing careers in climatology. But surely you knew that already? The survey however does verify this distinction. -
apiratelooksat50 at 04:27 AM on 14 August 2011Climate Denial Video #3: Polluters Use Same Tactics As Tobacco Industry
TC at 21 "But what of your 39 climate scientists who do not accept the consensus? The simple fact is that most science graduates do not go on to research. They still get counted as scientists for the purposes of the petition, even if their day job is slinging burgers at MacDonalds." And, you know all this how? At the end of the day, you still have 30+ climate scientists who went through the trouble of submitting the paperwork to have their names added to the petition, vs. 75 climate scientists who answered a vaguely worded, online, 2 question survey designed to ensure participation. -
Dikran Marsupial at 03:44 AM on 14 August 2011Blaming nature for the CO2 rise doesn't add up
wingding However it is implausble if we want to do some science where the causal mechansim must also be plausible. The problem for Salby is that the numbers don't add up for his theory. The fact that the numbers do add up for your (physically implausible) "theory" doesn't change the fact that they don't add up for Salby's. BTW anthropogenic CO2 emissions do affect natural uptake and emissions; the reason that the natural environment is currently a net carbon sink is a response to rising CO2 levels caused by anthropogenic emissions. -
actually thoughtful at 03:28 AM on 14 August 2011Skeptical Science Helps Students Debunk Climate Myths
Apirate, My comment wasn't flip. It was in earnest. While I respect your chosen profession, and that you are open to changing your mind (really, kudos on that - it appears we must simply wait for you to process all the good information you are getting and apply it to your life). I am very sensitive to the cognitive skills and development of teenagers, and I believe the phrase "garbage in, garbage out" applies more to teenagers than even to computers. As to your reply to me, your critical thinking, in falsely equating WUWT to SkS fails at points 3 (you have failed to judge the credibility of WUWT), 4 (you have failed to identify the assumptions of WUWT) and 6 (you have failed to judge the quality of the argument of WUWT). Given that, how can you possibly site 1-6 of your list as support for WUWT? You are not being internally consistent here. Here is a critical thinking assignment for your students (that you would benefit from): Pick an article in WUWT on a subject that also has an article in SkS - have your students compare and contrast the articles through the lens of 1-6 above. I think you will be surprised by the outcome. Most of us have already gone through this (or else it was intuitively obvious). -
wingding at 03:04 AM on 14 August 2011Blaming nature for the CO2 rise doesn't add up
What if the delta C atm (15) is fixed by temperature, or goblins, whatever. Meaning that human emission (30) determines the natural contribution: 15 = 30 + N So currently N, nature, is a sink of 15. If we cut our emissions to 0: 15 = 0 + N Then nature switches to being a source of 15. This is at least plausible on the face of it if we are just talking numbers. -
muoncounter at 02:27 AM on 14 August 2011Climate Denial Video #3: Polluters Use Same Tactics As Tobacco Industry
DSL#20: "using the same methodology" According to these results, there is room for significant doubt of a number of theories: Only 53% of adults know how long it takes for the Earth to revolve around the Sun. Only 59% of adults know that the earliest humans and dinosaurs did not live at the same time. Only 47% of adults can roughly approximate the percent of the Earth's surface that is covered with water. Only 21% of adults answered all three questions correctly. On that basis: - Kepler's Laws (and Newton's for that matter) are subject to 'skepticism'; - evolution (and all the technology used for radiometric dating; indeed the fundamentals of radioactive decay itself!) are in doubt; - physical geography (and any form of satellite image analysis) are riddled with question marks. Is this how the science should be evaluated? By opinion polls? pirate, is that what you are teaching? -
Tom Curtis at 02:21 AM on 14 August 2011Climate Denial Video #3: Polluters Use Same Tactics As Tobacco Industry
Perhaps its time for a SkS Project Michael to match the NCSE's Project Steve? How long do you think it would take us to get 31,000 Michaels who accept AGW? -
Tom Curtis at 02:15 AM on 14 August 2011Climate Denial Video #3: Polluters Use Same Tactics As Tobacco Industry
apirate @17 & 18, the denominator is absolutely essential to critical thinking about poll results. Probability theory is just the science of ratios, and statistics is a special branch of probability theory that applies the theorems of probability to sampling. The upshot is, if you do not keep the denominator firmly in mind, your thinking about survey results will be simply nonsense. Now, if you want to break down the figures from Doran, you get the following figures: 10,257 research geo-scientists in the US; 3,146 respondents; approx 5% (155) climate scientists; 79 actively publishing climate scientists. From this you can determine that there are approx 500 research Climate Scientists in the US, or which 255/500 are actively publishing in climate science; of which 244/255 accept the consensus on global warming. That leave about 11/255 actively publishing climate scientists who do not accept that consensus, in the US. Approximately 88% of all research climate scientists accept the consensus, meaning there are about 60/500 research climate scientists in the US who do not (a number which inlcudes the active publishers). But what of your 39 climate scientists who do not accept the consensus? The simple fact is that most science graduates do not go on to research. They still get counted as scientists for the purposes of the petition, even if their day job is slinging burgers at MacDonalds. All you can deduce from that figure is that 0.12% of global warming skeptics with technical training of any sort actually have relevant qualifications to assess the climate science. Not a very reassuring statistic for those in denial about AGW. It's no wonder that you don't want to have anything to do with the denominator. -
DSL at 02:03 AM on 14 August 2011Climate Denial Video #3: Polluters Use Same Tactics As Tobacco Industry
I'm wondering what it would mean if, using the same methodology (well, a guess at the original methodology anyway), I managed to get 32,000 signers who accepted the theory of AGW. Exactly squat, I suspect. Yet I also suspect that the doubters and denialists would raise the same questions raised here about method and interpretation. -
muoncounter at 01:56 AM on 14 August 2011Climate Denial Video #3: Polluters Use Same Tactics As Tobacco Industry
pirate#18: "a silly attempt" Nope. This continued fascination with a meaningless petition is silly. It was silly two years ago: Robinson claims the Petition includes 31,000 scientists, 9,000 with PhDs (and the other 22,000 have what credential that makes them “scientists”?). Let’s pretend they’re all real scientists. So what? If the premise is that this is a HUGE number (as many in the Denialosphere have tried to claim, and still do), then what is our basis for comparison? In the US alone there are an estimated 2,685,000 scientists. The OISM sent out their call to a subset of the mailing list of American Men and Women of Science and it got broadly passed around the Denialosphere … and they managed to get a mere 1.2% of the American scientific community. So if you are bothered by the observation that not everyone who received the survey that resulted in '97% agree' actually responded, be very bothered by the appallingly low response rate of the petition -- a rate so low that it virtually invalidates the results. And in what way does the existence of this minority opinion alter the basic science? pirate, you're grasping at straws. Give this one up. -
apiratelooksat50 at 01:43 AM on 14 August 2011Climate Denial Video #3: Polluters Use Same Tactics As Tobacco Industry
TC at 16 and DB at 17 The Denominator is a silly attempt to trivialize the fact that "climate scientists" actually signed the petition. It in no way invalidates their position. It is an exercise in futility. By the way, what is the definition of a climate scientist? How many climate scientists are there in the US? -
Composer99 at 01:15 AM on 14 August 2011Murry Salby - Confused About The Carbon Cycle
I should also mention, with regards to Dale's comment, that there are at least two obvious (to this non-scientist) reasons to reject Salby's conclusions: (1) If CO2 in the atmosphere is controlled by natural factors and human emissions are not a factor, how does Salby account for the enormous amount of human-emitted fossil CO2 (30 Gt annually)? It has to go somewhere. If Salby cannot convincingly account for it (and show his working), there is no reason to accept his conclusions. Climatologists espousing the mainstream/consensus position can account for fossil fuel CO2 emissions as well as natural sources & sinks, and they can show their working. (2) It is my understanding that in the past, CO2 increases tracking temperatures were the result of oceanic CO2 outgassing following warming; it would follow in this case that the ocean pH would increase (alkalinization) as the oceans warmed. We find, however, that ocean pH is decreasing even as the oceans warm, which makes more sense in the context of warming following CO2 increase. -
dana1981 at 01:12 AM on 14 August 2011Murry Salby - Confused About The Carbon Cycle
Salby's arguments are akin to claiming that the Sun revolves around the Earth. We know it's wrong, we know why it's wrong, and we've known this for ages. There's nothing presumptious about pointing this out. -
Composer99 at 01:08 AM on 14 August 2011Murry Salby - Confused About The Carbon Cycle
Further to: It is he who is trumpeting his "results" far and wide whilst with holding the data he used so as to prevent direct refutation. He has even gone to the extent of refusing to supply copies of his charts to interested persons on the basis that there is an "embargo" on their publication, while showing them to uncritical audiences, thus breaching the "embargo" himself. Haven't contrarians made an enormous fuss about actual climate scientists "refusing" to release their data? And here we find them cheering on an actual, obstinate refusal to share data which is at the heart of open scientific inquiry. -
Albatross at 00:52 AM on 14 August 2011Lessons from Past Climate Predictions: Wallace Broecker
I agree Bart, Glad to see you noticed it. Posts like this need to be trumpeted far and wide. -
Robert Murphy at 00:10 AM on 14 August 2011Why Wasn't The Hottest Decade Hotter?
"People see what looks like half a 900 year cycle just because the climate was cold during the Maunder Minimum and then both increased till 2000" Sunspot cycles have been getting weaker for the last 40-50 years. At best there's been no trend in solar irradiance during that time; it's probably declined a very small amount. So no, "both" have not been increasing till 2000. And no, warming didn't end in 2000 either. We just had the warmest decade on record (and easily, too), according to all data sets. The oceans are still gaining heat. As for seeing a 900 year cycle in 400 years of data, I don't think there's much to say other than it's sheer folly. -
DougCotton at 23:56 PM on 13 August 2011Why Wasn't The Hottest Decade Hotter?
I do tend to agree. I was just interested to see what others thought about it. I guess the various institutes in 9 countries are wasting their time and money with the CLOUD experiment. People see what looks like half a 900 year cycle just because the climate was cold during the Maunder Minimum and then both increased till 2000.Moderator Response: [Dikran Marsupial] As I said, if you are interested to see what other people think about some subject, why not just read the relvant articles and responses first. The EU isn't wasting money on CLOUD; it is in the nature of research that some projects end up confirming an hypothesis and some end up rejecting them. If you know the outcome before performing the experiment it isn't research. Secondly seeing what looks like half a 900 year cycle is "climastrology". Human beings are excellent at spotting patterns in data where no pattern actually exists, especially when it fits their preconceived opinions. Next time if you want to talk about cycles, then at least present a statistically sound demonstration that such a cycle actually exists. -
bartverheggen at 23:09 PM on 13 August 2011Lessons from Past Climate Predictions: Wallace Broecker
Excellent and very important post! -
Robert Murphy at 23:02 PM on 13 August 2011Murry Salby - Confused About The Carbon Cycle
"I wonder what Salby's motivation is?" Ask yourself this; had you ever heard of him before this brouhaha? I know I hadn't. Now he's being mentioned in lots and lots of blogs. He's a celebrity among the ill-informed and ignorati. Judith Curry thinks he's the Bee's Knees, and he may just be the David she's been looking for to kill the AGW Goliath. Look at the efforts that are being expended to counter him; surely this means the Team is scared, right? They must silence him now, and when his claims get torn apart and attract no favorable attention among climate scientists, he'll know he's a new Galileo. They laughed at him, remember? When they laugh at Salby it will be the same thing! He just knows it! JMTCResponse:[DB] It would be best for everyone to refrain from such introspection into Salby's motivation.
-
John Brookes at 22:15 PM on 13 August 2011Murry Salby - Confused About The Carbon Cycle
I wonder what Salby's motivation is? Why are some scientists in the twilight of their careers given to this sort of behaviour? -
DougCotton at 22:05 PM on 13 August 2011Why Wasn't The Hottest Decade Hotter?
(continued) My feeling is that there may be something to be read into (a) the current longer cycle (max June 2013) and (b) an apparent underlying 900 to 1000 year cyclic trend in sunspot activity rising from the Maunder minimum in the Little Ice Age. The fact that the 2021 minimum is also predicted to be very low might indicate a long term downturn at least in solar activity.Moderator Response: [Dikran Marsupial] (a) the solar cycle length - climate relationship is debunked here. (b) reliable sunspot data doesn't go back far enough to reliably detect a 900-1000 year cycle. Also if you look at temperature data that has the effects of ENSO and volcanic activity taken out (see e.g. here) there is very little sign that the solar minimum has had much of an effect on temperatures. The 11-year solar cycle is barely detectable in temperature data, the change in solar forcing is really very small. Please do yourself a favour and go through the answers to common skeptic arguments listed to the left of the page. -
DougCotton at 21:40 PM on 13 August 2011Why Wasn't The Hottest Decade Hotter?
#50 and others re solar activity (related to 10.7cm solar radio flux): Would anyone care to comment on these NASA predictions? source Moderator Response: [Dikran Marsupial] Please limit the width of images to (say) 450 pixels (I have fixed this post already). Secondly, link only posts are discouraged; don't simply post an image an ask for comments, instead explain why you think the image is interesting and explain why comments would be informative.
 -
suibhne at 21:18 PM on 13 August 2011The Ridley Riddle Part Three: Like a Northern Rock
bibasir "Not true. When you are leveraged 30 to 1, a 4% decline in assets puts you in bankrupcy. What market doesn't decline from time to time?" The thing that doomed Northern Rock was to assume that the rest of the market was regulated properly. Their main assumptions were 1. Do not lend more than the house is worth or the borrower can pay. This policy has turned out to be vindicated by the Bad Bank continuing to make a profit. 2. If NR has a relatively clean mortgage book then pension funds and others who require a steady income will buy their scrutinised bonds. 3. That there will be a sufficiently liquid money market. It was point 3 that sunk the Rock. As explained above and subject to criminal investigations the hedge fund controlled by Goldman Sacks was given control over their mortgage arm. The hedge fund placed futures on a house market crash and went out of their way to make sure it happened. American AAA rated mortgage backed bonds were found to be worthless. Nobody was quite sure who held exposure to such junk the money market froze. HSBC refused overnight clearance of Barclay's credit(unprecedented) The rest is history. The problem that caused Nationalisation was that two other Hedge funds has virtual control over NR shares and would not sell to Virgin for a price rumoured to be 20p per share. As the chancellor Alistair Darling said on the say of Nationalisation. Northern Rocks assets were greater than its liabilities. Hence it was never in danger of being bankrupt. It had a major problem of liquidity due to market conditions -
Dikran Marsupial at 21:12 PM on 13 August 2011Murry Salby - Confused About The Carbon Cycle
Salby hasn't even named the journal to which his paper was submitted, which given it apparently has already been accepted seems a little odd. So it isn't even possible to verify that his work actually has been subjected to peer review. Personally I think the journal will either be E&E or some non-climate journal where peer review is unlikely to include reviewers with a sound grasp of the workings of the carbon cycle. -
Tom Curtis at 21:03 PM on 13 August 2011Murry Salby - Confused About The Carbon Cycle
Dale @4, to the extent that you find something presumptious in refuting an argument when we do not have access to the data, your chief concern should be with Salby. It is he who is trumpeting his "results" far and wide whilst with holding the data he used so as to prevent direct refutation. He has even gone to the extent of refusing to supply copies of his charts to interested persons on the basis that there is an "embargo" on their publication, while showing them to uncritical audiences, thus breaching the "embargo" himself. Frankly Salby's behaviour has been disgraceful. It's only merit has been showing, but the speed with which they have accepted his results as ground breaking and undoubtedly true without access to the supporting data, that the "skepticism" of many well known deniers is only a mask for refusing to deal with reality. -
Dikran Marsupial at 20:32 PM on 13 August 2011Murry Salby - Confused About The Carbon Cycle
Dale No, it isn't at all presumptious. The fact that the rise in atmospheric CO2 is essentially anthropogenic is readily established by existing observations. I listened to Salby's podcast and he made no attempt to refute any of the existing lines of evidence and the mistake he makes (temperature changes modulate the growth rate) has been made by others before him (e.g. by Roy Spencer) and have already been refuted. It will be insteresting to see what is in the paper, it is not unheard of for scientists to make a press release that draws conclusions not mentioned in (or strongly supported by) the paper. -
Dale at 20:15 PM on 13 August 2011Murry Salby - Confused About The Carbon Cycle
Bit presumptuous to try and refute an argument without seeing any of the data, working out or graphs. -
DougCotton at 18:55 PM on 13 August 2011Trenberth on Tracking Earth’s energy: A key to climate variability and change
#152 Tom: Three genuine questions this time:- (1) I have read several papers along the lines of your post (and do understand the reasoning) but I note references to temperatures around 275 deg.K, whereas NASA sea surface means are usually a little over 294 deg.K. Could you clarify the reason for the difference? (2) I would like from you a little more explanation of the conclusiom "the source of the rest of the radiation, warming." To explain why I am asking, suppose we note the temperature of, say, the top of the ocean in some location at 4am one day and then, after all the various iterations of the feedback cycle the next day, the surface of the water is warmed during the day and starts to radiate extra and, as it cools, "pushes up" the whole plot, still with its notches. What evidence do we then have from the plot that the ocean has not returned to the same initial temperature by 4am the next day? (3) What happened to the evaporation component, assuming the latent heat was released in the troposphere quickly that day? -
MA Rodger at 18:09 PM on 13 August 2011Murry Salby - Confused About The Carbon Cycle
I do like these folk who spot the wobbles which ENSO puts onto both the temperature & CO2 records, then conclude that CO2 wobbles are driven by temperature change. Such nonsense has wonderful implications - no global Mediaeval warm period for instance, or any other warm period for the last few million years! -
DougCotton at 15:49 PM on 13 August 2011Trenberth on Tracking Earth’s energy: A key to climate variability and change
#155 Tom: You stated: "the UV energy absorbed by O2 and O3 in the stratosphere is dissipated as IR radiation by CO2 and O3 (ozone). Thus, in the stratosphere increased CO2 does have a cooling effect." Is there any reason why could not also state "the UV energy absorbed by O2 in the troposphere is dissipated as IR radiation by CO2. Thus, in the troposphere increased CO2 does have a cooling effect." ? -
Kooiti Masuda at 15:45 PM on 13 August 2011Murry Salby - Confused About The Carbon Cycle
Relationship between variation in the inter-annual time scale of atmospheric CO2 concentration and temperature was discussed by C.D. Keeling and co-authors in 1989. They suspected that the correlation is related to ENSO cycles. They did not consider that multi-decadal trends of CO2 concentration is determined by the same logic. C.D. Keeling, R.B. Bacastow, A.F. Carter, S.C. Piper, T.P. . Whorf, and co-authors, 1989: A three-dimensional model of atmospheric CO2 transport based on observed winds: 1. Analysis of observational data. In: "Aspects of Climate Variability in the Pacific and the Western Americas" (Peterson D.H., ed., Geophysical Monograph, 55, American Geophysical Union), 165 - 236. In Japan, Junkichi Nemoto, a former long-range weather forecaster and a writer of popular essays about weather and climate, included the story of Keeling et al. (1989) in his book in 1994. He quoted a figure which shows that temperature leads CO2 concentration by about one year, or a 1/4 cycle period, of the ENSO cycles. Long-term trends have been removed before making the plot. Then, Atsushi Tsuchida, a staunch AGW denier, a former physicist, an anti-nuclear-power activist and a thinker who promoted the view of the environment in terms of concepts of non-equilibrium steady-state thermodynamics (I think that he should be praised for this achievement in the 1970s-80s) picked up the relationship and claimed that the growth of atmospheric CO2 content (since 1960s-70s till present) is a result and not a cause of global warming. Around 2006, he and Kuniaki Kondo, an engineer (by the way, there are many Kondos including able climate scientists), made some analysis. They found good simultaneous correlation between the annual increase of the atmospheric CO2 concentration (compilation by Scripps Institution of Oceanography via CDIAC, USA [link]) and the anomaly of global mean surface air temperature (compilation by Japan Meteorological Agency (JMA), a previous version of what is available [here], where the base period was 1971-2000). They extrapolate the linear relationship and claimed that the change of CO2 concentration would be zero if the global mean temperature anomaly were -0.6 deg. C (base 1971-2000). Kondo and Tsuchida wrote a paper (in Japanese) and submitted to "Tenki", the bulletin of the Meteorological Society of Japan (MSJ). After peer reviews, the editorial board of Tenki rejected the manuscript. Their rejected paper and related materials can be found somewhere in a web site maintained by Kondo (Japanese only). Tsuchida sued MSJ claiming that rejection was politically motivated. The courts ruled against Tsuchida, but he tries again with modified claims. I think that MSJ would have passed their paper if they just mention interesting relationship between changes of CO2 concentration and temperature without making an egregious claim that the global warming is not anthropogenic. By the way, JMA has made more careful analysis. On one of their web pages, though the main text is Japanese only, there are figures with English captions. See "Fig. 2.1.2.3". The upper two panels are now well-known relationship between the CO2 increase and ENSO. The bottom panel shows simultaneous correlation between the CO2 increase and the mean surface air temperature over the tropical (30 S - 30 N) land area. The correlation broke down for a while after the volcanic eruption of Pinatubo in 1991. -
DougCotton at 15:15 PM on 13 August 2011Trenberth on Tracking Earth’s energy: A key to climate variability and change
#152 Tom: I would have considered ozone a GH gas as at least some others do. I was painting a hypothetical scenario in which all gases that acted like GH gases (able to emit in the IR range) were absent. But even if you leave ozone up there, and just had O2 and N2 where we live, they would absorb incident UV at all altitudes and we would frizzle in the absence of GH gases here in the lower troposhpere. ( -Moderation Complaints Snipped- )Response:[DB] If you wish to directly interact with Tom and the others by having actual dialogue (which involves asking questions, getting answers, pondering answers & asking more questions [which goes for either side]), then interact away.
If you are going to ignore the feedback and correction of others & Gish Gallop away, then accept that moderation of comments is an accepted condition of participating in this Forum. And moderation affects all, equally. Defamation is not allowed (however, implying legal action such as you just did tells volumes about character).
If you want to talk climate science, partake in the discussion and be welcome.
If you want a podium and a microphone, go away.
-
DSL at 13:42 PM on 13 August 2011Trenberth on Tracking Earth’s energy: A key to climate variability and change
If that has been your motive, Doug, you've gone about it in a very odd way. You're not taking into account basic science that engineering of every kind depends on. I understand you've spent a lot of time writing your site, and you've invested yourself in your ideas. I'm reminded of one of my students who spent weeks of skull sweat hashing out an argument only to find out that he had failed to consider the strongest counterargument. He spent three or four days trying to wriggle out of addressing the problem (which clearly required a re-write of the ten-page paper). He tried bargaining with me ("what if I just tack on a paragraph at the end -- what grade will that get me?"). He tried to buy a balance through extra credit (Umm . . . No). I did end up allowing him all of finals week to do the re-write, and to his credit he did a fair job of re-thinking his argument. Of course, you seem to have more at stake than my student. Your errors--the fundamentals upon which the currently crooked house is built--are public. Swallowing one's pride is difficult in some circumstances, but it should never be difficult when it results in a greater level of integrity. One thing I am certain of: if you ask questions and discuss responses without the subtext that the other participants are frauds, hoaxers, or idiots, no one here will bring forth a quantum of ridicule. For example, you finally arrive at a motivation in your most recent comment: a decrease in the rate of warming since 2003. Unfortunately, you buried that chocolate chip in a hard dough moistened by piss and vinegar. Perhaps it's understandable given the rhetoric that's been thrown at you. Perhaps. If you're still interested in discussing the science, start on a new tack. Rather than presenting your physical model as absolute and unquestionable truth, ask questions and discuss responses. Assume nothing. Ask for evidence. Don't decrease the probability of anything without clear reason. Keep an open mind. Work on one thing at a time. If this all seems condescending, take a good long look at your posts, both here and elsewhere. And keep in mind the patience Tom and others (not all others) have shown you. Finally, keep in mind that the regulars here routinely have to deal with some truly nutty crap, and so patience can be in short supply when someone refuses to engage and tinges everything with a knowing smirk and the suggestion of fraud. -
bibasir at 13:39 PM on 13 August 2011The Ridley Riddle Part Three: Like a Northern Rock
suibhne at 02:02 AM on 13 August, 2011 "Northern Rock was a relatively innocent victim of the general banking crisis." Not true. When you are leveraged 30 to 1, a 4% decline in assets puts you in bankrupcy. What market doesn't decline from time to time? Excessive leverage is what got the U.S. banks and brokers too. -
muoncounter at 12:34 PM on 13 August 2011Trenberth on Tracking Earth’s energy: A key to climate variability and change
DougC#156: "My motives have never been other than to try to find reasons... " Thanks, you've confessed at last. Your 'motives' should have been first to understand the science and only then formulate your conclusions. Given this admission, any 'true skeptics' here should be speaking up about now. ... anyone? Buehler? -
DougCotton at 12:26 PM on 13 August 2011Trenberth on Tracking Earth’s energy: A key to climate variability and change
All right - one more reply ... ( -Snip -) But this is not about personalities. My motives have never been other than to try to find reasons for the clear-cut reduction in warming that has been observed since 2003 - and to play whatever part I can in helping to calm the unnecessary turmoil that global warming predictions have engendered.Response:[DB] Alright, now that you've had your say Mr. Cotton, you have no purpose here. You are not here to learn: others have already pointed out the numerous fallacies and errors you have made thus far. Indeed, the mistakes and gaffes you commit are legion in this comment alone. So learning on your part is not your goal here. Please take your litanyous Gish Gallop elsewhere.
If you wish to have a rational dialogue and actually begin to learn a bit about climate science, this is the place. Thousands of posts exists with attendant comment threads, all with links to the primary literature. You would do well to read at least some of it before you attempt to teach those who already have.
-
apiratelooksat50 at 12:23 PM on 13 August 2011Skeptical Science Helps Students Debunk Climate Myths
DB at 7 Earlier I had a much longer reply to you, but lightning struck and knocked it out even with an APU> My Biology class (which I have been teaching longer) website was archived because I am not teaching it this year. It had links to pro and anti AGW sites. I am building my Env. Sci. site. Tell you what I will do - you (and any other active participants of this site) compile a list of website links that you would like to be added to my "teacher page". I will add them comment free. You can even come up with the heading (if I can add that). Just make sure your suggestions are balanced! -
apiratelooksat50 at 11:57 AM on 13 August 2011Climate Denial Video #3: Polluters Use Same Tactics As Tobacco Industry
flan at 15 and TC at 16 I am not sure where the confusion is. The oft quoted 97% of climate scientists... represents 75 of 77 scientists who answered the poll. That was winnowed down from the total number of scientists who answered the poll to only include climate scientists to achieve that 77 number. According to the article we are commenting on, 99.9% of the signatories are not climate scientists. The opposite of that statement means 0.1% are. I've already done the math so no need to do again. They actually identify 39 as climate scientists compared to my 32 derived by mathematic calculations. Comparing 32, or 37, to the constantly championed 75/77, the gap is closer than most are led to believe.Response:[DB] Perhaps you have forgotten the Denominator: It is indeed what is best in life...
-
Steve Case at 11:45 AM on 13 August 2011Ocean Cooling Corrected, Again
What do I think it will say? The same thing that the IPCC thinks it will say. and the same thing that you think it will say. ( -Snip- ) John Cook may now delete this post. Right John?Response:[DB] If you have nothing constructive to add to this discussion, why bother. Right?
Note: John seldom moderates these days. Those comments you have forced the moderators to intervene on and/or delete have been acted upon by others.
-
Tom Curtis at 11:41 AM on 13 August 2011Trenberth on Tracking Earth’s energy: A key to climate variability and change
saddenp @153, a very good point. For anyone visiting this site who want's to learn, the UV energy absorbed by O2 and O3 in the stratosphere is dissipated as IR radiation by CO2 and O3 (ozone). Thus, in the stratosphere increased CO2 does have a cooling effect. This shows up in the graphs in 152 as the central spike in both the CO2 and O3 troughs, produced by the radiation in the stratosphere. -
muoncounter at 11:24 AM on 13 August 2011Trenberth on Tracking Earth’s energy: A key to climate variability and change
Tom#152: "But DougCotton thinks his 200 word verbal argument is more likely to be true than the years of detailed analysis by climate scientists of the facts Doug has just learnt." I doubt that Mr. Cotton actually learned anything from this encounter. What we witnessed was a very revealing look into the denier's mindset. He has a preconceived notion; neither fact nor theory will sway him. When shown that he self-contradicts, he ignores the error -- and then boasts of his logic. When challenged to produce data, he cannot -- and it does not bother him. When shown that his model is nonsense that violates all accepted theory, he makes up even more nonsense -- and congratulations himself for his cleverness. Very telling is the fact that not one of the regular skeptics here chimed in to support his position. Also telling is that not one of the skeptics here voluntarily said something to the effect of 'I have objections to the greenhouse effect, but I can recognize that you're way off base.' I think, however, that this encounter validates the strategy of powerful refutation of one specific point at a time. If nothing else, it produced some very clear explanation of what the actual science says. But there is a clear difference between working with those college physics students and someone like Cotton: the students actually want to learn. John Wooden, a legendary US college basketball coach put it this way: It's what you learn after you know it all that counts. -
scaddenp at 11:13 AM on 13 August 2011Trenberth on Tracking Earth’s energy: A key to climate variability and change
One thing about DC's "insight" - he is almost onto the reason why increasing CO2 causes cooling of the upper stratosphere - the smoking gun of GHG warming. -
LazyTeenager at 11:10 AM on 13 August 2011Murry Salby - Confused About The Carbon Cycle
Love the paper showing the trend in ocean CO2 absorption. The article needs a graph though. -
Tom Curtis at 10:15 AM on 13 August 2011Trenberth on Tracking Earth’s energy: A key to climate variability and change
While Doug Cotton @150 clearly shows his colours as a man for whom is conclusion that the greenhouse effect does not exist is far more important than any scientific evidence or reasoning, it is important to understand what is wrong with his claims. Above is a IR spectrum from Earth at the top of the atmosphere. You can clearly see that the spectrum follows the curve for a black body radiation of about 270 degrees, but with some notches taken out. The most important notches are the large one at about a wave number of 700 due to CO2, a shallow but extensive notch at lower wave numbers due to H2O, another moderately deed notch at a wave number of about 1000 due to ozone, and another shallow extensive notch above wavenumbers of 1300 due to methane and H2O.
The actual value of the curve depends on the surface temperature of the region of the Earth over which the observation was made, as is illustrated by this NASA graphic:
Above is a IR spectrum from Earth at the top of the atmosphere. You can clearly see that the spectrum follows the curve for a black body radiation of about 270 degrees, but with some notches taken out. The most important notches are the large one at about a wave number of 700 due to CO2, a shallow but extensive notch at lower wave numbers due to H2O, another moderately deed notch at a wave number of about 1000 due to ozone, and another shallow extensive notch above wavenumbers of 1300 due to methane and H2O.
The actual value of the curve depends on the surface temperature of the region of the Earth over which the observation was made, as is illustrated by this NASA graphic:
 It is not often appreciated by deniers and "skeptics", but these observations are absolute proof that green house gases warm the Earth.
The reason for that is simple. In each of these observations, the total energy radiated from the Earth at the top of the atmosphere is equal to the area under the curve. It is obvious that the notches introduced to the curve by the absorption of IR radiation reduce the area under the curve. But if they reduce the area under the curve, ipso facto, they reduce the total energy radiated to space. As, on average the energy radiated to space must equal the energy received from the sun, if the area under the curve is reduced by the absorption of IR radiation by green house gases, then the area under those parts of the curve in which IR radiation is not absorbed must increase in order that the same overall energy output is obtained. And that can only be achieved by the surface of the planet, the source of the rest of the radiation, warming.
What ever your thoughts on the green house effect may be, once these observations were made the only way to deny its existence was to deny the truth of the three governing laws of black body radiation that relate radiation to temperature - laws as well confirmed as anything in science.
But what of DougCotton's scenario?
If all the Sun's radiation intercepted by the Earth was absorbed by the surface, and there were no greenhouse gases, then the average observed IR spectrum from the Earth would be a smooth black body curve with no notches from IR absorption, and it would show a surface temperature of 255 degrees K, the temperature required for a black body curve to radiate the 240 W/m^2 average energy received from the Sun after albedo effects. (Actually it would show different values at different latitudes, but the values would average out at 240 W/m^2.)
If there was not CO2 or water vapour in the atmosphere, but the atmosphere still absorbed 78 W/m^2 as shown in the diagram in the main article, what would happen? Well there would still be one molecule capable of radiating IR radiation, ozone. And ozone would need to radiate most of that 78 W/m^2. Somebody observing from space would then see something very interesting. They would see a standard black body curve from the surface showing a surface temperature of around 230 degrees K, with a massive spike of radiation from the ozone.
This situation, in which the green house gas is cooling the atmosphere is well known to atmospheric physics, and sometime occurs on Earth over Antarctica, as in the following spectrum (see spectrum b):
It is not often appreciated by deniers and "skeptics", but these observations are absolute proof that green house gases warm the Earth.
The reason for that is simple. In each of these observations, the total energy radiated from the Earth at the top of the atmosphere is equal to the area under the curve. It is obvious that the notches introduced to the curve by the absorption of IR radiation reduce the area under the curve. But if they reduce the area under the curve, ipso facto, they reduce the total energy radiated to space. As, on average the energy radiated to space must equal the energy received from the sun, if the area under the curve is reduced by the absorption of IR radiation by green house gases, then the area under those parts of the curve in which IR radiation is not absorbed must increase in order that the same overall energy output is obtained. And that can only be achieved by the surface of the planet, the source of the rest of the radiation, warming.
What ever your thoughts on the green house effect may be, once these observations were made the only way to deny its existence was to deny the truth of the three governing laws of black body radiation that relate radiation to temperature - laws as well confirmed as anything in science.
But what of DougCotton's scenario?
If all the Sun's radiation intercepted by the Earth was absorbed by the surface, and there were no greenhouse gases, then the average observed IR spectrum from the Earth would be a smooth black body curve with no notches from IR absorption, and it would show a surface temperature of 255 degrees K, the temperature required for a black body curve to radiate the 240 W/m^2 average energy received from the Sun after albedo effects. (Actually it would show different values at different latitudes, but the values would average out at 240 W/m^2.)
If there was not CO2 or water vapour in the atmosphere, but the atmosphere still absorbed 78 W/m^2 as shown in the diagram in the main article, what would happen? Well there would still be one molecule capable of radiating IR radiation, ozone. And ozone would need to radiate most of that 78 W/m^2. Somebody observing from space would then see something very interesting. They would see a standard black body curve from the surface showing a surface temperature of around 230 degrees K, with a massive spike of radiation from the ozone.
This situation, in which the green house gas is cooling the atmosphere is well known to atmospheric physics, and sometime occurs on Earth over Antarctica, as in the following spectrum (see spectrum b):
 (Also see the second spectrum in (c) (Tropical Western Pacific) where the thunderstorm anvil shows a massive warming effect, reducing the effective radiation to space from a black body curve of around 290 K to that for 210 K, which is slightly compensated for by CO2. That is, in the absence of CO2 the thunderhead anvil would have an even stronger warming effect.)
It is now clear what we should look for if CO2 had a typically cooling effect as claimed by DougCotton and Jonicol - the spectrums should consistently show a spike from CO2 instead of (as they typically show) the deep trough we have come to expect.
Finally, let me point out the massive hubris of DougCotton. Atmospheric physicists know all of the facts I have pointed out and on which he bases his theory. After all, it is from them that I learnt those facts. They not only know those fact, but they have explored their consequences in the very detailed calculations and extensive sets of calculations that are called climate models, which have been tested against observation and shown a good fit between observation and predicted result (see 103 above). But DougCotton thinks his 200 word verbal argument is more likely to be true than the years of detailed analysis by climate scientists of the facts Doug has just learnt.
Not even an Einstein would be likely to get correct on so little thought what the physicists have purportedly been getting wrong from so massive and careful an analysis. Of course, a true Einstein would not (an Einstein was not) be so prideful in their own reasoning.
(Also see the second spectrum in (c) (Tropical Western Pacific) where the thunderstorm anvil shows a massive warming effect, reducing the effective radiation to space from a black body curve of around 290 K to that for 210 K, which is slightly compensated for by CO2. That is, in the absence of CO2 the thunderhead anvil would have an even stronger warming effect.)
It is now clear what we should look for if CO2 had a typically cooling effect as claimed by DougCotton and Jonicol - the spectrums should consistently show a spike from CO2 instead of (as they typically show) the deep trough we have come to expect.
Finally, let me point out the massive hubris of DougCotton. Atmospheric physicists know all of the facts I have pointed out and on which he bases his theory. After all, it is from them that I learnt those facts. They not only know those fact, but they have explored their consequences in the very detailed calculations and extensive sets of calculations that are called climate models, which have been tested against observation and shown a good fit between observation and predicted result (see 103 above). But DougCotton thinks his 200 word verbal argument is more likely to be true than the years of detailed analysis by climate scientists of the facts Doug has just learnt.
Not even an Einstein would be likely to get correct on so little thought what the physicists have purportedly been getting wrong from so massive and careful an analysis. Of course, a true Einstein would not (an Einstein was not) be so prideful in their own reasoning.
-
DSL at 10:13 AM on 13 August 2011Trenberth on Tracking Earth’s energy: A key to climate variability and change
Muon, I think you're being generous. What I see instead of a race car is a pile of car parts, washing machine parts, legos, a picture of a race car, a few bananas, and a yo-yo--all of which has the label "it's a race car, you idiots" attached to it. "The 'system' is working one way or another." Oh my. -
DougCotton at 07:22 AM on 13 August 2011Trenberth on Tracking Earth’s energy: A key to climate variability and change
It is very important that you all understand the implications of what Tom has explained in #134 point (2). Put aside all your arguments about past comments and focus on this one point. As Tom explains, nitrogen and oxygen do not emit photons at atmospheric temperatures because the photons they have to emit (refer Quantum theory) are in the high frequency (thus high energy) UV spectrum - well over 100 times the IR values that green house gases both absorb and emit. You are aware of course that O2 and N2 absorb some incoming UV photons from incident insolation. So they are going to get warmed, both that way and by conduction/diffusion (ie contact with surface molecules) leading to the 5% convection that the 2008 NASA diagram shows - thank Tom for that too. So O2 and N2 work in the UV range and GH gases in the IR range. But GH also emit in the IR range - much more easily than O2 and N2 can ever do in the UV range, because it is nowhere near hot enough up there. So, in a nutshell, GH gases are the scavengers that collide with other air molecules (that can't emit radiation themselves) and collect energy from them (little bits at a time) and emit IR photons to get rid of the heat. In the absence of all GH gas, O2 and N2 could potentially reach extremely high temperatures as they keep absorbing some of the incoming insolation. They have no way of getting rid of it by radiation until they get very hot as Tom explained - and you should all be grateful to him. Yes, this is ground-breaking. But it is undeniable. See the big picture. We know the photons are getting to space and you must agree nothing of any concern has happened since we got past the big El Nino. The "system" is working one way or another and the "problems" that were unstandably perceived late last century were primarily due to the fact that the normal 60-year cycle was on an upswing (1970-1999) crossing over and going above the long-term cycle (itself rising from the Little Ice Age) which also peaked in 1999 and will just a little more in 2058-2059 before it starts a 450 year decline. Folks, I really have no more to say - take it or leave it. You cannot deny that GH gases can emit photons quite easily and O2 and N2 cannot. Surely logic says we need GHG to rid the atmosphere of heat. This really must be good-bye from me.Response:[DB] You are aware of course that most of the regular participants in this forum have either cracked textbooks in atmospheric physics and statistical analysis, gotten degrees in climate-science related fields, worked in those fields in a non-scientist capacity and/or are actually real, living & breathing climate scientists? Condescension by you in this matter is thus the living embodiment of the Dunning-Kruger Effect.
So while you play the metaphorical version of alchemy, wielding 21st Century versions of eye of newt and wing of bat, mumbling incantations to conjure the skeptic's dragon's breath, real scientists in the real world have been studying, researching and quantifying the field of climate science for nearly 200 years.
In the absence of actual research you offer sophistry and mumbo-jumbo. Good luck convincing the cognoscenti with that. In this Forum you have presented nothing to be worth discussing further. And logic says until you do that actual research & publish it in a peer-reviewed journal, you should be ignored.
So, as a man of your word, let this be good-bye from you. Really.
To our regular readership: apologies for the abruptness. Time for a beer.
-
muoncounter at 07:15 AM on 13 August 2011Trenberth on Tracking Earth’s energy: A key to climate variability and change
DougCotton#136: "I have a bit more to add to my site this weekend" That's unfortunate, as you've been shown many areas where your base premises are completely unfounded. And now that you know that you are incorrect, adding even more based on those errors would be ... Well, the Comments Policy prevents me from saying what that would be. Any standard of scientific integrity demands that you produce some data and actual research that supports your positions; otherwise they are just your opinions. Consider this bit of wisdom: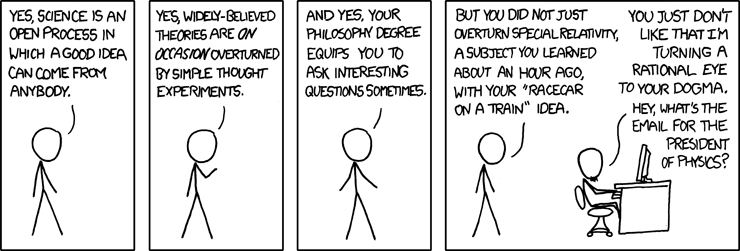 It's ironic that this comes up just as school is about to start in my part of the world. As a physics teacher, the grade that the totally undocumented, unsupportable 'racecar on a train' idea would get is an F.
-
DSL at 07:09 AM on 13 August 2011It's too hard
We should probably wave goodbye to Ray Anderson of Interface, who passed away recently. I'm not exactly pro-capitalist, but Ray's story is uplifting anyway. His death is rather the opposite. -
scaddenp at 06:29 AM on 13 August 2011Trenberth on Tracking Earth’s energy: A key to climate variability and change
"That's the problem; you never started from a position of skepticism." That and as far as I can see, never bothered to open textbook on atmospheric physics before leaping onto the web with an irresponsible website and laughable claims about climate science. -
Rob Honeycutt at 06:16 AM on 13 August 2011Earth hasn't warmed as much as expected
Steve Case... Denier is an appropriate and descriptive word. When people are presented with overwhelming evidence and still reject the accepted conclusions of the experts... what are we to call them? They are clearly in denial of the problem. They clearly deny the evidence. They are not the least bit skeptical. They aggressively pounce on every tiny bit of information that might seem to contradict the consensus without applying even minimal research. Regardless of how they might dislike it, I honestly can't think of a more apt term.Response:[DB] Please do continue to engage Steve as long as he stays on-topic, but please do so on one of the more appropriate threads dealing with denial (you know the drill).
Thanks!
Prev 1565 1566 1567 1568 1569 1570 1571 1572 1573 1574 1575 1576 1577 1578 1579 1580 Next


