


 Arguments


Recent Comments
Prev 1568 1569 1570 1571 1572 1573 1574 1575 1576 1577 1578 1579 1580 1581 1582 1583 Next
Comments 78751 to 78800:
-
barry1487 at 20:15 PM on 11 August 2011Climate Denial Video #4: The favourite weapon of deniers, cherry picking
Barry #1 - don't you think two percent is pretty good?
rpauli, I was responding to the last question in the article.And lastly, they also used our scientific consensus infographic - but can the sharp eyed reader notice the difference between the infographic used in the video and this newly updated version? (bonus marks if you can explain the difference)
Two of the last three figures are a different colour from the third. My guess was that they represented undecideds. What's the answer, J C?Moderator Response: [RH] Repaired first blockquote. -
DougCotton at 18:05 PM on 11 August 2011Trenberth on Tracking Earth’s energy: A key to climate variability and change
Bern: #107 That is not correct. I have calculated feedback in great detail. See the links in #108. -
DougCotton at 18:03 PM on 11 August 2011Trenberth on Tracking Earth’s energy: A key to climate variability and change
Re my #101 & #106 the links you need are ... http://en.wikipedia.org/wiki/File:Breakdown_of_the_incoming_solar_energy.svg http://www.climate-change-theory.com/calculations.jpg -
Donald Lewis at 17:33 PM on 11 August 2011Warming causes CO2 rise
I couldn't bring myself to read the comments. If one wants to argue that recent CO2 levels depend on temperature, one would first attempt to regress CO2 against temperature, rather than temperature against difference in CO2. However ill-conceived, the formula "Temperature Anomaly = (CO2[n+6] – CO2[n-6])/(12*0.22) – 0.58" asserts that temp is determined by CO2, together with some 12 initial conditions. In this formula, CO2 is the independent variable while temp is the dependent variable. How can this model possibly provide evidence that CO2 depends upon temp? Equally as bizarre, the model asserts the temp depends on the CO2 6 months in the future! This model violates causality. The given model also assets that when CO2 levels are constant the temp anomaly decreases by .58 every month. Is that reasonable? In any 15 year period of constant CO2, the anomaly would would decrease by over 100. In this model, the CO2 is obliged to increase, each month, just to maintain a constant temp. -
Bern at 17:32 PM on 11 August 2011Trenberth on Tracking Earth’s energy: A key to climate variability and change
DougCotton: you missed the bit on the right-hand side of the IPCC figure you referenced, labelled "back radiation". The lower figure doesn't show that greenhouse effect, and only shows nett energy transfer. If you only consider the nett energy, you then have the problem of trying to explain why the Earth's surface is 33ºC warmer than predicted for black body radiation, i.e. it only looks at the energy that goes up from the top-of-atmosphere to space, and ignores the energy that flows down, particularly from the warmer lower layers of the atmosphere. If you don't understand how heat can flow from the lower atmosphere to the (slightly) warmer ground surface, then can I suggest this post by Dr Roy Spencer? -
DougCotton at 16:37 PM on 11 August 2011Trenberth on Tracking Earth’s energy: A key to climate variability and change
Re my #101 and replies #102 #103: No one has as yet shown any proof that I am wrong in calculating that the ipcc estimates of infra-red radiation from the surface are incorrect by a factor of nearly 4 times. The detailed argument and the reference to the source of the information being nasa is at the foot of the linked diagram at http://earth-climate.com The application of Steffan-Boltzmann Law applies to the earth when viewed (as a true blackbody) from space, including its atmosphere. At the internal surface/atmosphere interface heat energy can be diffused by conduction (molecular collisions) directly to nitrogen and oxygen molecules. Quantum theory explains the processes involved and the priority of conduction over radiation in such equilibrium situations. In fact, as nasa indicates, about two thirds of such heat (previously absorbed in the crust and oceans from direct insolation) is transferred this way (and probably 100% in calm conditions) and so, the energy is reduced in the surface and it cannot emit as much radiation as a result. (The radiation to space subsequently comes from the air molecules.) If this were not so, there would never be (close) equilibrium causing very similar temperatures just above and below ground especially on a calm night. Radiation cannot bring about such equilibrium - only conduction and convection can. -
adelady at 13:39 PM on 11 August 2011Where have all the people gone?
Tom, Rob, Agnostic, who was it said "If you want to know where the science is, read the IPCC. If you want to know where the science is going, read Hansen."? (Obviously whoever it was said it a bit differently, otherwise I'd have picked it up on a search.) I'm quite happy with Tom's summary of various projections, but, I spend most of my 'climate-time' looking at the Arctic. Satellite images, graphs, blogs, papers - all of which tell me that the very best science of a mere 5 years ago was way off the mark about the rate of loss of sea ice. Even if SLR projections are only half as far off the reality as the Arctic sea ice calculations were, we're in for a good bit more than 1 or 2 metres SLR by 2100. As always, if we'd just get our act together and reduce GHG concentrations we could avoid some of the worst of it. And by that I mean not just reducing emissions. We have to get serious about sequestration - not of emissions alone, but of actual atmospheric/ocean concentrations already there from current and previous emissions. -
Stephen Baines at 13:27 PM on 11 August 2011Climate Denial Video #4: The favourite weapon of deniers, cherry picking
OK, you lost me EtR. Why is the 97% cherry-picking? Because it refers to that segment of the scientific community likely to know most about the topic? Ya know 82% ain't so bad either. I remember a certain toothpaste company in the states claiming 4 out of 5 dentists recommending it to patients. That was a selling point! But in this case that 82% is bound to be biased toward the negative side of the ledger. I know if someone asks me as a "scientist" about my opinion on a scientific subject I know nothing about, I'm going to err on the side of caution and say "Well...." I'm paid to be an ornery skeptic afterall! Of course, if the interviewer asked me to rate the weight of that opinion though, the skeptic in me would have to admit my opinion wouldn't mean much. Now compare what happened in the Dolan paper with the OISM petition. People in my department actually received it in the mail, so I speak with some knowledge (I had to look up the OISM to figure out what the heck it was!). It came with a letter from an former president of the national academy of science (since repudiated for this action) and a paper formatted to look like it was published in a prestigious peer-reviewed journal (even though it wasn't) that used clearly bogus arguments to attack the idea of a human impact on climate change. The OISM survey was deliberately misleading. John Cook is right, IMO, with his graphic. When a trap like that has been laid, the expertise of the people answering (or in this case signing) matters. -
Chris G at 13:00 PM on 11 August 2011The Last Interglacial Part Three - Melting Ice and Rising Seas
Barry #6, IDK, just because man has flourished does not mean that biodiversity has increased at the same time. From a certain distance, humans look like the most successful invasive species that has ever been. We are also a generalist species, and my impression is that generalists tend to do better than specialists during times of change. -
muoncounter at 12:49 PM on 11 August 2011Climate Denial Video #4: The favourite weapon of deniers, cherry picking
EtR#16: "Cherry picking 97%" A cherry-pick is basically the expression of a double standard: the explicit judgement that some data points are 'better' than others. We all agree that's not right; nor is 'changing the verbage'. But deniers cry foul over this nonsense without making a peep about '31000 scientists sign petition' (they are not all scientists) or '800 peer reviewed papers' (they are not all papers and certainly not all peer reviewed) or 'no warming since 1998' (that's just silly). Talk about a double standard! -
Tom Curtis at 12:49 PM on 11 August 2011Climate Denial Video #4: The favourite weapon of deniers, cherry picking
Eric the Red @16, anybody who "moves away from believing in global warming" on that basis was not a fence sitter to begin with. I can state that categorically because if the minor inaccuracy (at worst) of changing the wording from "significant contributing factor" to "causes" swayed their opinion, and the purported cherry picking of paying attention to the most qualified scientists swayed their opinion, then the egregious misrepresentation, lies, and blatant cherry picking by the deniers (not to mention the frequent promotion of flat out unphysical theories) would have them firmly wedded to the AGW camp. Anyone influenced by these considerations would accept AGW on the basis of the failure of the denier movement to repudiate Monckton alone. Alternatively, if they are influenced away from belief in AGW by these supposed inaccuracies and cherry picking, but give the Deniers a free pass (as they must do to not be firmly in the AGW camp) then they were not fence sitter to begin with. They may not have firmly committed to accepting denier beliefs, but they have never been open to accepting the theory of AGW. But having said that, I repudiate utterly your claim of misrepresentation and of cherry picking. If something is a significant factor and sufficient to cause warming, then it is a cause of warming. And there is no question that increased CO2 is sufficient given normal conditions (ie, the sun still shines) to increase temperatures. If would be a misrepresentation if the infographic claimed that 97% of climate experts think that humans are the only cause of global warming - but it does not. Further, if you are sounding out expert opinion on climate change, what does it matter what petrologists or geologist in general think? What about their training and publication history makes them any more expert on climate science than, for example zoologists, or vetinary surgeons? If the question is, what do the experts think, then only the survey results pertaining to the genuine experts are relevant. If we where to accept your claim of cherry picking here, then there is no logical basis of restricting the survey results to scientists, so that even the 82% would be cherry picking. Now you may be set against recognizing genuine expertise. You may think a theory heard by a random bloke in a pub is as good a priori as that expounded by people who have spent their lives gaining the intellectual tools, and rigourously applying them to the data. But I see no point in joining you in that delusional belief. -
Dave123 at 12:29 PM on 11 August 2011Christy Crock #7: People Need Fossil Fuel Energy (Part 1)
And why is it that the engine of private enterprise is routinely claimed to be capable of doing just about anything....except when it means that capitalism's 'creative destruction' is aimed at certain people's stock portfolios and business investments...at which instance all becomes impossible. I hear cognitive dissonance. -
scaddenp at 12:21 PM on 11 August 2011Climate Denial Video #4: The favourite weapon of deniers, cherry picking
Well I am with EtR to some extent. Exaggeration and misinformation in support of a cause does not help it. I think it is common for lobbies for overstate something on the assumption the other side does do, and so the objects of persuasion will fall to a middle ground. I think it is far more persuasive to understate and stick rigidly to facts. That way when a fence sitter examines the evidence and finds the understatement. On the other hand EtR, the graphic says "97% of climate experts", not "97% of scientists". That is an accurate statement. -
Eric the Red at 12:04 PM on 11 August 2011Climate Denial Video #4: The favourite weapon of deniers, cherry picking
Also, Rob you are continuing to reinforce my point about some continuing to believe misinformation in the face of overwhelming evidence to the contrary. Cherry picking 97%, when only 82% of scientists answered yes, and changing the verbage from significant contributing factor to causing global warming are the major reasons that fence sitters move away from believing in global warming -
Eric the Red at 12:01 PM on 11 August 2011Climate Denial Video #4: The favourite weapon of deniers, cherry picking
Yes Rob, That is the fallacy to which I was referring. -
Rob Honeycutt at 11:28 AM on 11 August 2011Climate Denial Video #4: The favourite weapon of deniers, cherry picking
Eric... This comes from Doran 2009: "Of these specialists [Climatologists who are actively publishing on climate change], 96.2% (76 of 79) answered “risen” to question 1 and 97.4% (75 of 77) answered yes to question 2 [Do you think human activity is a significant contributing factor in changing mean global temperatures?]." You are continuing to reinforce my original point. -
DSL at 10:54 AM on 11 August 2011Trenberth on Tracking Earth’s energy: A key to climate variability and change
Advice, Jonicol: when visiting Venus, make sure you wear your extra-thick parka. -
Tom Curtis at 10:37 AM on 11 August 2011Trenberth on Tracking Earth’s energy: A key to climate variability and change
Further to my 103, this is the paper from which the above spectrums where obtained. The satellite making the observations was Nimbus 3 -
Tom Curtis at 10:33 AM on 11 August 2011Trenberth on Tracking Earth’s energy: A key to climate variability and change
jonicol @75, you claim that the CO2 in the atmosphere cools the surface of the Earth. In order to test that idea, could you answer for me the following questions: 1) Does on average the energy the Earth radiates to space equal the energy the Earth receives from the Sun (if we ignore negligible terms such as the radioactive decay of elements, etc)? 2) Does the surface of the Earth radiate IR radiation in same wavelengths that CO2 radiates IR radiation to space? 3) Is the surface of the Earth warmer than the average temperature of the levels of the atmosphere from which CO2 radiates IR radiation to space? 4) If your answer to (2) and (3) is yes, and given Planck's Radiation Law, does the surface of the Earth radiate more or less energy than the energy radiated as IR radiation by CO2 to space in those wavelengths in which CO2 radiates IR radiation to space? 5) In light of your response to (4), would the Earth radiate more or less energy to space in the wavelengths in which CO2 radiates energy to space if there was no CO2 or H2O in the atmosphere? 6) If your answer to (5) is "more energy", and in light your answer to question (1), would the Earth radiate more or less energy to space outside of those wavelengths at which CO2 radiates IR radiation to space taken in aggregate if there was no CO2 or H2O in the atmosphere? 7) If you answer to (6) is "less energy", and given Planck's Radiation Law, would the surface of the Earth be warmer or colder if there was no CO2 or H2O in the atmosphere? The above questions are very simple, and easy to answer for anyone with even a rudimentary knowledge of atmospheric physics. For somebody such as yourself who has widely distributed an article lecturing on the subject, you should have no trouble. You may find the following two diagrams useful answering the questions: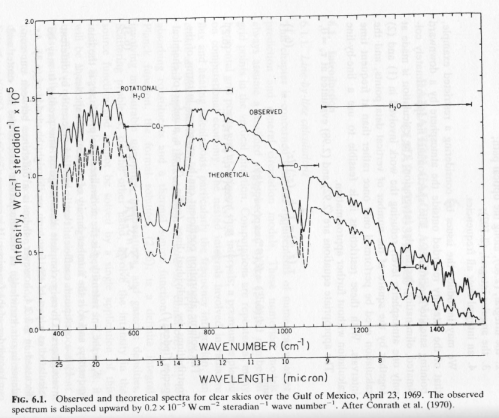
 For those unfamiliar with these diagrams, the firs shows the observed outgoing radiation over the Gulf of Mexico, with the theoretically calculated outgoing radiation shown alongside, with the observed spectrum displaced for easy viewing. The second diagram shows a detail of the same information without the displacement. The theoretically calculated spectrum was calculated using a Line by Line radiation model with observed data for temperature and humidity at different levels of the atmosphere, and shows a fair representation of the accuracy of the models (as of 1970) which are used by the IPCC and disputed by jonicol (and Doug Cotton).
-
scaddenp at 10:16 AM on 11 August 2011Trenberth on Tracking Earth’s energy: A key to climate variability and change
"NASA" figures and "IPCC" diagrams have a single source - Trenberth and Keihl 1997 (okay, or the update in 2009). The apparent difference is what they are trying to show. Try reading the 2009 paper linked in the article. If you have an alternative theory of climate, then make sure it can explain the measurements that are the basis of that paper. -
scaddenp at 10:11 AM on 11 August 2011Climate Denial Video #4: The favourite weapon of deniers, cherry picking
No, Eric. I would welcome such a theory with open arms - that would make my job safe for starters... An older theory will doubtlessly continue to have its supporters but when its clear that data supports a newer one, then the pendulum swings rapidly. Science follows the data. -
Chris G at 10:10 AM on 11 August 2011The Last Interglacial Part Three - Melting Ice and Rising Seas
OK, I am droning, but let me clarify something I wrote above. I don't think it matters too much in terms of if we should continue BAU, or in terms of mitigation strategies. It might still be significant in terms of planning for adaptation. Especially considering that we may have already lost most of the WAIS even if we do manage to stabilize temps a little higher than they are now. Probably it is also useful it getting the public to acknowledge that something needs to change, because I suspect that it is easier (not easy, just easier) to put error bounds around sea level rise than it is to put error bounds around crop production. -
DougCotton at 10:08 AM on 11 August 2011Trenberth on Tracking Earth’s energy: A key to climate variability and change
Nasa figures and simple mathematics prove that upward radiation from the earth's surface (including all resulting from feedback) has energy which is no more than about 30% of the original incoming solar insolation. The ipcc diagram shows figures which amount to 114%. Nasa shows that only one third of heat entering the surface is then radiated back upwards, the rest being diffused by conduction and then convection. This dramatically reduces the effect of feedback. You either accept nasa's estimates or the ipcc's exaggerations which are nearly four (4) times the actual. Prove me wrong. See http://earth-climate.com/ipccdiag.jpg -
DougCotton at 09:39 AM on 11 August 2011Trenberth on Tracking Earth’s energy: A key to climate variability and change
My post 97 was censored without comment and for no reason other than the fact that it disproved IPCC figures. A screen capture of it is linked under 'NASA' in the leading paragraph at http://earth-climate.com Use this link to view it as a thousand visitors each day will do ... http://earth-climate.com/nasadata.jpgResponse:[DB] Mr. Cotton, your post was moderated due to the use of all-caps, a Comments Policy violation. All-caps is the web equivalent of shouting, which is a decorum issue contrary to said Policy. An incendiary tone wins you no style points for argumentarie. If fact, while I'm on the subject, you come across as a churlish 9-year old boy unable to carry on a dialogue with reason and wit. In rhetoric, sir, you carry a failing grade.
You will need to up your game to compete in this Forum.
And before you complain yet again, complaining about Moderation is also subject to mandatory moderation. So please note that posting comments here at SkS is a privilege, not a right. This privilege can and will be rescinded if the posting individual continues to treat adherence to the Comments Policy as optional, rather than the mandatory condition of participating in this online forum.
Moderating this site is a tiresome chore, particularly when commentators repeatedly submit offensive, off-topic posts or intentionally misleading comments and graphics. We really appreciate people's cooperation in abiding by the Comments Policy, which is largely responsible for the quality of this site.
Finally, please understand that moderation policies are not open for discussion. If you find yourself incapable of abiding by these common set of rules that everyone else observes, then a change of venues is in the offing. If you are able to comply with these conditions, which the vast majority of participants in this Forum are able to do without great inconvenience, then your continued participation will be welcome.So, please take the time to review the policy and ensure future comments are in full compliance with it.
You may consider this Strike 2.
-
muoncounter at 09:11 AM on 11 August 2011Trenberth on Tracking Earth’s energy: A key to climate variability and change
scaddenp#98: "misconceptions about basic science which they will hold" Score! These folks inhabit a world with a totally different reality. If you peruse even the mildest skeptic/denier blogs, their basic assumptions are: a. there's no relation between temp rise and CO2 b. there's been no warming since ... c. Arctic ice isn't melting d. global warming isn't global because I can't see it at my house, etc. These are their givens: fixed, immobile 'facts' in their universe. This is a common problem in science education; pre-existing MSMs (multiple simultaneous misconceptions) tend to be very firmly entrenched. One of the quotes I ask my students to consider in the coming first week of AP Physics is this: "The hardest part about gaining any new idea is sweeping out the false idea occupying that niche. As long as that niche is occupied, evidence and proof and logical demonstration get nowhere. But once the niche is emptied of the wrong idea that has been filling it - once you can honestly say 'I don't know,' - then it becomes possible to get at the truth." -- Robert A. Heinlein, The Cat Who Walked Through Walls Not his best work, but the point is supported in educational literature. Miller et al 2007 looked at strategies to deal with student misconceptions in a first-year physics class: ... students were randomly assigned to one of four online multimedia treatments on Newton's First and Second Laws of Motion: (1) the ‘Exposition’, a concise lecture-style presentation; (2) the ‘Extended Exposition’, the Exposition with additional interesting information; (3) the ‘Refutation’, the Exposition with common misconceptions explicitly stated and refuted; or (4) the ‘Dialogue’, a student–tutor discussion of the same material as in the Refutation. Students were tested using questions from mechanics conceptual inventories before and after watching the multimedia treatments. Results show the Refutation and Dialogue produced the greatest learning gains ... So DSL's 'pick one error and refute it' tactic is a good one. You can only drive out the MSM with very direct questioning leading to admission of recognizable paradoxes or contradictions. -
Rob Honeycutt at 09:11 AM on 11 August 2011Climate Denial Video #4: The favourite weapon of deniers, cherry picking
And Eric, you have failed to offer up any explanation of why the graphic is inaccurate. (Thereby adding further evidence to my previous point.) -
Rob Honeycutt at 09:09 AM on 11 August 2011Climate Denial Video #4: The favourite weapon of deniers, cherry picking
Eric @ 10... I completely disagree. If there were a theory put forward that convincingly explained why CO2 would not be causing warming and provided a different mechanism that explained the vast array of observations that CO2 readily explains... I believe there are very few on the AGW side of the argument who would not accept it. The caveat being that it would need to be truly convincing and the scientific community would have to accept the explanation as accurate. This is where the difference between the two sides lay. The denier side will deny in spite of overwhelming evidence. The AGW side believes because of the overwhelming evidence. -
scaddenp at 09:02 AM on 11 August 2011Trenberth on Tracking Earth’s energy: A key to climate variability and change
Fair enough - though not so sure about your criteria. Claiming in an unpublishable paper to overturn science is okay, but root cause is usually have some misconceptions about basic science which they will hold to despite such misconception being at strong variance with empirical data. Refusing to stick to topic is merely violation of comments policy. -
Bob Lacatena at 08:58 AM on 11 August 2011Trenberth on Tracking Earth’s energy: A key to climate variability and change
95, scaddenp, As an added point, current moderation practice and probably policy involves a few warnings before posts are moved. A Climastrology thread (as well as a general tool for easily migrating any post to any thread) could simply be done without the need for any warning at all. This would actually help to keep threads cleaner, and more quickly avoid having them derailed. -
Eric the Red at 08:21 AM on 11 August 2011Climate Denial Video #4: The favourite weapon of deniers, cherry picking
Those who are firmly entrenched on either side are highly unlikely to swayed by any argument. Those who sit on or near the fence can be swayed (possibly multiple times) by reasonable and accurate arguments. An inaccurate argument by either side is likely to do more to sway them in the opposite direction. The graphic above is one of them. -
Bob Lacatena at 08:18 AM on 11 August 2011Trenberth on Tracking Earth’s energy: A key to climate variability and change
95, scaddenp, My main point is that right now, unless you adopt a policy of deleting comments from cranks, then things like those by Doug Cotton are just cluttering real threads and giving them more exposure. A Climastrology thread at least gives you a place to rationally deposit those comments using an objective criteria (anything that purports to overturn existing climate science, and either does not fit into or refuses to stick to the focus of a particular thread). The Bore Hole at RC does the same thing. Stuff that is just way out there gets shoved there. Anyone can see it, but many people don't bother (or don't realize that's where their own off the wall comments wind up). Such a thread that also allows comments by any visitor would allow that stuff to be ripped apart by people, but also be safely quarantined, probably with a header post that talks about crank science (I'd love to write that one!!!!). Anyone that goes to such a thread, reads the comments and then agrees with the Cottons of the world... well, you're never going to be able to teach people like that. -
scaddenp at 07:26 AM on 11 August 2011Trenberth on Tracking Earth’s energy: A key to climate variability and change
A climastrology thread might be rather satisfying, but in terms of the mission of SkepSci, is it that useful? Crank sites like DougCotton's might be entertaining but the real question is whether other people might be taken in by them and in that case, does SkepSci provide an adequate answer to an inquirer? I dont think you have to go to far into the morass of misconceptions but perhaps pointers to relevant threads. RC tried a wiki of debunks and I wonder whether something simple could be created so it is easily searched by an inquirer, and the content is simply links to relevant existing arguments on this or other sites. -
Chris G at 07:20 AM on 11 August 2011The Last Interglacial Part Three - Melting Ice and Rising Seas
Not to drone on, but let's put this in perspective. If we have a sea level rise of 1m by 2100, that is mostly an economic problem. If we have 4 K of warming by 2100... Well, by most accounts, that will present a challenge that is more than just economic. -
Andy Skuce at 07:16 AM on 11 August 2011Climate Denial Video #4: The favourite weapon of deniers, cherry picking
Sphaerica, thanks for the interesting link. All analogies are flawed. I suppose I could argue that US politicians are experts on US politics because they got elected, but that would be beside the point. I was just trying to find an example to illustrate how people might react when they are presented with an argument from authority that they don't agree with. I agree that such arguments can be useful to budge people who are sitting on the fence, but an argument like "most experts agree with me" can also make the fence seem higher for those on the other side. We should recognize that this is a non-technical argument to convince people to change their mind on a technical subject. Nevertheless, it's probably good tactics, as Rob H suggested, to target the fence-sitters and write off the hard core deniers as a lost cause. -
Rob Honeycutt at 07:01 AM on 11 August 2011Climate Denial Video #4: The favourite weapon of deniers, cherry picking
Andy @ 6.... You're right in that this graphic does little or nothing to convince a climate denier of anything. I don't believe the graphic is targeted at those people. There is really nothing that will convince such people, which is why they are deniers in the first place. This graphic is targeting people who are still learning about climate change. In that I believe it is a very strong visual representation of the current state of climate science. -
Bob Lacatena at 06:22 AM on 11 August 2011Climate Denial Video #4: The favourite weapon of deniers, cherry picking
6, Andy S, The difference here is that politicians aren't experts in anything. You need an analogy equivalent to the famed "4 out of 5 dentists recommend" marketing ploy. It works, when the consensus is among experts who are trusted to know more than we do. You can argue about people not trusting climate scientists (because of the very well sown seeds of doubt thanks to certain anti-science interests), but that's another story. You will also find people wedded to denial, and certainly no argument works with them. But for people on the fence, or wondering whom to believe, a statement about "climate experts" should carry weight. I find this article interesting on trusting experts: Experts and Global Warming -
Paul D at 05:11 AM on 11 August 2011Christy Crock #7: People Need Fossil Fuel Energy (Part 1)
The problem is the reverse to what Christy states. In fact he displays the typical anglo saxon arrogance in assuming that the 'West' knows best. How would fossil fuels stop Elephants rampaging through farmers land?? His solution I assume would be to shoot them? The alternative is to use bees around the farm, the elephants don't like them and the farmer has an additional cash product to sell. Low tech ideas are also the best way to go generally in our lives. Why force nature to do something when it is more productive working with it? -
Andy Skuce at 05:01 AM on 11 August 2011Climate Denial Video #4: The favourite weapon of deniers, cherry picking
Relying on the consensus views of experts is a useful heuristic, a mental short cut, that we all use, most of the time, to make decisions when we don't have the ability or the time to research the problem for ourselves. To use consensus as an argument can be useful in swaying the opinions of the undecided (it also provides some confidence to the already convinced). The danger is that it's not a logically valid argument and there are famous incidents where it has failed in the past. Another shortcoming is that it can even act as a rallying cry to the dissident minority. Consider this bogus statistic that I have made up, just for the sake of argument. The effect that such an argument would have on me (I am convinced that carbon taxes are a realistic and even necessary public policy option) would be to say: To hell with them and their biased and smug opinions, that's what they used to say about civil rights! I'm going to call my representative right away!
In other words, appealing to scientific consensus is probably counter-productive when arguing with convinced climate contrarians.
The effect that such an argument would have on me (I am convinced that carbon taxes are a realistic and even necessary public policy option) would be to say: To hell with them and their biased and smug opinions, that's what they used to say about civil rights! I'm going to call my representative right away!
In other words, appealing to scientific consensus is probably counter-productive when arguing with convinced climate contrarians.
-
Paul D at 04:34 AM on 11 August 2011Christy Crock #7: Expensive and inaccessible (Part 2)
Energy efficiency can be revealed in part by a nations carbon footprint per capita, at least while fossil fuels still dominate. The US carbon per capita is much higher than other countries, with the exception of the middle east. This is also obvious visually as well in that American vehicles have always been bigger, homes less insulated, obesity on the rise, buildings spread out more etc. Some of this is due to cheap resources, make things cheaper and there is no incentive to be more efficient. Also, when considering fossil fuels, every bit of inefficient use means the energy wasted is literally lost for ever. If you drive a car that consumes 3 times more fuel than other cars, to travel from A to B, that energy is lost forever when it could have helped other people to travel from A to B, or used to do more journeys from A to B. Even if you don't like renewables, your making things even worse for future generations by driving gas guzzlers, by denying them (some of whom will be your offspring) what you had. It is quite bizarre to oppose renewables and use fossil fuels inefficiently. You can't really be more irresponsible by doing both. -
Bob Lacatena at 03:48 AM on 11 August 2011There is no consensus
377, Eric the Red, You also avoided my salient questions from post 375:Either way, how does this in any way support your original contention that "scientists are placing too much emphasis on outgoing radiation effects in the atmosphere as opposed to convection"? Or are you openly withdrawing that comment?
-
Bob Lacatena at 03:25 AM on 11 August 2011Trenberth on Tracking Earth’s energy: A key to climate variability and change
93, DB inline, That would be a generally useful tool for migrating any comment to where they belong, although a hardcoded "Climastrology" button (another good name choice for the thread) would also do the trick. It will be up to John, though, to figure out if this happens often enough and is important enough to warrant his time (and then to find the time). I'll make a post in the forum for the suggestion. -
actually thoughtful at 03:10 AM on 11 August 2011Christy Crock #7: Expensive and inaccessible (Part 2)
Most analysis misses a few subtle points: 1) How is current society shaped by a monopoly provider of electricity and gas to each home (as opposed to each building providing its own energy)? 2. How are we shaped by using fossil fuels? Simple example: most people set the thermostat lower in winter to save money (energy). Renewable energy customers, to get the most efficiency out of their systems, spend most of the winter with a HIGHER thermostat setting. Buildings designed to not need heat/AC are even more comfortable yet. 3. How much of money does the average person spend, over their lifetimes, on fossil fuel? Renewables are always cheaper when you look at "lifecycle" costs (and I mean this in both ways here). -
pbjamm at 03:05 AM on 11 August 2011Trenberth on Tracking Earth’s energy: A key to climate variability and change
Sphaerica@92 I like the idea of moving what are essentially crank comments to a Climastrology or Looking Glass thread of their own. It would help de-clutter the threads, archive the nonsense for future reference and allow the discussion/debunking of it to continue. It might be a bit tedious for the Moderators though.Response:[DB] It would be only onerous to John, as he'd have to do the PHP coding. For Moderators, all they would have to do is to select the appropriate thread to move it to (from a drop-down menu, presumably). However, once coded the process would be straightforward.
-
Bob Lacatena at 02:54 AM on 11 August 2011There is no consensus
377, Eric the Red, Yes, we know. That's where we looked. That site is not only in complete agreement with Trenberth, but it got its data from Trenberth. Follow the citations at the end of the article. You have greatly misinterpreted what you found there. You need to read it much, much more carefully. And where exactly in that did you get your numbers from? I don't find your particular numbers anywhere there. -
Chris G at 02:47 AM on 11 August 2011The Last Interglacial Part Three - Melting Ice and Rising Seas
Tom Curtis had an interesting comment under the "Where have all the people gone" post. Tom's assessment of the overall situation is very close to mine (that there will be bigger problems than coastal flooding), for whatever that's worth. However, Tom proposes that rates of rise in the past provide our best estimate of what can be expected out of the future, and my thought is that we don't know if the paleoclimate rates were constrained more by the physics of ice, or by the rate of warming of the planet at large. Since we are on a path of warming faster than before, if the former, then Tom is right, if the latter, we just don't know. If memory serves, a couple of years ago there was a study of the Greenland sheet that constrained how quickly ice can be lost based on how fast it can melt and how quickly ice can flow over the topography. This constrained sea level rise to 'only' 1-2 meters by 2100. On the Antarctic side, there is also this paper Stability of ice-sheet grounding lines and this news story based on it Major Antarctic glacier is 'past its tipping point' This is interesting to me because it factored in the model how an increase in sea level will accelerate the loss of ice from Antarctic, which will increase sea level. Without specifying a rate, it remains that the rise will accelerate. RealClimate has several posts which might be useful if you search for Greenland and WAIS, not at the same time necessarily. In agreement with the conclusion above, the evidence is building that Greenland is more stable than may have been thought 10 years ago, and the WAIS less stable. Agnostic, You will find varying estimates. A good start would be to Google Scholar "Stefan Rahmstorf", "Mauri Pelto", and others referenced in the links above. I don't think it matters that we know what the rate will be at any particular point in the future because, under BAU, it will accelerate until the supply of sheet ice to melt is reduced. That almost guarantees the rate will be more than we can easily cope with at some point, and it will be one problem of many. -
jeff_from_ky at 02:20 AM on 11 August 2011Where have all the people gone?
DB Comment on #24 Earth Abides (a great novel) was written by George R. Stewart, not George R. R. Martin.Response:[DB] You are very much correct (facepalms). My bad. My copy is missing from the shelf (I can't blame the kids because the oldest doesn't read despite a perfect GPA & top entrance marks to college & the other is but 8...), else I'd have caught that.
-
Bob Lacatena at 02:02 AM on 11 August 2011Trenberth on Tracking Earth’s energy: A key to climate variability and change
91, Tom, Wow. I haven't bothered to actually read much of his nonsense, but that's quite a looking-glass-in-a-nutshell you've got there. Honestly... Deleted comments should be used for Comments Policy violations, but RealClimate now has 'The Bore Hole' where certain comments can be simply moved but not deleted, and I think that SkS should have 'The Looking Glass' (or perhaps "The Aether and Other Phlogiston" or "Galileo's Descendants", except that's a huge insult to Galileo)... a place to send comments like these where they can still be seen, but unlike The Bore Hole, a place where further comments/replies can still be made. Basically, it becomes a stand alone thread for this sort of utterly made-up nonsense that may or may not receive refutation, and usually doesn't belong anywhere in particular (I'm not sure this is the right thread for arguments about basic physics, but neither is the 2nd Law thread, or anyplace else). The only thing the moderators would need is an easy tool (button) for migrating such comments to that thread (preferably leaving a placeholder comment behind, with something to the effect of "Moved to The Looking Glass" with a link to the migrated comment). I can think of scores of examples in the past months alone where such a silly place is exactly where such comments belong. -
Tom Curtis at 01:40 AM on 11 August 2011Trenberth on Tracking Earth’s energy: A key to climate variability and change
I believe Doug Cotton's post number 77 deserves very careful consideration by anybody who thinks he may have anything worthwhile to say on any scientific matter. With the moderators indulgence, I shall quote it in full:"Thanks Jonicol. Yes I do realise O2 and N2 don't emit many photons, but as they rise and cool (perhaps eventually near the top of the atmosphere) they must release the energy in the form of photons at least when they get close to absolute zero. And the energy they carry represents about two thirds of the heat that came out of the surface as it cooled in the evening. The other third gets radiated back, about 70% of that being captured and half of that returning to the surface, then a third of that radiated up again etc. But each "return trip" is very fast and the radiated "feedback" is being reduced by nearly 90% each time. Also, since two thirds of the heat energy in the surface/oceans went into other air molecules (outnumbering CO2 by 2,500 : 1) there is still about half of that coming back, eclipsing that from CO2. This is why the heat of the day extends into early evening, but it usually cools by morning to (in calm conditions) the temperature supported by the temperature gradient from the core."
(My emphasis) So, according to Doug Cotton, O2 and N2 release no photons, but do release photons, and in fact release photons with sufficient energy to represent two thirds of the upwelling surface radiation. Indeed, they release that energy when they are near absolute zero in temperature. In other words, Doug Cotton directly contradicts himself in the space of one sentence, and contradicts at least four scientific laws in the whole passage, including the First and Second Laws of Thermodynamics, the Stefan-Boltzman law, Kirchoff's Law. Sphaerica and DSL, there is no need to worry about Cotton's thread pollution until he fully retracts this nonsense. In what ever thread he wishes to spew his garbage, we need only link back to his post 97 and request he resolve the contradiction. Anyone reading the thread with an open mind will recognize the reasoning of anyone who does not balk at contradicting himself is neither worth listening to, nor worth discussing. -
muoncounter at 01:39 AM on 11 August 2011Trenberth on Tracking Earth’s energy: A key to climate variability and change
Sphaerica#89: "such people will still litter as many threads as they can" That's exactly their intent (call it 'the dam--bel effect' or 'the Gil-- phenomenon'); sometimes it seems they come in waves, as if sent here by some unseen tidal surge. Unfortunately, without rebuttal, it appears to the casual observer that our argument is weak. I find it interesting to search key phrases in these posts. It is revealing that the same folks had the same arguments debunked two or three times - in some cases, years ago. Example begins here, but also look here. -
Bob Lacatena at 01:17 AM on 11 August 2011Trenberth on Tracking Earth’s energy: A key to climate variability and change
88, DSL, The only flaw that I see with that approach is that such people will still litter as many threads as they can with their "insights," which will then go unchallenged, and be taken as "very good points" by less informed and cognizant readers. But, to follow your approach, in #82 CBDunkerson made a fairly simple and indisputable case that Doug's syllogism wasn't valid... Doug put together two facts from which to draw a conclusion that does not in fact follow from those facts. Until he acknowledges that, the very foundation of Doug's entire position crumbles, and so nothing of any value can be taken from it.Response:[DB] Bags of hammers are like that.
Prev 1568 1569 1570 1571 1572 1573 1574 1575 1576 1577 1578 1579 1580 1581 1582 1583 Next


