


 Arguments


Recent Comments
Prev 1571 1572 1573 1574 1575 1576 1577 1578 1579 1580 1581 1582 1583 1584 1585 1586 Next
Comments 78901 to 78950:
-
Rob Honeycutt at 13:08 PM on 19 July 2011Websites for Watching the Arctic Sea Ice Melt
muoncounter... I was looking at that same image just about 5 mins ago. Pretty dramatic! I think 2011 is going to beat 2007 this coming Sept. -
muoncounter at 12:40 PM on 19 July 2011Websites for Watching the Arctic Sea Ice Melt
msweet#204: "there is a lot of snow in Fall and winter and then it melts quickly in the spring." That is well-illustrated by this melt onset anomaly graphic on the NSIDC page you reference.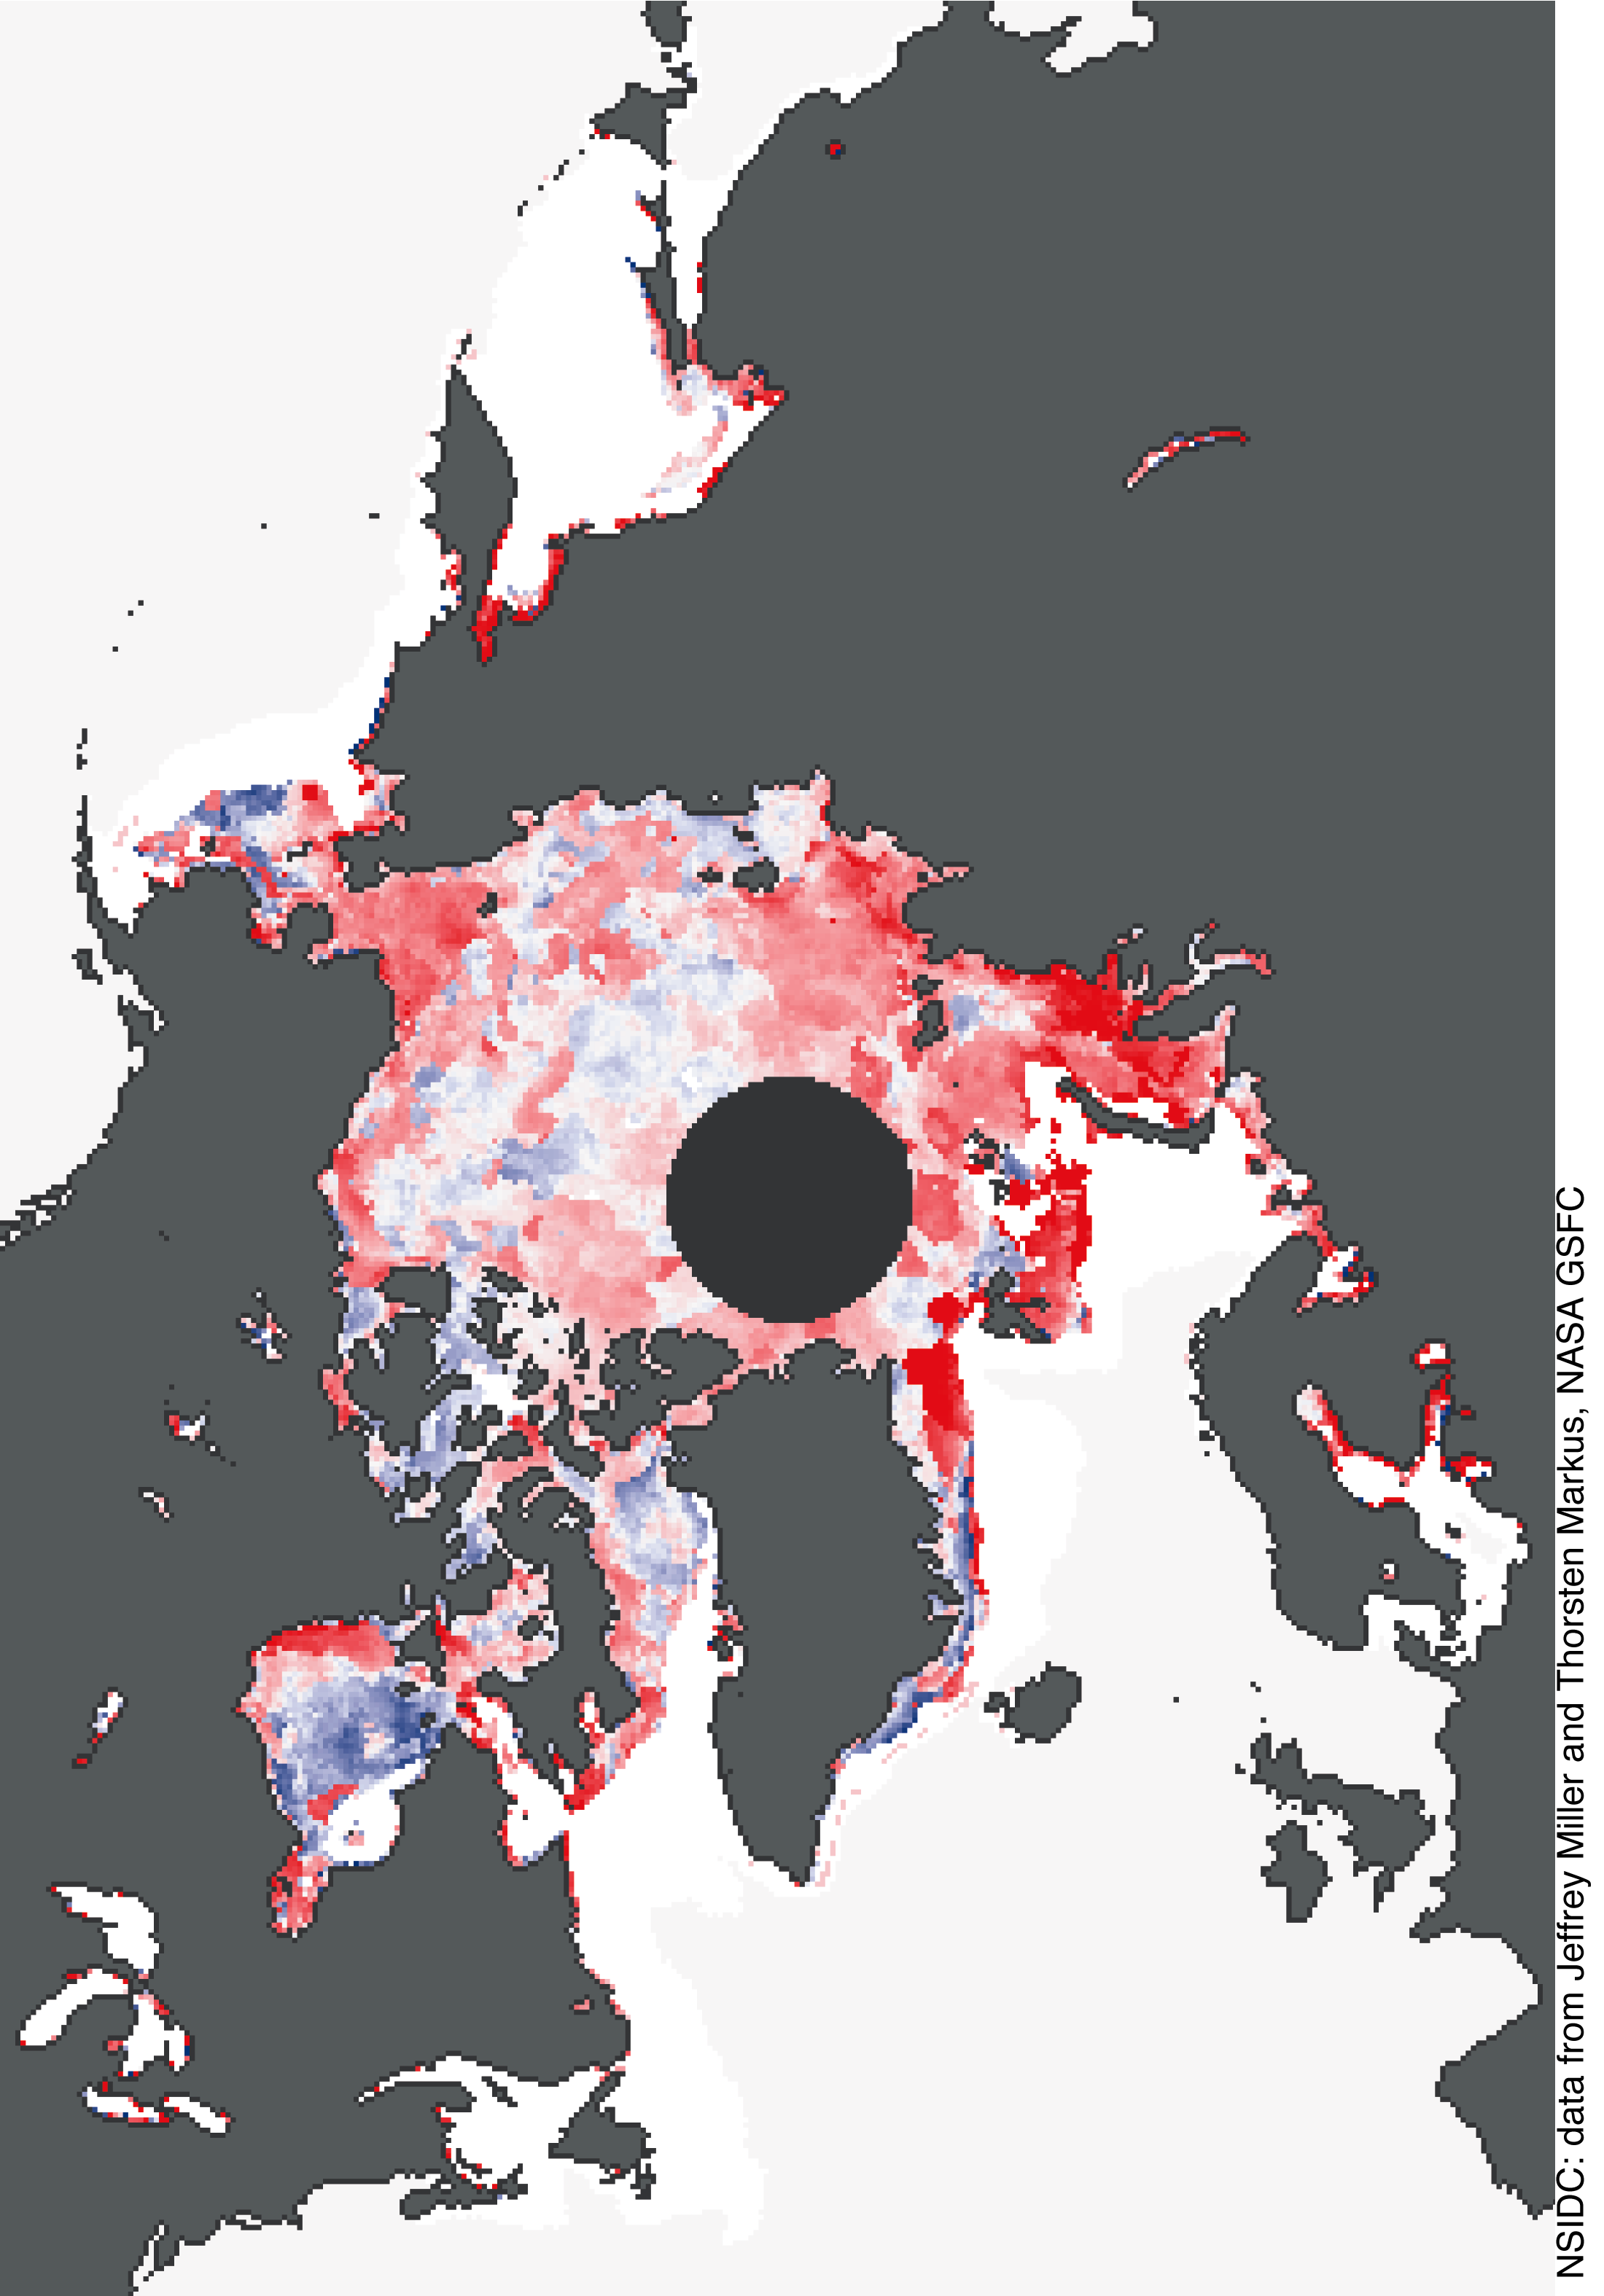 The darkest red is an anomaly of 50 days early or more.
An earlier start to the melt season no doubt means a longer melt season. Let's see how we can spin that into some form of 'no its not' denial.
The darkest red is an anomaly of 50 days early or more.
An earlier start to the melt season no doubt means a longer melt season. Let's see how we can spin that into some form of 'no its not' denial.
-
Paul Magnus at 12:35 PM on 19 July 2011China, From the Inside Out
Rob, I totally agree with you on that point of what is necessary... its all relative to your perspective on the problem. Putting a realistic price on carbon that reflects its pollution right across the board would/will sort out whats necessary and whats not. Currently the asking price is around $10-$25 per ton. More accurate pricing would start around $50-$100 per ton and probably should be higher. And then we have reports just out which suggests prices right outside the ballpark.... Economists Urge Honest Accounting of Carbon's True Costs http://tinyurl.com/climateportal135 Little attention is being paid to another debt that is ballooning out of control and threatening to spur its own economic chaos: the carbon debt. ... each ton of carbon dioxide emitted in the atmosphere results in as much as $893 in economic damages... New Report Highlights Weaknesses in Government’s Cost-Benefit Analysis of Climate Cha http://tinyurl.com/climateportal136 A new report on the “social cost of carbon” identifies significant weaknesses in current cost-benefit analyses that do not adequately measure the real harm inflicted from climate change. The report, “More than Meets the Eye: The Social Cost of Carbon in U.S. Climate Policy, in Plain English,” -
Norman at 12:08 PM on 19 July 20112010 - 2011: Earth's most extreme weather since 1816?
Tom Curtis @ 348 I am not sure how you are calculating lapse rates from the graphs you have posted. Regardless that is not my point. I feel I am not communicating my idea very well with you and I fault myself for that. I was attempting to demonstrate my postition with the H-bomb situation in Post 337. "your argument is that the cold, more northerly air coming south has a reduced lapse rate, which will result in weaker CAPE, the fact that models predict a reduction in tropical lapse rates, but an increase in Arctic lapse rates runs directly counter to your main premise. In fact, to the extent that your argument has any validity, and with that knowledge of lapse rates, you should be predicting much stronger CAPE, and hence stronger and more frequent storms." My argument is not about the lapse rate of arctic air. It is about the actual temperature of this air and how it determines bouyancy of an air parcel. Current time the North pole air mass is at a certain temp aloft. From an article I linked to above, Continental polar air can have a temp of -40 C at 4000 meters. This cold air moves in during the winter and dominates the Midwest plains of the United States. As spring comes air is warming rapidly in the south slower in the north (especially if there is snow on the ground in the north). The air aloft warms much slower than the surface so it may not be at -40 C during spring (I don't have numbers) but it will still warm much slower than the ground. Say it is -30 C at 4000 meters. Now a strong low pressure systme pulls up a lot of the warm moist gulf air into this still cool air aloft. It is reasonable to expect a warm moist air parcel of 25 C moving into the area. Until it reaches the condensation level (maybe 1000 meters for this air) it will cool at the dry adiabatic of about -10 C/1000 feet. After the first 1000 meters the air has cooled to 15 C and start to condense. Now it cools at the moist adiabatic rate of around -6 C/1000 meters. It will cool 18 more C or be at -3 C when it reaches 4000 meters. The air aloft is still at -30 C. The parcel is considerably lighter than the surrounding air and continues to rise to the top of the troposphere, a powerful storm. You see it is not the lapse rate of the artic air that is so critical. It is its actual temperature profile in relation to the temp profile of air that will rise into it. If I am wrong in my thinking then you can criticize sources such as this. Book chapter about atmospheric stability. In this book here is a quote: "In addition to the seasonal effects directly caused by changes in solar radiation, there is also an important effect that is caused by the lag in heating and cooling of the atmosphere as a whole. The result is a predominance of cool air over warming land in the spring, and warm air over cooling surfaces in the fall. Thus, the steepest lapse rates frequently occur during the spring, whereas the strongest inversions occur during fall and early winter." So if I am wrong I guess it is the source I am using. I would like you to demonstrate how this thinking is flawed. Thanks. I am grateful you are taking the time to respond to my posts. I do learn alot from this interaction.Response:[DB] Fixed link.
-
Tom Curtis at 12:07 PM on 19 July 20112010 - 2011: Earth's most extreme weather since 1816?
DB @348, you got it exactly right. Let me thank you for the sterling job you and the other moderators do here on SkS. I would thank you far more often, except then I would be cluttering up quite a few threads with thanks, and multiplying your work by the need to remove all those posts.Response:[DB] My pleasure, Tom. I think I speak for the other moderators in that we would much rather step in and help in that fashion than those many times when we're forced to intervene & be the bad cop. Your willingness to engage multiple parties in your usual patient manner is appreciated.
-
Tom Curtis at 11:29 AM on 19 July 20112010 - 2011: Earth's most extreme weather since 1816?
Eric the Red @345:"As stated earlier, I believe that the winds shear will predominant, and will decrease due to the decreasing temperature gradient (among other things)."
With all due respect, this is a fairly subtle issue and just guessing has about as much chance of being right as a coin toss. Even educated guessing is little better, and by educated in this context I mean that of experienced meteorologists immersed in the field. Until you actually run that Maths, you have no real idea of the sign of the change, let alone the magnitude. And in this context, "run the maths" means run the best models you have available. As it happens, the maths has been run and has come to the opposite conclusion of your relatively uninformed guess. Still, it is a subtle issue and the model may be wrong, so we look to the data. In this case the data is showing a clear trend to more tornadoes, but significant trend for the strongest categories of tornadoes. Other forms of storms also show a positive trend. In other words, both data and models agree. There are problems with the data, although no it is nowhere near as problematic as Norman attempts to suggest. And models are not super accurate at this style of prediction. So we may, and I hope we do, get lucky in this regard. But regardless of our hopes, the evidence points the other way. You would do well to acknowledge that and factor that into your premises in considering what is the best policy with regard to global warming. -
Norman at 11:29 AM on 19 July 20112010 - 2011: Earth's most extreme weather since 1816?
Tom Curtis @ 344 Page 6-3 of this link has a comparisson of 4 different air types. One is Arctic Polar the other are moist air masses. The Arctic Polar has a similar lapse rate. Comparisson of different air mass lapse rates graph, very simplistic. Here is another paper for you to look at. On page 2279 of this article there is a graph of actual lapse rates of air turning into polar continetal. You can figure out the lapse rate yourself by looking at the height vs temp change. The overall temp drop is positive, the air at the top is warmer than the air at the bottom. If you look at day 13 of cooling. I estimate about an 11 C drop in 2250 meters of air. That would be a lapse rate of -4.8 C/1000 meters. Much less than the -9.8 dry air. Article with graph of Polar air lapse rates over 14 days of cooling. -
chris1204 at 11:29 AM on 19 July 2011Lessons from Past Climate Predictions: Wallace Broecker
Dikran Marsupial @ 5 Arkadiusz' graph comes from a German language site ultimately sourcing a NASA website circa 2000 - hence, no doubt the reference to "old" uncertainties. Wasn't hard to trace - took all of three minutes. It took me much longer to try to work out how best to post the link, which ended up a dismal failure so apologies for the resulting clutter. The site incidentally is basically pro-AGW. http://science.nasa.gov/science-news/science-at-nasa/2000/ast20oct_1/Moderator Response: [Dikran Marsupial] Link activated -
Camburn at 11:15 AM on 19 July 2011Sea level rise is exaggerated
scaddenp: I would not bet on that being a long term trend at all. What I would like to know, being Envistat covers more of the globe and has demonstrated a slowing of MSL rise, why? Physically, it does not make sense. -
Rob Honeycutt at 11:15 AM on 19 July 2011China, From the Inside Out
Bern... I did know that about China's nuclear program. I should have included that information. Thanks for bringing it up and linking it. -
Tom Curtis at 11:12 AM on 19 July 20112010 - 2011: Earth's most extreme weather since 1816?
Norman @347, the following is the projected change in atmospheric temperatures for a doubling of CO2, and represents a reasonable stand in for projected changes by the end of the century: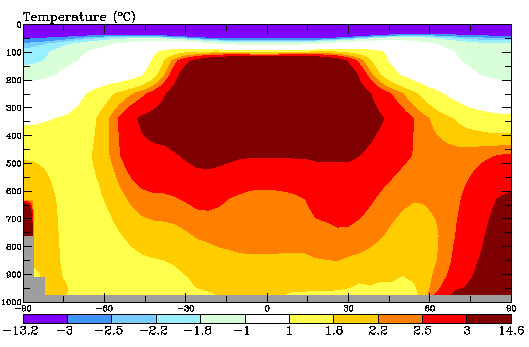 Three to five kilometers above ground level is approximately 700 to 500 millbars pressure, and as you can see, the maximum difference in the change in temperature for those levels is 0.8 degrees, or a 0.4 degree reduction in the lapse rate. A 0.4 degree change in the lapse rate over 100 years is a trend of 0.004 degrees change per annum, or "essentially no longterm trend".
I note that this is the maximum possible trend, and that and that at more northerly latitudes the trend is weaker. At 30 degrees north, the trend has reduced to, at most, a change of - 0.0025 per km altitude per annum. At sixty degrees north it becomes essentially non existent, while further north it becomes positive, ie, the lapse rate increases.
As your argument is that the cold, more northerly air coming south has a reduced lapse rate, which will result in weaker CAPE, the fact that models predict a reduction in tropical lapse rates, but an increase in Arctic lapse rates runs directly counter to your main premise. In fact, to the extent that your argument has any validity, and with that knowledge of lapse rates, you should be predicting much stronger CAPE, and hence stronger and more frequent storms.
Response:
Three to five kilometers above ground level is approximately 700 to 500 millbars pressure, and as you can see, the maximum difference in the change in temperature for those levels is 0.8 degrees, or a 0.4 degree reduction in the lapse rate. A 0.4 degree change in the lapse rate over 100 years is a trend of 0.004 degrees change per annum, or "essentially no longterm trend".
I note that this is the maximum possible trend, and that and that at more northerly latitudes the trend is weaker. At 30 degrees north, the trend has reduced to, at most, a change of - 0.0025 per km altitude per annum. At sixty degrees north it becomes essentially non existent, while further north it becomes positive, ie, the lapse rate increases.
As your argument is that the cold, more northerly air coming south has a reduced lapse rate, which will result in weaker CAPE, the fact that models predict a reduction in tropical lapse rates, but an increase in Arctic lapse rates runs directly counter to your main premise. In fact, to the extent that your argument has any validity, and with that knowledge of lapse rates, you should be predicting much stronger CAPE, and hence stronger and more frequent storms.
Response:[DB] Fixed image (let me know if this was the incorrect one). Graphic derived from http://www.skepticalscience.com/tropospheric-hot-spot-advanced.htm
-
Rob Painting at 11:11 AM on 19 July 2011China, From the Inside Out
Very interesting Rob, thanks for the insight. Pierre-Emmanuel Neurohr - while your views seem to be at the extreme end of the spectrum, I understand where you're coming from. Many who accept the science of global warming, don't truly comprehend the urgency, and scale, of the situation. -
Rob Honeycutt at 11:09 AM on 19 July 2011China, From the Inside Out
paulm... How do you determine what is necessary? I know a lot of people whose jobs require them to travel to Asian, some of them 8 or more times a year. Their livelihood depends on it. If they don't do it someone still has to do that work. For me, taking annual trips like this are, in my opinion, necessary. The only other option would be to divorce my wife (whom I am deeply in love with) and not allow our kids to see her or have me never see them. It's just not an option I'm willing to entertain. I believe I do have a strong understanding of what is needed to address climate issues. I do not believe shutting down economies or entire industries is a solution. On the contrary, it would worsen the crisis by crippling the economy! What is required is creating solutions. Look, Pierre is putting forth an argument that suggests that given available technologies we should all live like Cambodians. It's a non-starter way to address the issue. Yes, we need to get everyone's carbon footprint down to what Cambodians are but not by living like Cambodians. We need clean energy and transportation solutions that raises Cambodians lifestyle up to modern standards without raising their carbon output. This is very much what I'm trying to point out in the article. While in the short term it is assured that China's carbon output will rise, they are actually taking the steps which will allow them to reduce, if not eventually almost eliminate, their carbon output... while raising the standard of living of another billion people. -
Bern at 11:03 AM on 19 July 2011China, From the Inside Out
Pierre, paulm: I'd disagree with you. I think air travel is an essential part of the modern global economy. It is also a relatively minor part of the total problem. Changing other forms of transport to non-carbon-emitting modes will have a far greater impact on greenhouse emissions, and a far lesser impact on the global economy (it may even stimulate it). Banning or heavily restricting air travel will have a far lesser impact on greenhouse emissions, and a far greater (and probably negative) impact on the global economy. I'm not a big fan of biofuels for land transport use (far too much would be required, and viable alternatives such as electric cars or mass transit are far more efficient), but they can be used for applications, such as air travel, where liquid hydrocarbon fuels are essential. Rob: One other point - I note you didn't mention that China is also building about 27 new nuclear reactors. All new generation III types, with far greater safety than the old 60's vintage designs that failed at Three Mile Island and Fukushima Dai-ichi. According to this article, they're aiming for 80GW nuclear capacity by 2020, 200GW by 2030, and 400-500GW by 2050. They're also doing a lot of research & development work on completely passively-safe reactor designs, including pebble-bed reactors and thorium-fuelled designs (I understand China has a lot of thorium, but not huge reserves of uranium). That article also mentions that they've closed down 71GW of dirty coal-fired plants since 2006, which is certainly a different perspective from the usual "China builds a new coal-fired power station every week" meme... To put that into perspective - all the coal-fired power stations in Australia add up to about 30GW total capacity. So China has shut down more than twice as much coal-fired power generation in the last 5 years as Australia currently operates. -
Stevo at 10:59 AM on 19 July 2011China, From the Inside Out
Thanks for an interesting post, Rob. The climate action debate here in Australia often mentions what is happenning in China but, of course, politicians just mention the facts which suit thier own arguments. The two enlightening things I found in your piece were that while opponents of climate action harp on about how many coal fired power stations China is building they neglect to mention that old, dirty plants are being closed down. The other was the cultural difference which has them less dependant (addicted?) to intensive electricity use domestically than we in the West. -
Paul Magnus at 10:35 AM on 19 July 2011China, From the Inside Out
Your article was very enlightening. And makes good points. I have to side with Pierre though. I dont think you understand fully what is involved with tackling this problem. People who are trying to convince others that we need to reduce ghg emissions can not expect them to get onboard if they themselves are not living by their word. Not only do we need to reduce emission but we have to get back to at least 350ppm. Unless your flight is necessary in tackling ghg reduction it is usually unnecessary and should be avoided. As Pierre points out... it wont be long before flighing is too expensive due to peak and climate disruption anyway. It is a moral issue as well.... >Yes, our lives must be an expression of what we most deeply value. >Yes, we can and must make conscience-driven choices about how we spend our money and time. >Yes, we must provide a safe and thriving future for our children. https://www.facebook.com/pages/ClimateFlightAction/165484890164497 By signing up to reducing your non-essential flying you make a big impact on emissions reduction in multiple ways. >Your emissions are substantially reduce. >Your resolution highlights and focus the urgency of the issue and the sort of effort that will be required to address the problem with your peers. >You reenforce and provide suport to consolidate action in tackling global warming. -
michael sweet at 10:26 AM on 19 July 2011Websites for Watching the Arctic Sea Ice Melt
The NSIDC has posted a mid month update. The sea ice is at the lowest level ever recorded for this date. The ice has melted faster this year than in 2007. Most regions are melting fast. A large area north of Alaska is very thin and expected to melt out soon. Read the NSIDC post for all the data. Snow cover is also very low. A pattern in the last few years has emerged where there is a lot of snow in Fall and winter and then it melts quickly in the spring. -
Rob Honeycutt at 10:22 AM on 19 July 2011China, From the Inside Out
Pierre... No, I don't believe my response is disingenuous at all. My response is realistic. The most climate polluting machine on the planet is, in fact, the automobile. That is indisputable. Aircraft are not even the most polluting form of transportation. My sense is that you're trolling and are not actually interested in a conversation. Your comments have absolutely nothing to do with any part of the article posted above. -
Tom Smerling at 10:06 AM on 19 July 2011China, From the Inside Out
Thanks for posting this, Rob. Regardless of one's take on the details -- half-empty or half-full cup -- its always refreshing -- and rare -- to hear a first-hand account. So many of us are just "reading the tea leaves" from afar. -
Norman at 10:02 AM on 19 July 20112010 - 2011: Earth's most extreme weather since 1816?
Tom Curtis @ 342 Your countepoint 2) "You repeatedly assert that the models do not allow for a changing environmental lapse rate. That is false. Rather, they do not program the change in lapse rate in to the model, but allow the physics to sort it out." That is not my question. My question is why do their models not show a change in the lapse rate. Quote from Trapp et al (2009) article you and Albatross have links to. "For the current experiments, these are listed in increasing order of importance, with essentially no longterm trend indicated in the temperature lapse rates over a 3–5 km AGL layer (not shown)," Other souces are claiming Global warming would change the lapse rates in a negative way (one reason is the the mid-lattitude troposphere would be the receiver of latent heat and tend to warm). I am not stating they should put in a changed lapse rate in their model. I am asking why doesn't the model develop a changed lapse rate. -
Pierre-Emmanuel Neurohr at 09:51 AM on 19 July 2011China, From the Inside Out
Dear Rob, your answer according to which "all of aviation accounts for about 4% of total human carbon emissions" is slightly disingenuous. Using that kind of trick with numbers, travelling with private jets is very green, since it represents 0,0000001% of total human carbon emissions... The only sensible and honest approach is "how much CO2 per person per year"? By that token, polluting with more than two tons of CO2 in a few hours when your yearly quota is around 1,5 t cannot be acceptable, when one knows the dire consequences of climate destruction. And when you look at numbers for "rich" countries like the UK or France, aviation has a share that's far from negligible, approaching 10%. Furthermore, re. "One solution would be to basically shut down all economies around the world": no problemo, the extreme weather that's coming -thanks to the overuse of energy- will do just that for millions of people. Saying it another way, I think the question I raised re. the most climate-polluting machine a normal citizen can use -aka the "plane"- deserves a more serious discussion. -
SNRatio at 09:45 AM on 19 July 2011Lessons from Past Climate Predictions: Wallace Broecker
I think that, in the development of science, there comes a time where it is simply not legitimate any longer to neglect theories that are firmly based on standard physical understanding, and have stood the test of time quite well. While they may, ultimately, still be wrong in many (if not all) ways, we are simply not allowed to deny the possibility that they are right, and still stay within the realm of science. It's fully legitimate to believe something different than consensus, and to find and present the evidence supporting that alternative view. It is _not_ legitimate, however, to overlook all the evidence supporting the opposing views. One may propose alternative interpretations, but those interpretations may have a very hard time getting accepted. When we have a simple (in terms of physical understanding) model, we won't reject that for a more complicated one until that one is shown to be significantly better. It is _not_ a competition on even terms here. To throw established parameters out of a model, you have to substitute something that is demonstrably better, subject to model complexity. Here: Given the understanding and the evidence re greenhouse gases, it is a very big task to establish valid explanations that they don't matter in practice, after all. Akasofu's cyclical explanation model may be a case in point here. It would have to perform brilliantly on new data to be accepted, which it can hardly be said to do now. In the context of confirmation, there is no need to fully specify a hypothesis (here: the totality of forcings from gases), and it's therefore not quite fair to judge the merits of an only partially specified hypothesis on comparison with observations alone. Rather, we can look at the original formulation, and make some estimates about how a more complete specification, based on the present state of knowledge, would modify the original predictions. It seems that Broecker's work then looks even better. -
Norman at 09:41 AM on 19 July 20112010 - 2011: Earth's most extreme weather since 1816?
Tom Curtis @ 342 Tom, I can't agree with your statement: "1) If a spinning body extends its radius, it will slow down the spinning body. Consequently, the raising of the tropopause does indeed slow down the Earth by some imperceptibly small amount. (Or perhaps no imperceptible, they measure the length of the day very accurately these days.) But in extending the radius, the angular velocity of the outermost portion of the rotating body becomes greater." Quote from information on angular momentum: "This formula indicates one important physical consequence of angular momentum: because the above formula can be rearranged to give v = L/(mr) and L is a constant for an isolated system, the velocity v and the separation r are inversely correlated. Thus, conservation of angular momentum demands that a decrease in the separation r be accompanied by an increase in the velocity v, and vice versa." Source of above quote. -
Tom Curtis at 08:48 AM on 19 July 2011It's the sun
Eric (skeptic) @883, first, Sphaerica's 880 and 881 are I believe restatements of my first point in 886. So are Dikran's 877 and 879, though he states it with greater clarity and economy than I do. Second, I think the best way to state it is that the unrealized instantaneous forcing is very much larger for CO2 than for TSI changes associated with the solar cycle, and significantly larger than for TSI changes at any time in the twentieth century. By "unrealized instantaneous changes" I mean the change in total forcing due to a given factor at anytime minus the change in OLR due to changes in surface temperature at the same time. I take it that is what you mean by "ongoing long term forcing", and also what Sphaerica was describing in his 882. That being the case, we can all now agree furiously together on this point. -
Tom Curtis at 08:30 AM on 19 July 2011Monckton at odds with the very scientists he cites
adelady @27, an interesting and relatively insightful article. I guess that is what makes it depressing. -
Tom Curtis at 08:28 AM on 19 July 2011Monckton at odds with the very scientists he cites
Rob Honneycutt @26, I definitely exempt Wendy Carlisle, from whose program I drew my quotes, from my criticism. Although even she made one clear science error in her program. But Wendy Carlisle, or even the ABC in general, do not have that large a market share. Where is "A Current Affair"s expose of Monckton? Or any of the major commercial curren affair's programs? Or where is the expose in "The Australian" or any of the major Newspapers? At the moment the Australian media is mostly playing Dumb to Monckton's Dumber. -
scaddenp at 07:48 AM on 19 July 2011Sea level rise is exaggerated
"Climate modelers can most likely make sure their models do whatever they want." Another baseless assertion. Please explain then why skeptics cant use the models to make anthropogenic warming go away? Camburn, so you would bet on that being a long term trend? -
Rob Painting at 07:45 AM on 19 July 2011Sea level rise is exaggerated
Steve Case -"Analysis without any data is even more useless." So ARGO is now useless because the data do not match your preconceived notions? You're not making any sense whatsoever. "Climate modelers can most likely make sure their models do whatever they want" This comment is skirting dangerously close to a violation of the comments policy. No comments of scientific malfeasance please. As well as breaking this forum's rules, it just demonstrates you have no rational argument to make. " I assume they got the value for the observed 0.1°C over 42 years in that 700-meter layer of ocean from a legitimate source." Ditto, my comment above. "The only place I see that happening is in the models." Note that the actual sea level rise is at the upper end of IPCC projections: "World temperatures have been on an upward trend for 120 years but the sea level trend during that time has remained relatively constant. It's on course for about 275 mm or less than a foot.'
So you didn't even bother to read the post you are commenting on? Did you not notice the graph in the post above?. Just to refresh:
"World temperatures have been on an upward trend for 120 years but the sea level trend during that time has remained relatively constant. It's on course for about 275 mm or less than a foot.'
So you didn't even bother to read the post you are commenting on? Did you not notice the graph in the post above?. Just to refresh:
 That steadily rising curve, that's an acceleration in the long-term rate of sea level rise. It doesn't mean sea level won't slow-down or speed-up on short timescales however.
-
Eric the Red at 07:20 AM on 19 July 2011Trenberth on Tracking Earth’s energy: A key to climate variability and change
Perseus, Two explanations: First, figure 4 is only plotted through 2009; the websites is current (make sure you are using a 12-month running mean for comparison). Second, the graph is not using a linear fit, but some other mathematical fit (polymeric maybe), and appears to be part of a longer trend which is not displayed on the graph. Be careful when using fitting on short term data. That is my take, FWIW. -
Eric (skeptic) at 06:43 AM on 19 July 2011It's the sun
Sphaerica, your first post didn't really address my concern because you turned the 11 years of increase into a shorter interval of high solar. Then your second post changed the topic to secular solar changes and I have no argument with it (they are small). In your third post you resumed the original topic but missed my point which is quite simple: there is an interval of 11 years in which the TSI forcing increases roughly the same amount as CO2 does during that same interval. It is then balanced by the next 11 years of decreasing TSI forcing. Dikran, you are suggsting that the earth has a different thermal intertia to TSI changes than to CO2 changes. I don't see how that can be true. Tom, regarding your statement "Second, the level of the forcing for changes in TSI and especially for the solar cycle are not large certainly not nearly the same size as the CO2 forcing" would make sense if it was simply appended with "in total" or "since preindustrial" or "ongoing long term". Then we would all be able to violently agree. -
Paul D at 06:41 AM on 19 July 2011China, From the Inside Out
UK DECC/DEFRA emissions factors for many types of transport can be downloaded for 2010: http://archive.defra.gov.uk/environment/business/reporting/pdf/101006-guidelines-ghg-conversion-factors-method-paper.pdf I'm not sure what will be produced for 2011 with the new coalition government. -
perseus at 06:41 AM on 19 July 2011Trenberth on Tracking Earth’s energy: A key to climate variability and change
Perhaps someone could explain this anomaly Under Figure 4 it states "The observed changes (lower panel; Trenberth and Fasullo 2010) show the 12-month running means of global mean surface temperature anomalies relative to 1901-2000 from NOAA (red (thin) and decadal (thick)) in °C (scale lower left)" Figure 4 shows only 0.1C change between 1993-2010, yet a linear regression through the monthly figures from NOAA ftp://ftp.ncdc.noaa.gov/pub/data/ano...1-2000mean.dat yields about 0.3C over this period. Are we using the same temperatures? -
Steve Case at 06:39 AM on 19 July 2011Sea level rise is exaggerated
"Your actual observations link was a link to method, not data"- That's being a little bit silly. Data is useless without analysis.
Analysis without any data is even more useless.
- The point was that your simplistic calculations bore [no] relationship to reality.
What doesn't bear any relationship to reality is the mismatch of claims within the IPCC's AR4.
So, is it reasonable or is it an exaggeration to project that the thermal component of sea level rise by 2100 might be over ten to nearly 20 times what it is today?
- Well climate modeling sure suggests an increase in the thermal component.
Climate modelers can most likely make sure their models do whatever they want.
- It's to do with the greater temperature rise expected this century.
We are over ten years into the century and certainly sea level is not demonstrating any positive change in trend. this graph

certainly doesn't and if you plot out the tide gage data from PSMSL you will find that the timeline over the last 120 is nearly as straight.
- Much more than the 20th century. Like this study for instance:
Note the inset portion, where the thermal component reaches 6mm per year by 2100.
The IPCC no doubt got their value for table 10.7 from such a study. I assume they got the value for the observed 0.1°C over 42 years in that 700-meter layer of ocean from a legitimate source.
I'm questioning whether or not it's reasonable that the empirical record described in the Chapter 5 Executive Summary of the AR4 could lead to the worst case projected outcome in table 10.7. If it's reasonable, then the annual rate of sea level rise, and it's claimed that it's mostly thermal expansion, has to change very dramatically in the next few years. The only place I see that happening is in the models. World temperatures have been on an upward trend for 120 years but the sea level trend during that time has remained relatively constant. It's on course for about 275 mm or less than a foot.
-
Rob Honeycutt at 06:26 AM on 19 July 2011China, From the Inside Out
Paul... Here is a better version of their data. -
Paul D at 06:22 AM on 19 July 2011China, From the Inside Out
Rob@8 and the chart. The walking and cycling bar is wrong. It is impossible to have zero carbon emissions. The fuel in these cases is additional food, footwear and clothes that probably wear out quicker. This has a carbon footprint. It will still be the smallest, but it won't be zero. Although a cycle has a carbon footprint, I think it will be offset against walking because cycling is more efficient. -
apiratelooksat50 at 06:20 AM on 19 July 2011Visions of the Arctic
Michael Sweet @ 40 You are correct that polar bears build up their fat reserves during the winter and live off that during the leaner times of summer. Basically a reverse of other bear species. However, I was referring to the mother and cubs. I should have been more clear. New mothers do drop up to 40% of their body weight over winter while in a state of hibernation. Once she emerges from the den in the spring, both her and her cubs need to gain weight. -
Paul D at 06:16 AM on 19 July 2011China, From the Inside Out
Travelling across water (oceans) is probably more efficient by air. I think the main problem is the convenience and low cost of air travel, which makes travelling to and from China easy. -
apiratelooksat50 at 06:11 AM on 19 July 2011Visions of the Arctic
Paul D @ 42 Our state Department of Natural Resources does not "control nature" as you put it. The DNR actually protects or Natural Resources from exploitation. As far as your statement: "'Nuisance wildlife control' - Humans are expanding and using more land, those pesky animals keep coming into our cities, we need to control them." Guess what? I agree with you! Except for the implication of controlling wildlife. In my mind if you build a house in cougar territory and a cougar eats your dog, then that's your fault - not the cougar. When I use the word control it is in the following manner. When bees, bats, snakes, etc... set up residence in someones home, we relocate them without harming in all cases possible. We also educate the public on the importance of creatures that are normally feared. I have had several clients that once we got the bats out of attic actually installed bathouses on the side of their house. Note: Just this past week I rescued two juvenile hawks that had run into tree trunks while learning to fly. These birds would most likely have died without human intervention. It's all in the language. -
Rob Honeycutt at 05:45 AM on 19 July 2011China, From the Inside Out
Here is a graphic that shows the relative carbon emissions per passenger mile of various forms of transportation.... [click] Per passenger mile airplane travel is not much different than automobiles. But everyone drives pretty much every day. The larger impact on the CO2 emissions is to address automobile transportation first. I think that's happening with the new EV's starting to hit the market. -
Rob Honeycutt at 05:30 AM on 19 July 2011China, From the Inside Out
Pierre... One solution would be to basically shut down all economies around the world and have everyone live like they do in Cambodia. I don't think that is a realistic option. Nor is it a necessary option. Addressing the crisis requires having a vibrant economy that can create the solutions necessary to reduce carbon emissions. Most of the technologies are already there and already proven. It's just a matter of building the economic incentives to implement them. This means, yes, we have to keep doing what we are doing right now while we shift to carbon free systems. Cutting back right now is very important. Cutting everything off would be a huge mistake. -
Rob Honeycutt at 05:25 AM on 19 July 2011China, From the Inside Out
Pierre... I knew that was coming. Yes, I think in general people should be flying less. We should be avoiding needless long distance travel. I do not believe that people should never travel. Currently all of aviation accounts for about 4% of total human carbon emissions. A large portion of that can be offset by switching, as China is doing, to high speed rail. Trans-oceanic travel is a different matter. The aviation industry is very engaged in the challenges of offsetting their carbon output by transitioning to biofuels. But that's going to take some time, likely over the next two decades. You say, "How is it possible, in 2011, to state that to address global warming will be crucial... at some future date?" I agree that today is the crucial moment but the fact is, on the whole, governments are not addressing climate change due to a highly motivated energy sector disinformation campaign. That is just the state of the world today. I would like us to be addressing the problem now by investing heavily in renewable energy and new forms of electrified transportation. It is depressing that it's going to take a much more blatant crisis to shift the course of humanity (or more specifically, the west) the right direction. I offer up this picture of China as a unique perspective of what is going on outside our western perspective. -
Pierre-Emmanuel Neurohr at 05:11 AM on 19 July 2011China, From the Inside Out
CBDunkerson, this is a standard answer that does not make sense for the climate system. The climate does not care whether we could do even worse than the current course. Sure, you could say planes are great because people could use private jets. But what counts is what the system can take without going beyond the tipping points. On a planet on which a minority of people (we in the "rich" countries) are already using way, way too much energy, you don't add insult to injury by tripling energy use for certain activities. Sometimes, simple arguments are not simplistic but true. -
CBDunkerson at 05:03 AM on 19 July 2011China, From the Inside Out
Pierre, if you don't have high speed rail people will take cars or airplanes... ergo, while high speed rail may be more energy intensive than regular rail it is less energy intensive than the modes of transportation which would actually be used in its place. -
Pierre-Emmanuel Neurohr at 04:57 AM on 19 July 2011China, From the Inside Out
Dear Mr Honeycutt, I find your article highly depressing. You do not seem to be aware of the most basic data re. greenhouse gas pollution. 1. “To travel to China on holiday or for business is one thing, and something I highly recommend to anyone who has the opportunity (...)”. There simply is no other machine that allows a human being to destroy more effectively the climate of the earth than a plane. For example, a Paris-Montreal flight pollutes with 2,5 t of CO2 in a few hours. For context, most scientists say we should not emit more than 1,5 t per person per year (all activities taken together, of course), and a Cambodian emits less than 400 kg... in a year. 2. “And that ain't all! Here is a map of all the high speed rail that is either built or under construction in China.” In order to have "usual" trains go from 150 km/h to 300 km/h, ie. in order to double speed, you must triple energy use. In 2011, to triple energy use to go from A to B, such a move seems highly irresponsible, to put it mildly. 3. “When it finally becomes crucial that humanity addresses global warming we in the west (...).” How is it possible, in 2011, to state that to address global warming will be crucial... at some future date? I read the rich information of your website, along other scientific sources, and such a statement seems at odds with the severity of today's situation. Yours. Pierre Neurohr -
Bob Lacatena at 04:34 AM on 19 July 2011It's the sun
Eric, Whoa! Lastly, I just noticed that you bumped the CO2 forcing down to only consider the change in forcing, i.e. in the increase during an 11 year period. But the CO2 forcings are cumulative, where the TSI changes are not. It's hardly a fair argument to compare 11 years of TSI changes (which net to zero!) to 11 years of CO2 changes which pile on top of decades of previous change in the value. Those are not the two values under discussion (11 year change in CO2 versus 11 year change in TSI, which itself is probably less than 0.0025 W/m2 anyway -- you have to measure the areas under the two curves to get a true number). -
Bob Lacatena at 04:14 AM on 19 July 2011It's the sun
Eric, Just to make it a little clearer, no net change in minima, and a net change in maxima of about 0.03 W/m2 i the past 33 years, would net out (since most of the time is spent in the basically unchanged ups and downs of the cycle) to probably an addtional 0.03 W/m2 for maybe 6 or 9 of those 33 years, or at best 1/4 of the time, meaning a net of 0.0075 W/m2... a completely inconsequential number. -
Rob Honeycutt at 04:10 AM on 19 July 2011China, From the Inside Out
Composer99... When I'm there I don't hear any skepticism over climate change. Here in the west we have large corporate interests who are actively trying to seed doubt about climate change. The same thing is just not happening in China. And even if it were it wouldn't matter because the government there is not popularly elected. In fact, I get the sense that there is somewhat of an adversarial relationship between the government and oil companies there. When I was there during the last oil price spike a really interesting dance was taking place. The central government sets the price of gas. But the oil companies couldn't make any money at the price the government set, but the government refused to raise the price of gas because the don't want to inhibit the growth rate of the economy. So, the oil companies' response was to just pump gas as slowly as possible until the price of oil went back down. You'd see these long lines of blue trucks waiting in line at the gas station for their turn to get gas. When the price of oil went down the lines disappeared. The general public in China seems to be less aware of climate change per se, though, but they are very much concerned about clean air, water and safe food. You also tend to find people are very interested in clean energy, likely because that fits well with those interests. -
Patrick 027 at 04:08 AM on 19 July 2011OA not OK part 6: Always take the weathering
PS the thermodynamic equilibria for various carbonate-silicate reations shown in fig 1 of http://www.pnas.org/content/98/7/3666.full "Initiation of clement surface conditions on the earliest Earth" N. H. Sleep, K. Zahnle, P. S. Neuhoff (not entirely on topic but it is related to chemical weathering) (PS note the temperature plotted as a function of atmospheric CO2 - I'm pretty sure this includes the effects of the faint young Sun.) C&P w/ formatting change, the reactions shown: 1. "leonhardite + albite + CO2 = calcite + paragonite + 4 quartz + 2.5 H2O" 2. "leonhardite + CO2 = calcite + kaolinite + 2 quartz + 1.5 H2O" 3. "clinochlore-14A + 5 calcite + 5 CO2 = 5 dolomite + kaolinite + quartz + 2 H2O" 4. "clinochlore-14A + 5 CO2 = 5 magnesite + kaolinite + quartz + 2 H2O" 5. "daphnite-14A + 5 CO2 = 5 siderite + kaolinite + quartz + 2H2O" 6. "2 albite + CO2 = 3 thermonatrite + kaolinite + 4 quartz " 7. "paragonite + CO2 + 5 H2O = thermonatrite + 3 kaolinite" mineral formulas given in table 1 http://www.pnas.org/content/98/7/3666/T1.expansion.html , and references are identified for thermodynamic data. -
Composer99 at 03:36 AM on 19 July 2011China, From the Inside Out
I wonder to what extent the Chinese social dialogue over climate change (if there is one) is saturated with skeptic/denialist positions & claims. -
adelady at 03:14 AM on 19 July 2011Monckton at odds with the very scientists he cites
Tom "What is transparently lacking is responsible media... This item isn't about climate change or any kind of science - but it's worth reading through your science-tinted glasses. It's a bit glum-making if you're hoping for higher journalistic standards.
Prev 1571 1572 1573 1574 1575 1576 1577 1578 1579 1580 1581 1582 1583 1584 1585 1586 Next


