


 Arguments


Recent Comments
Prev 1575 1576 1577 1578 1579 1580 1581 1582 1583 1584 1585 1586 1587 1588 1589 1590 Next
Comments 79101 to 79150:
-
Paul D at 18:33 PM on 16 July 2011Citizen Science: Climatology for Everyone
There are a number of UK yearly events. The RSPB - Big Garden Birdwatch: http://www.rspb.org.uk/birdwatch/ A new one is the Big Butterfly Count: http://www.bigbutterflycount.org/ -
scaddenp at 17:38 PM on 16 July 2011Monckton at odds with the very scientists he cites
I should add the the glacier and sealevel proxies have an issue with equilibrium. If I stand at the bottom of say our Tasman glacier, I can see the HCO mark well up the valley. However, unless the temperature actually drops sharply. most of it will melt anyway. Does the temperature need to rise for it to melt back to the HCO? I dont know. Similarly, if temperature stayed the same, would sealevel still rise by a metre? The temperature rise the HCO was much slower by comparison. Is there a better short-acting proxy for temperatures at the HCO? -
Doug Mackie at 17:11 PM on 16 July 2011Great Barrier Reef Part 3: Acidification, Warming, and Past Coral Survival
DLB@9: Of course you have a reference or other evidence for this hypothesis of yours? -
Doug Mackie at 17:07 PM on 16 July 2011OA not OK part 5: Reservoir dogs
It boots nothing for you to play word games like this. Come, give us some specific examples of your doubts. -
owl905 at 16:12 PM on 16 July 2011Why Wasn't The Hottest Decade Hotter?
The attempt to relate the claimed slower rate of warming in the 00's to the solar cycle has been debunked repeatedly. It can be statistically manipulated into apparent existence (Ricky Lintzen had the biggest float in that parade). Trouble is, these statistical evaluations don't match the observational evidence - heat-signature extremes and anomalies. There's a good scientific case for a warming booster from the aerosol decline in 90s (bye-bye USSR), and a masking effect from the ABC in the 00's ... but the notion that these 'x-year moving averages' from source subset du jour is 'the warming trend' is lame. Most of them would be altered if they didn't support the pre-determined conclusion. -
Tom Curtis at 16:05 PM on 16 July 2011Citizen Science: Climatology for Everyone
I don't know why you included Surfacestations.org, which is run in conjunction with WUWT. Although classifying the quality of surface stations is itself a worthwhile task, they classifying team a surfacestations.org have a demontrable bias. Taking one example, in a recent classification of Australian sites, they classified the Oodnadatta Airport site as "not rural". While a site located within Oodnadatta (pop 277) itself may have effected temperature readings due to the presence of a (singular) lawn and, no doubt, some air-conditioners, Oodnadatta Airport differs from the surrounding scrub solely in that some spinifex has been bulldozed to make three runways. The notion that it (or Ceduna Airport, or half a dozen other examples) should be classified as not rural is an absurdity. Consequently I consider their classification of most US stations as rating 3 or lower as being an expression of their bias rather than an objective analysis, and participation in their effort as a furtherance of pseudo-science.
-
Tom Curtis at 15:19 PM on 16 July 2011It's Pacific Decadal Oscillation
barry @86, I am not one of those who says that the "oscillatory" patterns just shift heat around. Indeed, ENSO does shift heat around, but it has too large an effect relative to its proportion of the globes surface area for that to be the case. What is more, its greatest effect on global temperatures is delayed by several months from its peak. Clearly ENSO has an additional effect beyond that of the heat shifting. Personally, I consider that to be evidence of a high, and positive climate feedback. When additional surface warmth in the tropical Pacific results in a greater global warming than can be accounted for just by the change in surface temperature involved, it is difficult to interpret it any other way. However, given a high climate feedback, and given the known variations in anthropogenic SO4, it is difficult to find room for variation left for the AMO or PDO to explain. Further, contrary to denier claims, the PDO has been decreasing in average strength since around 1985. That means that even if it has an effect, it may have contributed part of the rapid rise in temperature from 1975 to 1985, but it would have been reducing the rate of temperature increase since then. That there is little difference between the rates of increase between the two periods again suggests a minor influence of the PDO on global temperatures, if any: Response:
[DB] Fixed linked image (system didn't like that jpg).
-
barry1487 at 14:24 PM on 16 July 2011It's Pacific Decadal Oscillation
I am being mistaken for someone arguing about future climate states based on nominal multi-decadal oscillations. I assume this is a hangover from previous discussions on the PDO. Let me be clear: I am not proposing, or hoping to propose, a coming cooling period based on PDO-like indices. I was intrigued by Tamino's posts where he subtracts natural variations (solar, ENSO, volcanic) from the temp record, [Eg.], and how that impacts trends in the temp records. To restate: I am curious to know, with what confidence have the apparent decadal fluctuations of the PDO been ruled out as a low-frequency oscillation influencing global temperatures on decadal, rather than centennial, time scales.1)If the the PDO is just "a long term index related to ENSO", then its effect is completely included by including the effects of ENSO.
I'm not sure that "related to" = "is purely an artifact of". I appreciate conjecture, but am curious about the degree of confidence on this. Tamino has probably had a go at quantifying a possible relationship. I read an old post of his recently on the AMO, but that was more about long-term trends. I think my interest stems from the advice that apparent oscillatory ocean/atmosphere patterns (PDO/AMO etc) simply 'shift heat around'. I had thought this was also the case with ENSO. I'm 99.9% confident it's just a hole in my understanding - and this is a good place to remedy that. -
Camburn at 13:56 PM on 16 July 2011Climate's changed before
Tom@186: Thankfully, I didn't miss this one. I just havvve to read this. Thank you. -
Eric (skeptic) at 13:39 PM on 16 July 2011Climate's changed before
#184, how do you quantified the gravitational energy that you claim to be 200,000 times greater than solar energy? What units and what conversions? -
Tom Curtis at 13:38 PM on 16 July 2011Climate's changed before
I would like to see some of our resident deniers comment on DougCotton @184. -
Ari Jokimäki at 13:32 PM on 16 July 2011Citizen Science: Climatology for Everyone
I'd like to note that there's one aspect of citizen science that this post ignores: independently researching some issue and writing a peer-reviewed paper about it. There is a continuous (but not very numerous) stream of scientific papers published by laypeople in different branches of science, astronomy being one of the prime examples of that. There is a common misunderstanding that one needs to be "official scientist" before you are allowed to publish in scientific journals, but this is not true at least for most of the journals. One only needs to make the research, write a paper about it, and submit it to a journal for peer-review. -
DougCotton at 13:28 PM on 16 July 2011Climate's changed before
Yes, climate has changed before. When grapes were grown near the Scotish border in Roman times it was probably warmer than when I was there this time last year (in summer) experiencing winds so strong I could hardly open the car door. My arguments are far too detailed to repeat here - see them at http://earth-climate.com and at least note just two things ... (a) Consider the sound physical proof given there that solar insolation contributes a mean of less than 10 degrees whereas over 280 degrees K comes from heat coming through the surface from the core and the crust which warms the lower atmosphere we live in from absolute zero to above 280 deg.K, even at night. So the IPCC "theory" has only those 10 degrees to play with for a start. (b) All the available photons from the sun are already captured each day by water vapour and CO2 etc and there is surplus vapour and CO2 left over. Even what heat goes into the ground is lost again that night. (For example, hot sand on a beach cools at night.) You cannot create energy. Speaking as one who teaches Physics and has marked university assignments, I can assure you that the IPCC argument about this feedback leading to more warming each year is totally incorrect. All feedback only leads to temporary warming and I don't care if 70 odd "scientists" mostly in other disciplines seem to think energy can be created by extra CO2. It can't be. And it isn't. Equilibrium will be established at the level dictated (at least 96%) by the heat flow from the Earth which has natural long-term cyclic variations regulated by the planets by at least three mechanisms explained on my site. THAT is the reason there has been no increase in mean temperatures from Jan 2003 to July 2011 despite increased CO2. Get up to date here: http://earth-climate.com/2003-2011.jpg I welcome ANY discussion via my email address on the site, provided you indicate that you have read all that is there. -
Tom Curtis at 13:22 PM on 16 July 2011It's Pacific Decadal Oscillation
barry @84, 1) If the the PDO is just "a long term index related to ENSO", then its effect is completely included by including the effects of ENSO. 2) Further, evidence suggests that the ENSO pattern is changing, both in that neutral conditions are starting to resemble an unusual El Nino like state; and there is some evidence that with warmer conditions true El Nino like states become more frequent and stronger. Given that, if the PDO is related to ENSO, past fluctuations are not a guide to future behaviour, which can be expected to change. 3) Further, if the PDO is related to ENSO, and given the response of ENSO to a warming world, the correlation between the PDO and global temperatures is more likely a causal response of ENSO (and hence the PDO) to global temperature fluctuations than a causal response of global temperatures to fluctuations in the PDO. 4) This leaves aside the issue that evidence for an actual cyclical behaviour by the PDO and AMO are weak. Using the AMO as an example, Tamino tested the case for true periodicity and found it very weak. Often tests of statistical significance for such periodicity are based mathematically on the assumption that only one period is tested, whereas in fact many periods are tested. Allowing for this, Tamino shows the only significant period in the AMO as tested using the Greenland Icecore is around 6,500 years long. Given this, and given that we have no knowledge of the causal antecedents of the PDO, predictions of it future behaviour are simply guess work. -
_rand15_ at 12:51 PM on 16 July 2011Why Wasn't The Hottest Decade Hotter?
Those who like moving averages (I'm one, if they are done right) should remember that when you have a rising trend, a moving average carried out near the right hand end of the time series will tend to underestimate the underlying curve. That's because the moving average - no matter how you calculate it - cannot include the higher but currently non-existent values for times in the future. So the moving average tends to level off, or at least underestimate, a rising trend near the end of the data series. To smooth the last decade's worth of data - with an eye towards trying to establish a flatter trend - then, requires a smoothing window much shorter than a decade. But then it won't do much smoothing. Conversely, a 20 or 40 year window for a moving average won't respond much to changes in the last decade of data, except for some underestimation of a rising trend. So neither a short nor a long window can really speak to the possibility of a leveling off for the last decade. But it's possible that a comparison of short vs long averaging windows could detect a change in the behavior. I haven't tried this myself so far, but in the past I've read papers about detecting maneuvers of aircraft by comparing long and short time window averages of their radar signatures. This is possible because a maneuver changes the statistics of the (noisy) radar time series. IIRC (and it was a long time ago), you look at the variances of the data in the long and short windows. Maybe a similar technique could identify real changes in the temperature behavior. That would be interesting. -
Tom Curtis at 12:50 PM on 16 July 2011Great Barrier Reef Part 3: Acidification, Warming, and Past Coral Survival
DLB @9, you appear to be suggesting that the Great Barrier Reef will simply migrate to more southerly waters in the event of continued climate change. Nothing could be further from the truth. One feature which makes the Great Barrier Reef possible is the wide, shallow continental shelf of the coast of Queensland: As you can see, that wide continental shelf is absent south of Rockhampton, and the most southerly portions of the reef of Gladstone. Consequently, while a fringe reef may be possible in more southerly waters, it will not be a match to the Great Barrier Reef.
However, even the fringe reef is a dubious proposition. A feature of the East Australian coast up to Hervey Bay is the golden beaches, formed by sand carried north up the coast by surface currents and wave action. At the Spit on the Gold Coast, the sand is no longer carried in to the shore, but instead is deposited just of shore forming, first the Spit, then South and North Stradbroke Islands and finally Fraser Island (the later being clearly visible on the map above). The reason for this change of behaviour is that the line of the coast no longer runs North-North-East, but North, so it does not so strongly intercept the current. North of Fraser Island the coast runs North-North-West, carrying it away from the current so the sand is carried into the ocean.
Corals forming south of Fraser Island would intercept the surface current, and face continuous sedimentation by sand. Given that, it is dubious that they would prosper except in isolated in special circumstances (the north side of headlands, for example). So while some reefs and corals could survive the temperature increase by migrating south, they would not survive as a fringing reef, let alone as the equivalent of the great barrier reef.
All of this ignores the effect of ocean acidification which will stress the surviving corals, no matter how far south they "migrate".
As you can see, that wide continental shelf is absent south of Rockhampton, and the most southerly portions of the reef of Gladstone. Consequently, while a fringe reef may be possible in more southerly waters, it will not be a match to the Great Barrier Reef.
However, even the fringe reef is a dubious proposition. A feature of the East Australian coast up to Hervey Bay is the golden beaches, formed by sand carried north up the coast by surface currents and wave action. At the Spit on the Gold Coast, the sand is no longer carried in to the shore, but instead is deposited just of shore forming, first the Spit, then South and North Stradbroke Islands and finally Fraser Island (the later being clearly visible on the map above). The reason for this change of behaviour is that the line of the coast no longer runs North-North-East, but North, so it does not so strongly intercept the current. North of Fraser Island the coast runs North-North-West, carrying it away from the current so the sand is carried into the ocean.
Corals forming south of Fraser Island would intercept the surface current, and face continuous sedimentation by sand. Given that, it is dubious that they would prosper except in isolated in special circumstances (the north side of headlands, for example). So while some reefs and corals could survive the temperature increase by migrating south, they would not survive as a fringing reef, let alone as the equivalent of the great barrier reef.
All of this ignores the effect of ocean acidification which will stress the surviving corals, no matter how far south they "migrate".
-
barry1487 at 12:34 PM on 16 July 2011It's Pacific Decadal Oscillation
Scaddenp may be correct in that the PDO is just a long term index related to ENSO
Yes, it's been conjectured in the literature, but I'm not sure how that would undermine the proposition of a long-term temperature oscillation that adds its influence to global temperature fluctuations on decadal time-scales. Nor do I understand why causes matter. If we did not know the cause of the 11-year sun cycle, still we could still estimate its impact on global temperatures. Mid-centennial aerosol cooling is a strong contender for the phase shift for that period, but AFAIK, there is enough uncertainty to allow a non-anthropogenic source to be considered. I figure the consequence of a PDO-like signal (60-65yr oscillation, peaking around 1998) would be that the period of modern warming (from 1975) is not so indicative of an acceleration. What I'm now curious about is the confidence with which that can be ruled out. I'm reading some other papers on in, as well as the suggestions (thanks). http://www.metlink.org/pdf/articles/observed_climate_folland.pdf http://schraglab.unix.fas.harvard.edu/publications/CV32.pdf http://journals.ametsoc.org/doi/full/10.1175/1520-0442%281999%29012%3C2719%3AMVIGSS%3E2.0.CO%3B2 -
actually thoughtful at 12:18 PM on 16 July 2011Climate Solutions by dana1981
Mark Harrigan - you are falling for the "it can't be done" form of denial. I see you are informed on the issue, and that you think you have a valid point. Many climate change deniers are rational in other areas of their life (and I don't mean to disparage you by that comparison, just pointing out that understanding the problem does NOT inoculate you from misunderstanding the solution, as you have apparently done). Do I advocate running around and saying "climate change is solved!" - of course not. But can we say that we can achieve 50% reduction by 2050 with current and near-term technology? Absolutely! Thus we CAN solve climate change, we only lack the will. To say otherwise is to deny the solution (definitely a step up from denying the problem, but unfortunately an insidious opinion as it allows people an "out" - "oh, well I am just waiting for the technology...") - it is here now, every single entity (corporation, government, individual, business, etc) can achieve the the stated goals right now, with current technology and save money in the process. Do some research on this site - Dana1981 did a great post on Google's analysis of growing the economy by achieving CO2 reduction goals, plenty of roadmap style posts - see if you can refute any of them. It is unlikely. The best people have come up with "it can't be done because it hasn't been done yet" - see my last post regarding moon shots and Einstein's theory of relativity - or look around. Someone in your community is achieving massive carbon reductions right now. Or just review the comments or main post here - it is all here in black and white. We are at the point that all that is missing is the will - thus I reject your statement that it can't be done, or that by pointing out that it can be done we are somehow weakening our argument - this is simply nonsensical. Please do us all a favor and focus on the validity of my posts, and not your perception of the accuracy of my moniker. -
Rob Honeycutt at 11:52 AM on 16 July 20112010 - 2011: Earth's most extreme weather since 1816?
Norman... Can we ask where you are gathering your information? With Google I can prove that magnets cure arthritis and jet vapor trails are a plot to... do something nefarious. The idea is to identify solid research based on real science. -
Norman at 11:38 AM on 16 July 20112010 - 2011: Earth's most extreme weather since 1816?
Eric the Red @ 330 From Albatross post 328 "PS: I have no idea what compels people to think that climate science and complex issue such as severe storms are an open house to speculation and 'debunking'; that equipped with Google and their misguided and shallow understanding that the science and physics can be dimissed or overthrown." I have taken Albatross's criticism to heart and continued to study the issue and gain knowledge about the subject. The more I study the more it seems I may be correct in my view that the current warming scenerio, Poles warming faster than Equator would push weather away from severe storms. I am not sure you wish to discuss it further. If you do I can start adding links and some ideas. Let me know if you have any interest in this. -
DLB at 11:23 AM on 16 July 2011Great Barrier Reef Part 3: Acidification, Warming, and Past Coral Survival
Many of you seem to have the belief that The Barrier Reef is like a simple organism, so when it gets hot it will try and move away from the stress. The reality is probably more like the "peanut" chemical equation. At this moment there are probably small colonies of high temperature adapted coral just hanging on in the south. If the weather cools these colonies will probably decline, if the climate warms then they will flourish. It's just like the chemical equation, an environmental change will cause a rapid response to those species it favours. -
DLB at 10:42 AM on 16 July 2011OA not OK part 5: Reservoir dogs
What doubts do I have, plenty, nature often confounds theory. I look forward to learning more about OA with a critical mind of course. -
DSL at 10:30 AM on 16 July 2011Arctic sea ice has recovered
PIOMAS: record Arctic volume anomaly. Ouch.
Ouch.
-
NewYorkJ at 10:21 AM on 16 July 2011Why Wasn't The Hottest Decade Hotter?
Along the lines of #16 and #51, more decadal variability in global temperature presents deniers with more opportunities to put forth visually-appealing "step change" nonsense. Bob Carter Does his Business -
Tom Curtis at 10:16 AM on 16 July 2011Why Wasn't The Hottest Decade Hotter?
Eric the Red, what you have failed to show is that the flattening is in anyway significant. That seems highly unlikely given Tamino's graph shown on post post 46. -
Rob Painting at 10:07 AM on 16 July 2011Why Wasn't The Hottest Decade Hotter?
Chris G - "Though, I've all but given up on any turn of events, like repeated record losses of Arctic ice, serving as a wake-up call or stunning skeptics into accepting the reality of our situation." Me too. The media narrative will be on nations scrambling to exploit the Arctic's natural resources, with no mention of how it came to be that way. -
Doug Mackie at 09:07 AM on 16 July 2011OA not OK part 6: Always take the weathering
@JosHag: I am not trying to be flippant (when I am trying it is obvious). However, the very purpose of the Skeptical Science site and the purpose of this series of posts is to encourage people to think for themselves. A lot of what we have written so far does involve a little chemistry. We appreciate that not everyone has had this training so we have tried to keep it simple. However, this calculation involves no chemistry at all so we think it would be worthwhile having a go yourself. The calculation has been done carefully but in this case a first approximation or speherical cow calculation will give you an answer with the right order of magnitude. To do this calculation as a first approximation you need to know four things: 1) Equations 1 & 4 2) World annual river flow 3) World annual river bicarbonate concentration 4) Amount of carbon in the atmosphere. Have a go yourself and come back if you can't do it. -
Patrick 027 at 08:28 AM on 16 July 2011OA not OK part 6: Always take the weathering
... of course, if there were no weathering, CO2 would build up in the atmosphere and ocean, as higher CO2 partial pressure would increase the equilibrium C content of the ocean. So it would take longer than 3500 years for geologic emission at 0.2 Gt C /year to actually ~double atmospheric CO2. -
Patrick 027 at 08:25 AM on 16 July 2011OA not OK part 6: Always take the weathering
Re Composer99 - weathering also refers to the weathering of silicate rocks, such as CaSiO3. CO2 + CaSiO3 = CaCO3 + SiO2 (weathering + carbonate mineral formation, example of a net reaction) In intermediate steps additional CO2 can be taken up by the water which is then released upon formation of CaCO3, but the net reaction has a net uptake of CO2. This can balance geologic emission. Actually geologic emission includes some oxidation of organic C in rocks, and geologic sequestration includes some organic C burial. Meanwhile, carbonate minerals, so far as I know, become thermodynamically unstable at sufficiently high temperatures, and so their geological processing under some conditions should be able to feed the geologic emission of CO2. I think geologic emission may be somewhere around 0.2 Gt C per year, so this would replace an atmosphere's worth of CO2 in 3500 years if the atmosphere had 700 Gt of CO2. (I'm unsure about how much geologic emission is directly into the oceans, though, but that would still require some additional geochemical process in order for that CO2 to not be released into the air.) -
Eric the Red at 08:01 AM on 16 July 2011Why Wasn't The Hottest Decade Hotter?
Bibliovermis, I think you are getting closer. The average rate of change is 1.7 over the past 30 years (I assume your math is correct). The average rate of change from 2001-2005 is 3.2, the average rate of change from 2006-2010 is 0.3. See the difference? That is what is evident in Rob's plot. Yes, it all may be due to solar effects. If so, then warming will resume at its earlier rate when the sun picks up again. -
Composer99 at 06:57 AM on 16 July 2011OA not OK part 6: Always take the weathering
So calcification releases CO2 into the ocean (and eventually the atmosphere), while weathering removes CO2 from the atmosphere and eventually deposits it into the oceans. I assume these two processes occur at dissimilar rates, since volcanism also releases CO2 into the atmosphere, and the volcano-weathering interaction is Richard Alley's famous CO2 thermostat. -
Bibliovermis at 06:53 AM on 16 July 2011Why Wasn't The Hottest Decade Hotter?
Eric the Red, The goalpost has now been moved into the straw field. One's subtlety is another's well known & understood physical effect. Yes, the solar cycle does affect the climate. Using a 5 year moving average, the hottest 30 5-year-periods are the past 30; 1941-1945 is #31. The average rate of change over those 30 periods is +1.7. The last 10 periods have been the Top Ten; 1996-2000 is #12. Period Endpoint: Anomaly (change) 2007: 55.7 (+0.4) 2010: 55.5 (+0.1) 2009: 55.4 (+2.0) 2006: 55.3 (+1.5) 2005: 53.8 (+5.9) 2008: 53.4 (-2.3) 2004: 47.9 (+3.2) 2002: 44.9 (+3.4) 2003: 44.7 (-0.2) 2001: 41.5 (+3.8) 5 of those top ten had an above average change. -
Composer99 at 06:17 AM on 16 July 2011Why Wasn't The Hottest Decade Hotter?
Rob @ 48: Thanks for the clarification. I suspect I made an error of granularity regarding decadal anomaly vs annual. -
JosHagelaars at 04:11 AM on 16 July 2011OA not OK part 6: Always take the weathering
It turns out that amount of weathering is sufficient to remove all CO2 from the atmosphere in 3500 years. Faster than I expected given the amount of carbon in the atmosphere. Do you have a reference or a link regarding this calculation, so I could read more about it ? Is the Urey reaction treated in another post ? Thanks in advance. -
Chris G at 04:02 AM on 16 July 2011Why Wasn't The Hottest Decade Hotter?
Regarding Manktelow (2009), I would guess that there would be obfuscation of differences by latitude. Not only would circulation patterns, including Hadley cells, create differences in the altitudes reached by the particles, where aerosols in the the lower lats reach higher altitudes and have longer residence time, but lower latitudes receive more watts per square meter than higher latitudes. -
Eric the Red at 03:43 AM on 16 July 2011Why Wasn't The Hottest Decade Hotter?
Bibliovermis, See Rob's plot of the 5-year moving average. All the subtleties are lost on longer term averaging. The recent flattening may just be a repeat of the previous three. -
Chris G at 03:36 AM on 16 July 2011Why Wasn't The Hottest Decade Hotter?
I wish I had more to add, but almost all my thoughts have been covered by others. Sphaerica, FTIW, I share your fear at #16. If you view all the decade or less ups and downs as short-term deviations from a mean caused by short-term drivers, and the mean is moving upward, driven by the longer term increase in CO2, (A bit more than linearly, Eric, as has been discussed before, Monckton Myth #3: Linear Warming.), then, yes, once the short-term drivers have subsided, there will be a spike to return to the mean. Though, I've all but given up on any turn of events, like repeated record losses of Arctic ice, serving as a wake-up call or stunning skeptics into accepting the reality of our situation. -
Eric the Red at 03:32 AM on 16 July 2011Why Wasn't The Hottest Decade Hotter?
Rob, The effect of the solar cycle becomes quite evident with sunspot minima occurring aroudn 1976, 1986, and 1996. The recent minimum will not become apparent until warming resumes. Longer term effects would not be so evident on this time scale.Response:[DB] "until warming resumes"
Resumes from what? Some mythical slowdown? Perhaps you missed the warmest decade in the instrumental record, as Bibliovermis has kindly pointed out. Or 2010 being the warmest in the GISS record, followed closely by 2009. Or 2005. Yadayadayada.
Your narrative of cooling/no warming conveniently lacks any tie-in with reality. But I do give you kudos for determination to not stray from your agenda.
-
Bibliovermis at 03:26 AM on 16 July 2011Why Wasn't The Hottest Decade Hotter?
Eric the Red, Using a 10 year moving average, the hottest 28 decade-periods are the past 28; 1937-1946 is #29. The average rate of change over those 28 periods is +1.8. The last 10 years have been the Top Ten, in sequential order except for 2008. Period Endpoint: Anomaly (change) 2010: 54.6 (+3.0) 2009: 51.6 (+2.6) 2007: 50.3 (+1.9) 2008: 49.0 (-1.3) 2006: 48.4 (+2.6) 2005: 45.8 (+2.5) 2004: 43.2 (+2.4) 2003: 40.8 (+4.2) 2002: 36.6 (+4.4) 2001: 32.3 (+1.3) 8 of those top 10 had an above average change. How is that a slowdown? -
Rob Painting at 03:15 AM on 16 July 2011Why Wasn't The Hottest Decade Hotter?
Composer99 @ 44 - "Bibliovermis' post @40 shows that when you include the poles, warming is continuing largely unabated (per GISS)" 5 year running mean for the GISTEMP data.No dispute over long-term global warming, but shorter timescales are another matter. Even James Hansen, the head of NASA GISS, claims radiative forcing has declined in the last decade. See figure 1 in his paper Earth's Energy Imbalance and Implications
-
Eric the Red at 03:08 AM on 16 July 2011Why Wasn't The Hottest Decade Hotter?
THank you Tom, It appears that we think alike (sometimes). The moving average better shows the large increase that occurred in the 1990s and the slower increase of the 2000s. While I agree with Tamino that ENSO, solar, and aerosols have influenced temperatures of the past few decades, I am not comfortable endorsing his "adjusted temperatures" yet. A few reasons. First, I do not believe that they can be applied uniformly to each database, and secondly, additional work is definitely needed to firm up his corrections for each parameter. That said, I tend to agree that there has been a rather linear temperature increase since the late 19th century, which would probably become evident applying the above listed adjustments to the datasets. Although this will not end the discussion about natural variations, it will go a long way towards incorporating both natural and anthropogenic forces into the equation. -
Tom Curtis at 01:57 AM on 16 July 2011Why Wasn't The Hottest Decade Hotter?
Bibliovermis @40, I'm sure Eric the Red would want to point out that a running mean is a more accurate indicator. An 11 year running mean of GISStemp increases Using an 11 year running mean, the GISS temperature increases in every year since 1987, but the three years with the highest increases are 1998 (0.038 degrees C), 2000 (0.036) and 1999 (0.032). Comparing decadal means is approximately equivalent to comparing the decadal difference in the running mean for the middle year of each decade, and yields a suitably stark number. But it does not alter the fact that the peak rate of change of GISStemp global index was the late 1990's, and that it flattened to almost zero in 2004, before picking up to 0.028 degrees C (the fourth highest value in the last 50 years). The reason for that is interesting, and prior to 2008 I would have said it was almost entirely an artifact of the very high temperature in during 1997/8 El Nino. However, 2008 was a very cold year for the 2000's, and some additional explanation is called for. However, the combination of Asian industrial aerosols, ENSO and solar minimum seems more than adequate as an explanation. These factors undoubtedly had an effect. Causation does not simply cease to allow us to invoke alternative explanations (or oscillations). The question is whether additional explanation is needed. The fact that when Tamino adjusted five temperature series for ENSO, volcanic sulfates, and the solar cycle, he has such small residuals strongly suggests that no long term cycle is influencing temperatures. In particular, had such a cycle peaked circa 2005, we would expect a strong down turn in the adjusted temperatures, and no such down turn exists: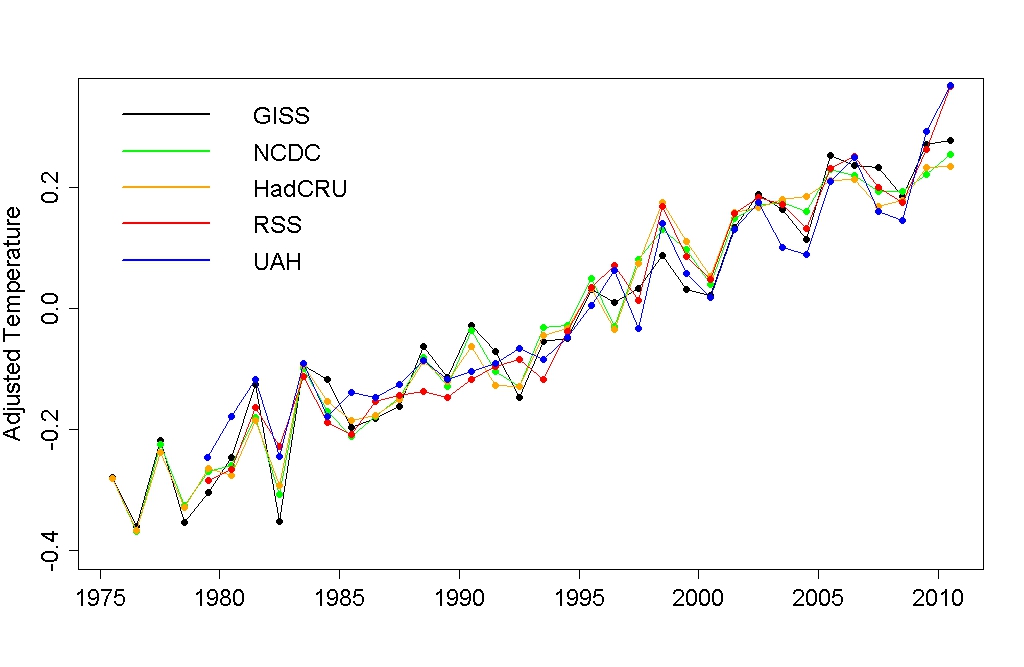 As Tamino says:
"Another interesting point is that in the adjusted data sets, all 5 sources have 2010 as the hottest year on record. In fact, 4 out of 5 (all but NCDC) also have 2009 as the 2nd-hottest year — quite the 1-2 punch. Of course all trends are statistically significant — strongly so. The conclusion is inescapable: the globe is warming, and shows absolutely no sign whatever of stopping or even slowing its warming. Any talk of “cooling” or even a “levelling off” of global warming over the last decade is absolute nonsense."
The apparent levelling of in the rate of temperature growth in GISS figures is purely noise due to the interplay of a strong El Nino and declining aerosol levels in 1997/8, and a strong La Nina, increasing aerosol levels and a solar minimum that almost recorded lower activity than that of 1910(?) in 2008. -
Albatross at 01:47 AM on 16 July 2011Why Wasn't The Hottest Decade Hotter?
With reference to Hansen et al. (2010) and GISTEMP. Below is the 132-month running mean (same as in their Fig. 21 except including data until May 2011):[Source: woodfortrees.org] Kaufmann et al. (2011) were interested in the possible causes of that small plateau in the green trace early in the 21st century. Interestingly, Koch et al. (2011) have just published paper on the radiative forcing of aerosols and found that the net direct forcing of aerosols is -0.41 W m-2. They also note that: "To test the climate responses to sulfate and BC pollution, two experiments were branched from 1970 that removed all pollution sulfate or BC. Averaged over 1970-2000, the respective radiative forcings relative to the full experiment were +0.3 and -0.3 W m-2; the average surface air temperature changes were +0.2° and -0.03°C. The small impact of BC reduction on surface temperature resulted from reduced stability and loss of low-level clouds." Koch et al's value is very close to the median value for direct aerosol forcing reported in the IPCC's 2007 report.
-
Composer99 at 01:45 AM on 16 July 2011Why Wasn't The Hottest Decade Hotter?
Given that the Hadley temps omit polar data, would it not be the case that an apparent slow-down in warming when reviewing the Hadley temperature record is simply an artifact of this omission? Bibliovermis' post @40 shows that when you include the poles, warming is continuing largely unabated (per GISS). Or is it the case that warming was expected to be even more severe in the late 'noughts, and papers like Kaufman 2011 are attempting to account for the less-than-expected severity? -
KR at 01:44 AM on 16 July 2011Why Wasn't The Hottest Decade Hotter?
Eric the Red Selecting your analysis to fit your hypothesis is an odd form of Inductive Logic (as defined in the 1986 classic Science Made Stupid): Cherry picking, and not a good approach. Your analysis method should be driven by proper statistics, not best-fitting to a conclusion.
---
"Once, when the secrets of science were the jealously guarded property of a small priesthood, the common man had no hope of mastering their arcane complexities. Years of study in musty classrooms were prerequisite to obtaining even a dim, incoherent knowledge of science.
Today, all that has changed: a dim, incoherent knowledge of science is available to anyone... Indeed, today a myriad of sources are available to explain science facts that science itself has never dreamed of." SmS 2986
Cherry picking, and not a good approach. Your analysis method should be driven by proper statistics, not best-fitting to a conclusion.
---
"Once, when the secrets of science were the jealously guarded property of a small priesthood, the common man had no hope of mastering their arcane complexities. Years of study in musty classrooms were prerequisite to obtaining even a dim, incoherent knowledge of science.
Today, all that has changed: a dim, incoherent knowledge of science is available to anyone... Indeed, today a myriad of sources are available to explain science facts that science itself has never dreamed of." SmS 2986
-
guinganbresil at 01:33 AM on 16 July 2011Trenberth on Tracking Earth’s energy: A key to climate variability and change
Ken Lambert #60 I apologize if I misunderstood you - I thought you were comparing the clear sky EBAF plot in figure 3 (at ~ 1 W/m2) to the total energy imbalance which is estimated by models to be 0.9 W/m2 I have noticed that there is an abundance of Fallacy of Composition regarding energy balance, and emission spectra: - Just because the emission to space at the CO2 band of the spectrum (left hand side of figure below at ~600-700 cm-1) goes down does not mean the the total emission to space goes down.
Figure: Observed difference between 1970 to 1996 over the central Pacific (top). Simulated difference over the central Pacific (middle). Observed difference for 'near-global' - 60°N to 60°S (bottom) (Harries 2001). - Just because the emission to space from clear skies goes down does not mean that the total emission to space goes down. The figure above shows only clear skies... We need to be precise about this...Response:[DB] Fixed unclosed italic tag.
-
Eric the Red at 01:25 AM on 16 July 2011Why Wasn't The Hottest Decade Hotter?
Bibliovermas, Instead of calculating based on 10-year averages, why not use a moving average? Since the 5-yr moving average turning poistive in 1978, it has show large and small rise roughly in line with the solar cycle. The largest increase was in 2003, and it has been declining since. It may be nothing more than a response to the changing sun, similar to previous sunspot lows. Using a decadal average, you are showing the increase that occurred in the previous decade, the 1990s, not the 2000s.Moderator Response: [Dikran Marsupial] Choosing the form of analysis to get the result you are looking for is a form of cherry picking. Decide what form of analysis is required before looking at the details of the data. -
Tom Curtis at 01:16 AM on 16 July 2011It's the sun
Eric (skeptic) @869, we do not need to determine the change in incoming energy from a solar minimum by plotting atmospheric temperatures. We can, and do, measure it directly. Consequently we can come to conclusions about its effects on atmospheric temperatures, although the uncertainties are large. -
Composer99 at 01:11 AM on 16 July 2011Monckton at odds with the very scientists he cites
I agree with rpauli to some extent. Certainly, there is no need to be rude or offensive when speaking of people actively trying to prevent policy action on climate change, people such as Monckton. However, there is no reason not to be forthright. The evidence suggests he is engaging in systematic, deliberate misrepresentation of climate science, and if he is not ignored then it is sensible to call him out on it. -
Leland Palmer at 01:08 AM on 16 July 2011Thinning on top and bulging at the waist: symptoms of an ailing planet
I've wondered about this movement of mass from the poles to the equator, and due to conservation of angular momentum, it seems likely that the rotation of the earth will slow, somewhat. More importantly, though, how will the stresses due to conservation of angular momentum be transmitted from the oceans and crust to the mantle and core? Could we be triggering a geomagnetic reversal, changing the relative rotation rates of the mantle and core? Googling around, I found this old paper by Berkeley's controversial Richard Muller, unfortunately hidden behind a pay wall: http://www.agu.org/pubs/crossref/1986/GL013i011p01177.shtmlThe impact of a large extraterrestrial object on the Earth can produce a geomagnetic reversal through the following mechanism: dust from the impact crater and soot from fires trigger a climate change and the beginning of a little ice age. The redistribution of water near the equator to ice at high latitudes alters the rotation rate of the crust and mantle of the Earth. If the sea‐level change is sufficiently large (>10 meters) and rapid (in a few hundred years), then the velocity shear in the liquid core disrupts the convective cells that drive the dynamo. The new convective cells that subsequently form distort and tangle the previous field, reducing the dipole component near to zero while increasing the energy in multipole components. Eventually a dipole is rebuilt by dynamo action, and the event is seen either as a geomagnetic reversal or as an excursion.
What we're doing by AGW is rapidly shifting mass from the poles to the equator, the opposite of Muller's hypothesis, which shifts mass rapidly from the equatorial regions to the poles. But the geomagnetic disruption due to conservation of angular momentum may be the same in each case.
Prev 1575 1576 1577 1578 1579 1580 1581 1582 1583 1584 1585 1586 1587 1588 1589 1590 Next


