


 Arguments


Recent Comments
Prev 1581 1582 1583 1584 1585 1586 1587 1588 1589 1590 1591 1592 1593 1594 1595 1596 Next
Comments 79401 to 79450:
-
DSL at 11:33 AM on 13 July 2011Visions of the Arctic
Pirate, you're right: the use of polar bears as a poster child for GW is intended to strike an emotional chord in the minds of hundreds of millions, perhaps billions, of casual trackers of the GW issue. So what? You're pointing it out is also a rhetorical move, designed to suggest that those who are concerned are willing to use emotional plugs to forward the issue. Again, so what? Anything that gets people involved and looking at the science is fine by me, though I doubt if I'll miss polar bears all that much when they're gone. It won't be the species I'll be sad about; it will be the total disregard that many of seem to have not just for other species but other individual instances of our own species. This whole "hey, polar bears will still be able to survive" smacks of elitism. It sounds like "hey, so people will be displaced. They'll easily migrate." -
Bern at 11:24 AM on 13 July 2011What we know and what we don't know
Back on-topic: I've used just this approach when arguing climate change with some denier friends. Lay out the incontrovertible scientific facts (i.e. that which is know to a very high degree of certainty), and let them draw their own conclusions. While I'm not sure they've entirely abandoned their denier ways, they at least don't try to persuade me that I'm wrong about the basics of climate change any more... :-) -
apiratelooksat50 at 10:53 AM on 13 July 2011Visions of the Arctic
KR @ 12 If the other species aren't in "potential" danger (and they would be mainly prey species) due to the various issues trotted out in the links: then why are the polar bears? The opening post was clearly written to garner an emotional response. Emotions should be reserved for children and puppies, not science. There is nothing scientifically based in that article. If you read it carefully you will see phrases like "in my mind" and "I am beginning to wonder if this carcass is a blessing or a curse for the bears." The paragraph after the picture of the mother and cubs leaping from floe to floe is written in the words of an artist, not a scientist. All bears are notoriuos scavengers. Why do you think people camping in bear territory have to take special precautions with their food and garbage? The author states that he has seen bears eating seaweed - implying that is abnormal. Nothing new there. Polar bears are certinaly the most carnivorous of bears, but will eat everything from their favorite food seal; to walrus, caribou, beached whales, grass, and seaweed. A beached whale is a calorical bonanza for polar bears (and any other scavenger). No wonder they fight over it. And, the most glaring error in the article is that the author states polar bears build up fat in the winter. What!?! The author is an artist (and a good one), not a scientist. -
KR at 10:30 AM on 13 July 2011Visions of the Arctic
apiratelooksat50 - I don't believe other marine mammal populations (my, what a limited example) are in danger from climate change or non-predation issues. Multiple researchers, as per the various links presented so far, indicate that polar bears are at risk due to climate change. Brown bears certainly aren't, but that doesn't relieve the risk to a significant and morphologically distinct population of polar bears who inhabit completely distinct ecological niches. Moreover - that does not mean you didn't completely misread the opening post.Response:[DB] In the spirit of not reading or misreading posts on Polar Bears, here are a few more with even more, regrettably, scientific information:
-
scaddenp at 10:25 AM on 13 July 2011Trenberth on Tracking Earth’s energy: A key to climate variability and change
The matter should be resolved by data within the decade. I personally dont think they are too far apart. -
scaddenp at 10:22 AM on 13 July 2011The Medieval Warm(ish) Period In Pictures
Let's try another tack. Sealevel and glaciers are long term integrators of climate change. There is numerous lines of evidence showing MCA was not as warm as today. So where is the evidence that shows glaciers retreated further during MCA than now; or that sealevel during MCA was higher than now? Ie if you are going to hypothesize that MCA was a warm if not warmer than today, then show us the proof in those long term integrators. -
apiratelooksat50 at 10:19 AM on 13 July 2011Visions of the Arctic
KR at 7 Polar bears separated from their very close cousins, brown bears, about 150,000 years ago due to ecological changes. The divergence was "completed" during the Pleistocene which was a period of heavy glaciation. Ironically, brown bears and polar bears can still interbreed and do so in the wild which shows they may only be sub-species. Polar bears show signficant adaptations to a maritime environment. If that environment changes then they must adapt again, or die. Polar bear populations have fluctuated many times in the past and are quite robust presently. Any hint of their eminent demise is merely a prediction based on modeling. Don't misunderstand me - I like polar bears and want them to live forever. Are other marine mammal populations in scientifically documented danger (not predictions!) from sources other than human predation? -
muoncounter at 10:07 AM on 13 July 2011The Medieval Warm(ish) Period In Pictures
Camburn#43: "One has to take the MWP in context to understand it." Very well put, sir. Figure 1 of this post provides just such context. It makes the 'MWP' look more like a couple of MWS (Medieval Warm Spots). Some credible warming along the SE coast of Greenland, the southern US and little else besides a couple of tepid patches of ocean. Surely you aren't saying that dull yellow 0.1-0.3 degree anomaly is the real thing? -
apiratelooksat50 at 10:02 AM on 13 July 2011Visions of the Arctic
Dana 1981 at 4 You are right. The photographer is making an emotional (not scientific) statement. But, by putting that paragraph directly ahead of the picture he is looking for an emotional response from the reader without actually saying what the picture represents in reality. My apologies. -
apiratelooksat50 at 09:57 AM on 13 July 2011Visions of the Arctic
PM @ 3 Thanks for the links. I went through them quickly and intend to spend some more time on them. Without further examination, I would like to point out that cannibalism among bears (especially males to young) is well documented. That is why females are so dangerous to be around while they have cubs. It's very easy to make a statement that climate change is causing an increase in cannibalism, but it is a different matter entirely to prove it. Seriously, thanks for the links. -
muoncounter at 09:44 AM on 13 July 2011Visions of the Arctic
From Peru#6 "I am skeptical that Polar Bears are in danger." You're right to be skeptical, but here is what the science seems to say. Regehr et al 2010 Survival and breeding of polar bears in the southern Beaufort Sea in relation to sea ice: polar bear survival declined with an increasing number of days per year that waters over the continental shelf were ice free. In 2001-2003, the ice-free period was relatively short (mean 101 days) and adult female survival was high (0.96-0.99, depending on reproductive state). In 2004 and 2005, the ice-free period was longer (mean 135 days) and adult female survival was low (0.73-0.79, depending on reproductive state). I don't know whether that means endangerment or not, but anyone can see what happens if you forecast forward with even more ice free days (the full paper is here; the graph of concern (figure 4) is logistic. 100 days good, 135 days not so good, 155 days verry bad). Perhaps the perceived fate of Hudson's Bay bears depends on who you read. Compare a report of actual research, For Hudson Bay Polar Bears, The End is Already in Sight to a blogger's more jaundiced viewpoint. I'm more skeptical of one of these than the other. -
Camburn at 09:43 AM on 13 July 2011The Medieval Warm(ish) Period In Pictures
One has to take the MWP in context to understand it. We all know that there are places on earth that have not warmed as much as the rest of the earth. Continental USA is one of those places. There are always various cold/hot spots. The evidence of a MWP over climatic times is quit evident. The extent of the warmth is what is in question. We do know that the proxy data from the Sarasota sea shows that area has not warmed to the same level as during the MWP. Does this mean the whole world was as warm? I doubt it, and proxy data would not confirm this. Do we know there were areas that were warmer than present temps?.....Yes, the proxy data confirms this as well.Response:[DB] BTW, it's usually called the Sargasso Sea.
-
KR at 09:19 AM on 13 July 2011Visions of the Arctic
apiratelooksat50 - I'm appalled. You have completely misread the piece. Clearly Schulz was speaking of a mental image of a future where the Artic has no ice (not the present), using a photo of a swimming bear with no visible ice to illustrate that mental image. A future, a "final year", where the bears have no sea ice to fish from, no place to go for seals but hundreds of miles of open water, and a future where they will quite frankly starve. Your objection reeks of denial. -
KR at 09:10 AM on 13 July 2011A Detailed Look at Renewable Baseload Energy
Thank you, BBD, the feedback is greatly appreciated. -
From Peru at 08:58 AM on 13 July 2011Visions of the Arctic
There is a thing that make me doubt that of Arctic sea ice meltdowm will put Polar Bears in danger of extinction is the fact that Hudson Bay is populated by polar bears despite the fact that every summer the sea ice there melts completely, resulting in 100% open water. If bears that live in Hudson Bay can survive and thrive with just a seasonal sea cover, then why their Russian comrades cannot survive a change from perennial to seasonal sea ice cover? So I am skeptical that Polar Bears are in danger. On the contrary, I am near certain that the ones that are in danger because of Arctic meltdown are a species known as Homo "Sapiens Sapiens", because a change from perennial to seasonal sea ice cover in the Arctic will severely disrupt global climate. -
muoncounter at 08:51 AM on 13 July 2011Visions of the Arctic
Pirate#4, As usual, a moment with the Google machine yields the story of yet another polar bear: What a scientist called the "ordeal" of Bear 20741 was documented in the journal Polar Biology, and while it may not have been unprecedented -- shrinking Arctic ice has led to frequent reports not only of long-distance swims, but even cannibalism -- the study provided some of the best documentation to date of the real-world conditions of a polar bear on a warming planet. Is it really that much easier to react with the usual 'no its not'? -
apiratelooksat50 at 08:34 AM on 13 July 2011Visions of the Arctic
DB: Can you or anyone else, other than the photographer (if he is willing), legitimately say that polar bear in that picture is in legitimate duress? I have a MS degree in Fisheries and Wildlife Biology. I am not denying anything. I can tell you for sure that polar bears swimming in open ocean is normal. DB, do you know how far that bear was swimming? Do you know how far apart his meals were? Or, are you emotionally reacting to a "snapshot" and a tagline? The prepoderance of evidence of polar bear biology and behavior says that picture is normal. What proof is there that that picture shows anything remotely abnormal?Response:[dana1981] Please read the article more carefully. The author is not claimng that the polar bear in the picture is in distress. He's talking about 'an image in his mind' of the inevitable day in the future when the Arctic is almost entirely ice free, and polar bears experience the consequences.
-
PM at 08:19 AM on 13 July 2011Visions of the Arctic
Apirate There are plenty of studies showing the risks that polar bears,other wildlife and their environment face. I would suggest reading the following links: http://www.nature.com/ncomms/journal/v2/n2/full/ncomms1183.html http://www.usgs.gov/blogs/features/2011/03/28/species-at-risk/ http://www.amap.no/swipa/ -
Rob Painting at 07:58 AM on 13 July 2011Trenberth on Tracking Earth’s energy: A key to climate variability and change
Eric (Skeptic) @ 25 - I've been thinking along the same lines. The year-to-year variability in OHC is large, even in the ARGO data,, too large to accommodate the small rise in air temperatures we observe during El Nino. So what's happening to that heat?, is it being lost to space as Katmsan and Oldenburgh (2011) suggest? -
BBD at 07:49 AM on 13 July 2011A Detailed Look at Renewable Baseload Energy
Thanks to Tom and KR for sticking with the LAGI discussion and - eventually - breaching my mental log-jam. The moderators have been patient too, which I appreciate. -
muoncounter at 07:41 AM on 13 July 2011The Medieval Warm(ish) Period In Pictures
scaddenp#41: "timing and strength depend on WHERE the proxies come from" A proxy here, a proxy there; soon you're talkin' real data. Another location analyzed: Cronin et al 2003, with comparison to the venerable Sargasso Sea data. If the Chesapeake record for the period 450–1000 AD is viewed as a baseline for comparison to 19th and 20th century temperatures in lieu of pre-1000 AD atmospheric records, then the magnitude of recent Chesapeake temperature extremes are larger than those observed even during the relative warmth 1000–1500 years ago. Although this result may be partially due to greater sampling resolution in the last two centuries, it is nonetheless consistent with evidence from other studies suggesting that recent decadal climate variability in the North Atlantic region is extreme relative to long-term patterns and may be in part anthropogenic in origin. -- emphasis added And there's that pesky consistency of the evidence again. I guess it's easy to object to one data point and pretend the rest don't exist. -
apiratelooksat50 at 07:38 AM on 13 July 2011Visions of the Arctic
That polar bear is no more swimming for his life than I was this morning at the local YMCA. Polar bears are marine mammals and routinely swim many miles in open ocean. Sure, the pictures are great, but unless the photographer can provide a picture of that bear drowning, or struggling to make it to ice/land and exhaustingly hauling itself out to barely survive - then his statement is unsupported. Polar bears have been observed swimming many dozens of miles from shore with no duress. It would be interesting to see a larger scale view of that picture.Response:[DB] Thank you for providing an object lesson of the denialist mentality. It would be interesting if a dissembler were to even once see the "larger scale view" without the veils of confirmation bias blinding their eyes.
And what is said polar bear to do when those "many miles" become many hundreds of miles? When meals become weeks and months apart?
Your position is impoverished of merit.
-
muoncounter at 07:14 AM on 13 July 2011What we know and what we don't know
ETR#17: "I am looking at the whole data, that is why I can see the changes." That's interesting; perhaps you have some graphics of the 'whole data' you'd like to share. Do you take MLO all the way back to 1958? Have you included other long life monitoring locations, such as Barrow or Summit? Have you observed how well 'excess' CO2 concentrations (measured ppm above the global average) correlates with local human activity (traffic, seasonal heating, etc) down to the weekly time scale? Oh, and for the 'whole data,' do you include Law Dome CO2? "People here have been ignoring that which is inconvenient." That's just flat incorrect, almost to the point of being funny. Anything with the word 'inconvenient' in it these days is always a good laugh line. "Looking at the plot as a whole, the declining slope in the CO2 increase becomes evident." No, go back to the graph DB posted at #7 and let's play 'find the declining slope.' The game starts when you fit lines with slopes of 0.5 ppm/yr, 0.75 ppm/yr, 1 ppm/yr, 1.25 ppm/yr, 1.5 ppm/yr, etc. beginning at 315 ppm in 1958. Then let's talk about 'declining slopes.' -
scaddenp at 06:40 AM on 13 July 2011The Medieval Warm(ish) Period In Pictures
No, Eric, timing and strength depend on WHERE the proxies come from - hence the preferred name of MCA. Not a simultaneous global warm period. Also, to the idea that MCA was warmer than now if only you used proxies, well there are a couple of rather important proxies to consider. One is sealevel - where is the evidence of global sea level higher in MCA? The other is glacier. How come glacial retreat worldwide is exposing rock that hasnt seen light of day for 1000 or more years? -
John Hartz at 06:23 AM on 13 July 2011Trenberth on Tracking Earth’s energy: A key to climate variability and change
Suggest that John Cook invite Dr James Hansen to do a guest post about his views on the "missing heat." -
Riccardo at 06:17 AM on 13 July 2011Visions of the Arctic
Nice story and great pictures. Thank you. -
KR at 05:44 AM on 13 July 2011What we know and what we don't know
Eric the Red - I strongly suggest you take this up with Tamino (links here, from Albatross). He has rigorously demonstrated a statistically significant greater than exponential growth in CO2. Cherry-picking single years, as you suggest, isn't science - it's denial. I will note that Tamino is somewhat, er, less accommodating of unacknowledged dyscalculia than most people here. -
Eric the Red at 05:35 AM on 13 July 2011What we know and what we don't know
Tom, Based on your previous post, would you expect less than linear growth this year due to the strong La Nina? Even with the strong increase in emissions, the rate of CO2 increase is decelerating. I am looking at the whole data, that is why I can see the changes. People here have been ignoring that which is inconvenient. Look at your last plot. Would you choose 1998 as your starting point? No, that would be obviously cherry picking. Looking at the plot as a whole, the declining slope in the CO2 increase becomes evident.Moderator Response: [Dikran Marsupial] I am going to drop out of this discussion at this point. Albatross has provided you with links to analyses performed by Tamino that show statistically significant evidence that the rise is non linear. Please go and review the evidence that Tamino has provided; and if you can find a methodological fault in his work then do tell us about it. However, unless you can do that, I suggest this minor issue be considered off-topic for this particular article. -
muoncounter at 05:22 AM on 13 July 2011The Medieval Warm(ish) Period In Pictures
scaddenp#22: "That said, I think Eric is onto a rich vein of denial memes" 'Warmer weather is good for glaciers' should have an especially good run. Our current warming must therefore be the teaser for the upcoming fourth Ice Age, which is scheduled for worldwide release in July 2012. Manny, Diego, and Sid - embark upon their greatest adventure after cataclysm sets an entire continent drift. Separated from the rest of the herd, they use an iceberg as a makeshift ship, which launches them on an epic seafaring quest. ... as they encounter exotic sea creatures, explore a brave new world, and battle ruthless pirates. -
KR at 05:18 AM on 13 July 2011A Detailed Look at Renewable Baseload Energy
Oh, in my previous post I should note that the 4 W/m^2 power density is for a 1000 kWh/yr site with 12% efficient cells - using current technology in a far from ideal location. Using 30% efficient CSP in a 2000 kWh/yr site (>230 Wh/m^2 average from MacKay, not the 200 BBD introduced), such as in the tropics, or even 20% efficient PV, the power density for solar will easily exceed strip-mined coal land use power density over a 30 year run. And coal, as we all know (as with all fossil fuels), is a limited resource... Again - area used does not hold up as an objection to solar power. May we now move on to other things? -
Tom Curtis at 05:12 AM on 13 July 2011What we know and what we don't know
Eric the Red @15, the last few years have shown a lower than usual growth in CO2 content because: 1) There was a decline in emissions in 2008 related to the Global Financial Crisis: 2) There was an increase in oceanic absorption of CO2, particularly in 2008, because of a strong La Nina.
Despite this the trend in the growth of CO2 concentration was positive over the period 2005-2009 (the last year in Tamino's analysis):
2) There was an increase in oceanic absorption of CO2, particularly in 2008, because of a strong La Nina.
Despite this the trend in the growth of CO2 concentration was positive over the period 2005-2009 (the last year in Tamino's analysis):
 Let me emphasise that, even with the Global Financial Crisis and the coolest global temperatures in a decade, growth in CO2 concentrations was greater than linear. So unless you are projecting the GFK as the new economic norm, and 2008 temperatures or less as a constant feature for the coming decades, the last few years have had unusually low growth in CO2 concentrations relative to normal conditions.
If, instead of cherry picking aberrant conditions for your projections, you take the whole of the data, we can expect continued faster than exponential growth unless serious measures are taken to restrict emissions.
Let me emphasise that, even with the Global Financial Crisis and the coolest global temperatures in a decade, growth in CO2 concentrations was greater than linear. So unless you are projecting the GFK as the new economic norm, and 2008 temperatures or less as a constant feature for the coming decades, the last few years have had unusually low growth in CO2 concentrations relative to normal conditions.
If, instead of cherry picking aberrant conditions for your projections, you take the whole of the data, we can expect continued faster than exponential growth unless serious measures are taken to restrict emissions.
-
KR at 04:58 AM on 13 July 2011A Detailed Look at Renewable Baseload Energy
There was a reference, Vaclav Smil 2010, along the way in this discussion, claiming that the power density of the Waldpolenz Solar Park (also mentioned along the way) was only just above 4 W/m^2, due to fill factor, inefficiencies, etc., and arguing that this was a reason not to go with renewable sources. This power density does turn out to be accurate. As a numbers check against the earlier LAGI discussion: Waldpolenz occupies 110 hectares, using 12% efficient cells, and generates ~40,000 MWh per year. 4*10^7 kWh/year, divided by 1.1*10^6 meters, comes out to about 36 kWh/m^2 per year. Divide that by the cell efficiency, 12%, and you see collectors are intercepting 303 kWh/yr, converting 12% as an end product. There may or may not be a factor of 0.85 in DC/AC conversion in this, meaning that the panels would be intercepting 356 kWh/yr. Insolation in Germany is about 1000 kWh/yr, meaning that for fixed PV panels the Waldpolenz effective fill factor, the sunlight intercepted, is >= 30% of total sunlight available. A scaling factor of ~3 is therefore quite reasonable between collector area and plant area - even for simple fixed PV panels.
---
Smil then compares this power density to that of coal - but only from deep mines, with 20T/m^2, leading to a power density per year of 2.5-4.8 kW/m^2. Strip mines (New Mexico figures) have a best case density of ~2T/m^2, which puts the power density in the 250-480 W/m^2 range per year.
So - in terms of land use, coal from deep mines (limited/expensive) is much more concentrated, but over a 30 year power production run, strip mines (the current preference) have an energy density of 8-16 W/m^2, only 2x-4x that of a 30 year solar power plant. And that coal land can never be used for coal production again - it's once through only.
Area used is just not a good argument against solar power.
A scaling factor of ~3 is therefore quite reasonable between collector area and plant area - even for simple fixed PV panels.
---
Smil then compares this power density to that of coal - but only from deep mines, with 20T/m^2, leading to a power density per year of 2.5-4.8 kW/m^2. Strip mines (New Mexico figures) have a best case density of ~2T/m^2, which puts the power density in the 250-480 W/m^2 range per year.
So - in terms of land use, coal from deep mines (limited/expensive) is much more concentrated, but over a 30 year power production run, strip mines (the current preference) have an energy density of 8-16 W/m^2, only 2x-4x that of a 30 year solar power plant. And that coal land can never be used for coal production again - it's once through only.
Area used is just not a good argument against solar power.
-
CBDunkerson at 04:55 AM on 13 July 2011A Detailed Look at Renewable Baseload Energy
Yeah, it is amazing that the 'land area' arguments against renewable power keep popping up... despite countless real world examples of dual purposing land so that wind power uses very little 'extra' space and solar power uses none. Solar panels are going up on the roofs of tons of large buildings across the United States: malls, warehouses, schools, et cetera. Some of these actually generate more power than they use and thus are not only decreasing their own future power bills, but becoming power plants for neighboring consumers. Large parking lots are another area currently seeing alot of solar development. I suspect that within a few decades it will be more common than not for these type of large structures to be solar covered. It just makes sense to profit from 'sunlight resources' on property which is already needed for other purposes. -
Dikran Marsupial at 04:52 AM on 13 July 2011What we know and what we don't know
Eric the Red You do realise the 1975 start date is a cherry pick? You have obviously chosen the start point to maximise the evidence for your hypothesis. Can I suggest that we abandon this topic of conversation. Eric seems to have quite neatly derailed the discussion of the topic of the article with pointless quibbling about whether the growth of atmospheric CO2 is exponential or linear, despite the fact that Tamino has already covered this with a much more solid analysis than Eric's (it even includes a test for statistical significance - take note Eric). -
BBD at 04:50 AM on 13 July 2011A Detailed Look at Renewable Baseload Energy
KR It all boils down to which numbers you use for power density of plant (average raw energy density x plant conversion efficiency). As you point out at #300: (200W/m2 x 20%) x 24 x 365 = 350.4kWh/m2/year LAGI says 400kWh/m2/year. Completing LAGI's area calculation gets this: 198,721,800,000,000/350.4 = 567,128,424,657.5 or 567,128 km2 A 13.5% exaggeration. Still, not really enough to overturn LAGI. But After MacKay, using 15W/m2 for CSP: 15W/m2 x 24 x 365 = 131.4kWh/m2/year 198,721,800,000,000/131.4 = 1,512,342,465,753.4 or 1.5 million km2 After Smil, using 10W/m2 for CSP: 10W/m2 x 24 x 365 = 87.6kWh/m2/year 198,721,800,000,000/87.6 = 2,268,513,698,630.1 or 2.3 million km2 My problem is that I simply do not believe the power density estimates employed when people are talking up the potential vs footprint of renewables. And I have real-world data on my side. This has gone on for long enough (I'm sure if nothing else, we all agree on that). Given that MacKay calculates with a 100% packing factor while Smil looks at actual plant footprint, the truth is going to be somewhere above 2 million km2. A very big difference from 500,000km2. -
Eric the Red at 04:43 AM on 13 July 2011What we know and what we don't know
CB, Best to look at a moving average. I used a 5-year moving average, which has changed very little in 13 years; 2.00 in 1996, 1.98 in 2008, ranging from 1.74 to 2.14. The low values during the 1990s yield a misleading spike in the 2000s. This is the problem with cherry-picking values. -
Dikran Marsupial at 04:43 AM on 13 July 2011What we know and what we don't know
Eric the Red. You have got the situation 180 degrees the wrong way round. The reason we have statistics is because we are able to see in noisy data pretty much anything we wish to see. However being able to see some pattern in the data doesn't mean that it is meaningful rather than an artifact of the noise. Statistical hypothesis testing is one way in which we can guard against jumping to such conclusions. Your analysis did nothing to suggest that the hypothesised departure from exponential is anything other than an artifact of the noise. In short, you can do "more than that", you can devise some test that demonstrates that there is statistically significant evidence for your hypothesis. -
Albatross at 04:36 AM on 13 July 2011What we know and what we don't know
I sense something Monckton'esq going on here, and more strawmen arguments from contrarians to distract us from inconvenient truths...darn it I should be doing other stuff. Tamino has addressed this silliness here and here. He concludes: "CO2 has increased faster than exponential. Even using the shorter NOAA global dataset. And yes, the result is statisically significant." EOS. -
CBDunkerson at 04:34 AM on 13 July 2011What we know and what we don't know
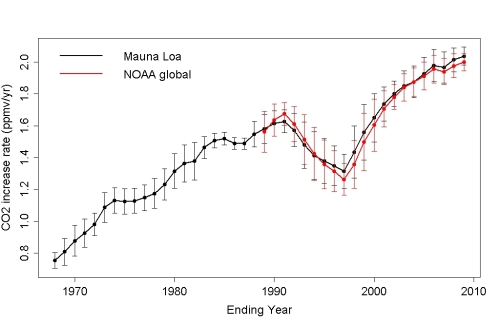
Let's examine a 10 year running average; 1961-1970: 0.898 1971-1980: 1.336 (+0.438) 1981-1990: 1.547 (+0.209) 1991-2000: 1.545 (-0.002) 2001-2010: 2.043 (+0.498) From this we can see that there was a 'leveling off' in the 90s (mostly due to 1992 having the second lowest increase on record), but then increases accelerated in the 2000s. Note again that these are increases in the rate of increase... a linear rise would have these values staying steady. Instead, the most recent ten years show the largest increase in the series. -
Dikran Marsupial at 04:13 AM on 13 July 2011What we know and what we don't know
Eric, I wrote: "If you can show me an anlysis that robustly demonstrates that it is linear (rather than there just isn't enough data over shuch a short time span to distinguish between linear and exponential with statistical significance) then I am happy to stand corrected." You failed to do so, you still have failed to do so. Now I've had enough of this nonsense, TTFN. -
KR at 03:51 AM on 13 July 2011A Detailed Look at Renewable Baseload Energy
Tom - Agreed, the land cost is not a huge factor, especially with dual purpose land such as you show here. I actually suspect the major factors will be political, in the large scale grid interconnectivity needed to support distributed power generation, making it robust against weather variations, and in changing where the $$$ for power goes rather than to OPEC. I'm always puzzled by "we can't do it" objections such as the ones that have appeared in this thread. They just don't make sense. --- Side note/thought experiment: I think that if you set up rectangular mirrors trimmed from parabolic shapes, you could put them together with near zero waste space. Off vertical, each would partially shade neighbors behind it, but the full field area should still receive complete coverage. Again, though, land is relatively cheap, and you're going to want some room for servicing the collectors. -
Dikran Marsupial at 03:44 AM on 13 July 2011What we know and what we don't know
Eric the Red I like the "our point", most amusing. CBDunkerson's plot directly refutes your assertion that "The rise has been fairly linear since 1975.". That assertion is clearly incorrect, has been challenged, the challenge ducked and now you are trying to suggest that we had been making the same point! Your chutzpah is beyond belief! -
Tom Curtis at 03:38 AM on 13 July 2011A Detailed Look at Renewable Baseload Energy
Further to 301, exactly how much area of the Earth's surface should we count this Million kWh per annum solar power plant as occupying?It does not use a single square mm of land that is not already being used for another purpose. The opportunity cost of the roof area used is very close to zero. In North Africa, along the coast, if excess power production is used to run desalination plants, solar power plants may even have a negative opportunity cost. That is, they may actually increase the area of available arable land by providing water to allow arid land to be irrigated. Again, the point is that the idea that we should measure efficiency in terms of total plant area instead of total collector error is a serious distortion.
-
Eric the Red at 03:27 AM on 13 July 2011What we know and what we don't know
Yes CB, that was our point. The rate of CO2 increase was increasing as your graph shows, but is now averaging about 1.8 ppm/yr. http://www.esrl.noaa.gov/gmd/ccgg/trends/Response:[DB] Looking at all of the data instead of the standard dissemblers cherry-picked start dates:

year ppm/yr
1959 0.94
1960 0.54
1961 0.95
1962 0.64
1963 0.71
1964 0.28
1965 1.02
1966 1.24
1967 0.74
1968 1.03
1969 1.31
1970 1.06
1971 0.85
1972 1.69
1973 1.21
1974 0.77
1975 1.13
1976 0.84
1977 2.10
1978 1.29
1979 1.75
1980 1.73
1981 1.43
1982 0.74
1983 2.17
1984 1.37
1985 1.27
1986 1.45
1987 2.33
1988 2.12
1989 1.31
1990 1.28
1991 0.98
1992 0.46
1993 1.36
1994 1.93
1995 1.93
1996 1.23
1997 1.92
1998 2.98
1999 0.90
2000 1.76
2001 1.57
2002 2.60
2003 2.30
2004 1.55
2005 2.50
2006 1.73
2007 2.24
2008 1.63
2009 1.89
2010 2.42
[Source]
Please note that posting comments here at SkS is a privilege, not a right. This privilege can be rescinded if the posting individual treats adherence to the Comments Policy as optional, rather than the mandatory condition of participating in this online forum. This also includes playing rhetorical games.
Please take the time to review the policy and ensure future comments are in full compliance with it. Thanks for your understanding and compliance in this matter.
-
Tom Curtis at 03:25 AM on 13 July 2011A Detailed Look at Renewable Baseload Energy
KR @300, I do not know of any actual designs, so no, I cannot provide links. But it is certainly possible to do. One potential design would be a field divided squares each filled by a fixed parabolic reflectors. A series of gantries could be mounted each field line of squares, able to track east or west to follow the focal point of each parabolic section during the day, with a carriage on the gantry carrying a sterling engine, and able to move north-south to track seasonal changes. Because the mirrors are fixed, they can be butted together with no gaps, except for the rail to carry the gantry. Is it practical? No. Is it economical? No. Can it be done? Yes. The point is the argument that we should measure our efficiency in terms of the land area of the plant (at $10 an acre, or whatever picayune price it costs in the Sahara) rather than in terms of the area of the collectors is nonsense. Land area is a factor in England, but primarily because the low solar intensity means greatly enlarged areas are needed for the same power generation. In Singapore and Hong Kong land area is definitely a factor, and I am happy to predict that we will never see a CSP plant in either. But even in farmland in Granada, Andasol considers land so small a relative cost that they could not even bother building the power plant and salt storage tanks underground to allow collectors to be run over the top of them. The cost per m^2 of land is not the limiting factor of solar power. The cost per m^2 of collectors is. -
CBDunkerson at 03:03 AM on 13 July 2011What we know and what we don't know
Actually, the rate at which the atmospheric CO2 concentration is increasing... is itself increasing;
-
Albatross at 02:52 AM on 13 July 20112010 - 2011: Earth's most extreme weather since 1816?
For those still following this thread, The skeptics are misrepresenting Trapp et al's findings. Nowhere in their 2007 and 2009 papers do they even use the word "supercell". So no, they do not hypothesize that CAPE is the dominant factor in determining supercell formation as is claimed @330. Besides, severe weather can be caused by other types of thunderstorms (e.g., multicell, MCSs before they go upscale, squall lines, derechos etc.). Moreover, Trapp et al. state very clearly that they are identifying "severe thunderstorm environmental conditions". Their motivation for using the product of CAPE and 0-6 km wind shear is solidly rooted in theory and has been corroborated by empirical studies comparing proximity soundings to severe events. An interesting tidbit. Brooks et al. (2003) looked at the magnitude of the vector wind difference between the surface and 6 km (m s^-1) and CAPE (J kg^-1) for all reanalysis soundings associated with severe thunderstorms in US for 1997–1999. They found that as CAPE increased, the 0-6 km wind shear required to produce significant severe storms (i.e., hail of 5 cm or greater in diameter, wind gusts of 120 km hr^-1 or greater, or a tornado of F2 intensity or greater) decreased. The graph looks similar to the one below (sorry I have been unable to identify the source, nor find a suitable graphic that is not embedded in a PDF):[Source] Why this is, is an interesting story....but now I really do have to take care of some work.
-
KR at 02:46 AM on 13 July 2011A Detailed Look at Renewable Baseload Energy
BBD - How about you answer a question? ~225 W/m^2 daily hour average * 24 * 365 = ~2000 kWh/year/m^2. 1000 W/m^2 peak * 2000 hours effective peak available = ~2000 kWh/year/m^2 2000 kWh collected at 20% efficiency is 400 kWh/year. For both computations, when done right, as 2000 = 2000. You (repeatedly) claim the peak * peak available is incorrect - if so, why isn't the average hourly rate times the number of hours? Either both are right, or both are wrong. And, as the moderator stated, 'trickery' is not an appropriate term. If you cannot accept that you made an error here, BBD, I cannot expect that you will be an effective contributor to the various discussions. --- Tom - Thanks for pointing that out, I was not aware of field designs with zero waste space, although I knew parabolic trough designs get close to that. Any links you can point me to? -
Dikran Marsupial at 02:38 AM on 13 July 2011What we know and what we don't know
Eric the Red O.K. I see that you are merely trolling, as exemplified by the fact that rather than produce some evidence that the rise in CO2 is linear rather than exponential, or admit that you have no such evidence, you point out that linear is a special case of exponential as if that somehow made your point (rather than mine). Sorry Eric, life is too short. The idea that there is no essential difference between linear and exponential I'm sure will revolutionise the field of control theory! ;o) -
Tom Curtis at 02:37 AM on 13 July 2011A Detailed Look at Renewable Baseload Energy
BBD @296, MacKay's method (not the standard method) only provides an accurate estimate of plant output for fixed horizontal collectors. For other types of collectors, different methods should be used, as detailed here. As can be seen below, different collection methods behave quite differently in terms of seasonal performance, and in terms of total power collected trhough the year:
Prev 1581 1582 1583 1584 1585 1586 1587 1588 1589 1590 1591 1592 1593 1594 1595 1596 Next


