


 Arguments


Recent Comments
Prev 1604 1605 1606 1607 1608 1609 1610 1611 1612 1613 1614 1615 1616 1617 1618 1619 Next
Comments 80551 to 80600:
-
Camburn at 12:08 PM on 14 July 2011The Medieval Warm(ish) Period In Pictures
scaddenp: What would I use to identify outliers? Something that is out of the norm, I would want to examine the method of determing it as a suitable proxy. If the method of determination falls within accepted science and has been consistent, that would cause me to examine the other proxies to see why the variablility. It could very well be the other proxies are wrong and the outlier is correct. -
Camburn at 12:03 PM on 14 July 2011The Medieval Warm(ish) Period In Pictures
Mr. Mann used proxy data that he deemed relevant. From that data he then used re-amalysis to obtain what he thinks the temp patterns were during the MWP. The Sargasso Sea proxy data appears to show his re-amalysis has a flaw in it. I do not know what his error bars were. DB: I have not seen any rebuttals to the Sargasso Sea temperature proxies. I have seen supporting papers as the thermocline, currents etc seem to make this an excellent source of temp data. If you have any, I am open to reading them. -
David Lewis at 11:10 AM on 14 July 2011Trenberth on Tracking Earth’s energy: A key to climate variability and change
I did not mean to say that Dr Trenberth believes or has ever said that global warming has stopped. I can agree that the words I used are confusing. Here's another attempt: "Dr. Trenberth is clear that when he talks about "missing energy" he does not mean he believes global warming has stopped. Quoting from Dr. Trenberth:" Then follow with the quote I used. Perhaps you could edit my comment and remove your objections? I never intended to be saying what you've both taken from my words. I thought the conditional words in my sentence made things clearer than they obviously are, that's the "whether... it means" part. I set up the quote I used from Dr. Trenberth with this conditional, i.e. Dr Trenberth is clear about "whether... it means", then I let him speak for himself. -
Rob Painting at 10:39 AM on 14 July 2011Trenberth on Tracking Earth’s energy: A key to climate variability and change
David Lewis @43 - "Dr. Trenberth is clear when he talks about whether when describing things using this "missing energy" concept it means he thinks global warming has stopped" I also take issue with that claim. Did you just gloss over this part of Dr Trenbertth's post?: " we have found that energy can easily be “buried” in the deep ocean for over a decade." See Trenberth & Fasullo (2011) -
scaddenp at 10:38 AM on 14 July 2011The Medieval Warm(ish) Period In Pictures
So Camburn, when you are sorting through proxy data sets what methodology would you use to identify outliers? (from memory, Mann's is described in the supplementary info.) -
Doug Mackie at 10:30 AM on 14 July 2011OA not OK part 5: Reservoir dogs
@JosHag Too early to say with confidence. McKinley et al. divided the North Atlantic into 3 zones and split the ocean pCO2 system into 2 parts. One part is temperature related and one part is chemical related. The temperature part is about a quarter the size of chemical part. The chemical part is further subdivided into 3 sub-components. In one subdivision of one of the ocean zones the trend for part of the study period of one of the chemical sub-components increases with time while the trend for the other two chemical subcomponents decrease. From the conclusions:At the 1 sigma confidence level, we are able to detect short-term shifts in oceanic pCO2, reasonably explained by climate variability (9-11), and north of 30_ N, long-term oceanic pCO2 trends that track the rate of atmospheric pCO2 increase. A significant role for the seasonally stratified biomes of the North Atlantic in the proposed multi-decadal increase in the atmospheric fraction of anthropogenic CO2 (refs 8,26,27) is not distinguishable. However, in the North Atlantic permanently stratified subtropical gyre we do find an increasing influence on oceanic pCO2 by a warming trend that is partially due to anthropogenic forcing (12). This is evidence of a climate_carbon feedback that is beginning to limit the strength of the ocean carbon sink.
From the press release:[McKinley] stresses the need to improve available datasets and expand this type of analysis to other oceans, which are relatively less-studied than the North Atlantic, to continue to refine carbon uptake trends in different ocean regions. This information will be critical for decision-making, since any decrease in ocean uptake may require greater human efforts to control carbon dioxide levels in the atmosphere.
-
David Lewis at 10:12 AM on 14 July 2011Trenberth on Tracking Earth’s energy: A key to climate variability and change
Try re reading my comment. I'm quoting from Dr. Trenberth, so are you, and the two quotes say just about identical things. What's the problem?Response:[DB] I did re-read your comment. Your quote that I used in my response to you is the opposite of what Dr. Trenberth has up on his website, which I quoted. They are not identical. Or are you saying I misquoted you?
My quote of you:
"it means he thinks global warming has stopped"
My quote of Dr. Trenberth:
"It does NOT mean that global warming is not happening, on the contrary, it suggests that we simply can't fully explain why 2008 was as cool as it was, but with an implication that warming will come back, as it has."
No problem. Dr. Trenberth says global warming has not stopped, which is the opposite of your attribution of what he said.
-
Rob Painting at 10:06 AM on 14 July 2011The Medieval Warm(ish) Period In Pictures
To reinforce Phil Scadden's point about global sea level during the MWP, as compared to the present:
-
Bern at 10:05 AM on 14 July 2011Great Barrier Reef Part 3: Acidification, Warming, and Past Coral Survival
I'll second Byron's call for posts on rate of change. As this excellent series of articles on the GBR shows, the expected impacts are major, and a key factor is that they are extremely rapid by geological or ecological timeframes. -
Eric (skeptic) at 10:02 AM on 14 July 2011Are you a genuine skeptic or a climate denier?
Note for the record, I am taking up scaddenp's offer to discuss this by email. -
mandas at 09:38 AM on 14 July 2011Visions of the Arctic
Apirate @ 36 ".....Good post. Goes back to my polar bear and manatee analogy. What may be bad for polar bears will probably be good for manatees...." I thought you said you had an MS in Fisheries and Wildlife Biology? If so, you should give it back after that statement @ 36. Anyone with any knowledge of ecosystems and wildlife knows that the web of life is extraordinarily complicated, and that the removal or suppression of one species - particularly an apex predator - can have far ranging and entirely unpredictable consequences for other species. A very simple and well known example is wolves in Yellowstone NP. What species are regulated by predation by polar bears? If that regulation is removed, what will regulate their numbers in the future? Food resources? Is there competition between species for that food? What then happens to those species? What happens to lower level species if the level of predation is changed? etc etc etc And that's only part of the problem with climate change. Its not just wildife that are adapted to the current climate regime - humans and our whole culture are adapted to things exactly as they are now. If you change that, even by a small amount, you are going to create a requirement to adapt. Many species will be unable to and will go extinct - there is absolutely no doubt about that - and that will cause cascading effects which could cause trophic collapse in many parts of the world. The effects of this are completely unpredictable - and the associated costs are going to be staggering. People complain about the costs of mitigating climate change. They are in for a real shock when they find our what the costs of adapting are going to be. -
Camburn at 09:34 AM on 14 July 2011The Medieval Warm(ish) Period In Pictures
DB@48: I am not inferring a global event from the Sargasso Sea. I was just pointing out that proxy data from a number of papers it seems, does not agree with the reanalysis presented by Dr. Mann. I agree with the area of the Sargasso Sea as presented in this Wikki link. http://en.wikipedia.org/wiki/Sargasso_SeaResponse:[DB] I believe you pointed out one paper, which itself has "issues".
-
David Lewis at 09:24 AM on 14 July 2011Trenberth on Tracking Earth’s energy: A key to climate variability and change
One thing that seems certain in all this are these words from Dr. Trenberth's above post: "we have observing systems in place that nominally can measure the major storage and flux terms but due to errors and uncertainty, it remains a challenge to track anomalies with confidence". In Trenberth's original "Perspectives" paper published in Science Tracking Earth's Energy, he was clear that the "missing energy" he was discussing was "due to either inadequate measurement accuracy or inadequate data processing". However, Dr. Trenberth often talks or writes as if there is some actual "missing energy" he expects to find one day, as opposed to tracking down measurement or processing errors, which may lead to confusion for some. What Trenberth wrote in his original Science paper appears to place him very close to Hansen's view, i.e. that this is at present murky territory, except Hansen appears to be questioning how much heat models should be allocating to the deep ocean when Trenberth appears not to be. Hansen discusses how difficult he thinks it is to measure Earth's energy imbalance accurately, starting on page 44 in Earth's Energy Imbalance and Implications. Hansen says he thinks the Argo float system, if extended and maintained for the long term, added to other data on the smaller heat reservoirs, could provide "potentially accurate" data on Earth's energy balance, where it is less likely, in his view, that current or proposed satellites can. Trenberth has written about the Argo system which, with some other fairly new items in the data collection arsenal, constitutes a "revolutionary" change in what scientists have available for analysis. In the meantime, I think many are taking too much away from their reading of Dr. Trenberth. It seems to me he's using "missing energy" in the way particle physicists use the term, when their calculations involving the latest data prove to them, because nothing can be missing, that they're mistaken somewhere. Trenberth assessed the data available, added it up, and found what should not be able to be found if the data was complete and good, i.e., that something was "missing". He published his findings and went back to the drawing board, or computer model as it turned out. Some seem to have problems with Dr. Trenberth's way of expressing himself. Most famously is the way his "missing energy" email was seized by deniers. But James Lovelock illustrates how badly someone can misunderstand Dr. Trenberth even if wilful distortion is not the goal. See Stewart Brand's online Afterword In this Afterword, Brand quotes Lovelock telling him that after reading Trenberth's "missing energy" paper he decided that"something unknown appears to be slowing the rate of global warming", which caused Brand in his subsequent public speeches to describe a possibility that by 2050 "nothing" will have happened to Earth's climate. Further discussion of Brand's thought here Brand and Lovelock are wandering around touting the work of Garth Paltridge, specifically, this "sensible skeptic"s (Brand's words) book with its Foreword by Lord Monckton. It seems Lovelock, via Trenberth, ended up at Monckton's front door. Yow. Dr. Trenberth is clear when he talks about whether when describing things using this "missing energy" concept it means he thinks global warming has stopped - "the AGW signature is not large enough to overwhelm natural variability and so the trend from increased GHGs is only clear on time scales of 25 or more years. We used 25 years in Chapter 3 of IPCC as the lowest trend we provided that was meaningful.... So any pause in sfc T increase from 2000 to 2008 is not unexpected and the first 8 months of this year were the warmest on record and have restored the upward trend. So there is no evidence of a reduction in trend" (personal communication). P.S. There are some great graphics N.O.A.A. provides that may make it clearer to some who wonder what El Nino/La Nina a.k.a. ENSO is. Imagine we've sliced into the ocean so we can get a 3D view of its heat content at various times during the ENSO cycle:
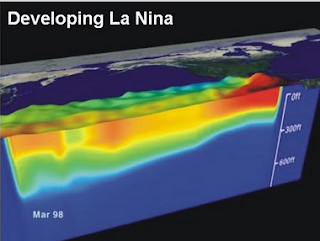
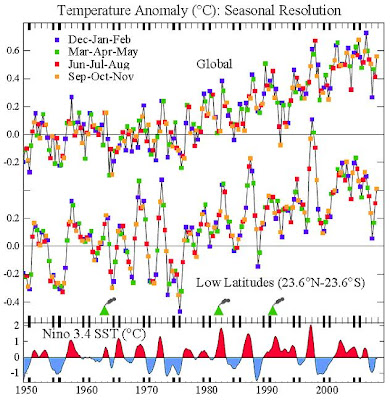
Hansen describes ENSO as heat "sloshing around" in the planetary system. As the hotter water spreads out its heat is more available for transfer into the atmosphere. When the hotter water forms a deeper pool there is less surface area for heat to come out of it into the air. Since by far most heat entering the planetary system is going into the ocean, and it sloshes around like this, it becomes more apparent how El Nino/La Nina can influence the average global surface temperature chart in the way it appears to do. Hansen's Bjerknes Lecture had a chart showing the correlation between El Nino/La Nina (depicted at the bottom of his chart) and the average global surface temperature chart depicted at the top:
 Response:
[DB] "Dr. Trenberth is clear when he talks about whether when describing things using this "missing energy" concept it means he thinks global warming has stopped"
Despite what your "personal communication" may state, Dr. Trenberth is publicly on record as stating the opposite:
"It is quite clear from the paper that I was not questioning the link between anthropogenic greenhouse gas emissions and warming, or even suggesting that recent temperatures are unusual in the context of short-term natural variability.
This paper tracks the effects of the changing Sun, how much heat went into the land, ocean, melting Arctic sea ice, melting Greenland and Antarctica, and changes in clouds, along with changes in greenhouse gases. We can track this well for 1993 to 2003, but not for 2004 to 2008. It does NOT mean that global warming is not happening, on the contrary, it suggests that we simply can't fully explain why 2008 was as cool as it was, but with an implication that warming will come back, as it has. A major La Niña was underway in 2008, since June 2009 we have gone into an El Niño and the highest sea surface temperatures on record have been recorded in July 2009."
Emphasis added.
-
BBD at 09:10 AM on 14 July 2011A Detailed Look at Renewable Baseload Energy
Some things to think about... Logistics and politics. The feasibility of very large footprint solar plant in currently inaccessible desert locations depends on both as much as it does on output projections. Construction transport infrastructure Roads - built with what and from where? (Ability of North Africa (NA) to provide without mass import?) Rail - ditto (wood and iron resource in NA?) Full energy/emissions accounting for mining, processing, import and transport of required materials to point of construction? Roads - NA requires import of a large* fleet of tractor units and flatbed carriage Rail - NA requires import of a large* rolling stock of locomotives and flatbed carriage Full energy/emissions accounting for manufacture and import? Plant construction materials Concrete and steel. Carbon villains. Vast quantities* required for vast solar plant construction. Full energy/emissions accounting for mining, processing, import and transport of required materials to point of construction? The majority will have to be imported for NA. Finally, water use - this cannot be waved away in NA Estimate vs available resource? Politics There is so much to say that it is foolish to spray questions. Here is one: Why is it appropriate for Europe to assume that it has an uncontested right to the potential solar resource in North Africa? HVDC can go South as well as North. *'Large' and 'vast' risked on SkS. How many trucks and trains and megatonnes of concrete, steel and glass do we need to build something like this? To get this:65 such blobs [50% packing factor; erratum in caption] would provide 1 billion people with 16 kWh/d per person.
16kWh/d is good, but the European average consumption is 125kWh/d. -
Doug Mackie at 09:05 AM on 14 July 2011OA not OK part 5: Reservoir dogs
@Tor B"So, adding CO2 to the atmosphere causes CO2 to get into ocean water (via a partial pressure mechanism, or something else?)".
Henry's law. Post 8."This CO2 mostly doesn't remain as CO2 but becomes ions of mostly bicarbonate (aka hydrogen carbonate) and some carbonate, all by chemical reactions with water at near-surface ocean depths (e.g., low pressure) and typical near-surface temperatures (does temperature matter much?)".
Yes, the CO2 mostly doesn't remain as CO2. Not aka hydrogen carbonate by chemical oceanographers - we already said this. Temperature is important."We know this experimentally and by measuring sea water concentrations. Do we have chemical analyses of sea water from 300 years ago or do we have vials of old water or is it determined by proxies?"
No we do not have 300 year old water. If you put a pH electrode in a solution today you are measuring pH by proxy. Different proxies are used to determine past ocean conditions. Posts 11 &12."Are deep ocean carbon increases due mostly to ocean currents or to something else?"
Something else. Post 16."How does this affect the Carbonate Concentration Depth?"
post 13"Does the carbonic acid species last long and is it what disolves sea shells?"
No. Post 14. -
Byron Smith at 09:00 AM on 14 July 2011Great Barrier Reef Part 3: Acidification, Warming, and Past Coral Survival
Thank you for this post. The point about rate of change at the end is a crucial one for nearly all ecosystems (including our agricultural ones) and is frequently misunderstood. I think more posts on this topic (why rate of change matters) would be worthwhile. -
scaddenp at 08:52 AM on 14 July 2011The Medieval Warm(ish) Period In Pictures
Eric, from your first reference: The preservation of Neolithic leather indicates permanent ice cover at that site from ca. 4900 cal. yr BP until AD 2003, implying that the ice cover was smaller in 2003 than at any time during the last 5000 years. For second, can you point me to where you see evidence that glacial retreat in MCA was further than today? And surely you are not falling for Easterbrook trick ("0" in the ice core is 1905"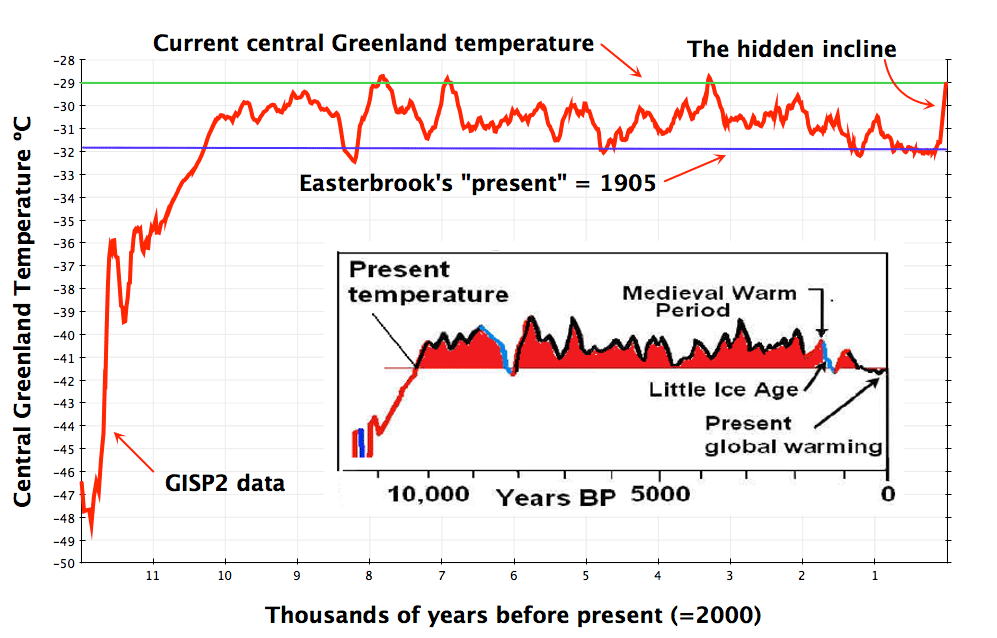 As for sealevel - to make a comparison, you have to apply GIA adjustments.
-
michael sweet at 08:21 AM on 14 July 2011Visions of the Arctic
A Pirate says "And, the most glaring error in the article is that the author states polar bears build up fat in the winter. What!?!" and Eric at 23 says "Warming in Arctic will favor the populations where the warm season is currently short." Please read the links. Polar bears feed on seals on the sea ice in the winter. During the warm season they go ashore and do not feed. When the skeptics do not read the background information it is difficult to discuss the subject. A Pirate: you claim to be a scientist. How can you make such a catastrophic error? What!?! -
arch stanton at 08:21 AM on 14 July 2011Visions of the Arctic
Pls SkS, Stick to the science. Somewhere, someplace, there is bound to be a jellyfish lover that has pretty pictures of jellyfish (including some newly discovered species) to use as propaganda material. Explaining the science is your strong point. arch -
John Russell at 08:16 AM on 14 July 2011What we know and what we don't know
Commenters may have noticed this is a cross-post from 'The Carbon Brief' (link provided above at the top of this article). A number of sceptics are making comments on there which some of you more clued-up posters might like to address. All contributions to the debate welcome! -
Phila at 08:16 AM on 14 July 2011Visions of the Arctic
What may be bad for polar bears will probably be good for manatees. Well, if some guy on the Internet thinks so, that's good enough for me! Polar bears for manatees sounds seems like an even trade. Lord only knows why I ever bothered trying to follow the trail of cause and effect any further than that. It beats me why we waste our money funding scientific research in this country, when the real facts about nature are available gratis and free of charge online, in the form of casual speculation from anonymous "experts." -
Phila at 08:09 AM on 14 July 2011Visions of the Arctic
I have never read a piece by an environmentalist which did not pose a dire warning of some kind about the imminent demise of some form of wildlife And of course, all of them turned out to be wrong, so nobody has anything to worry about, ever. Right? One of the ugliest and oldest denialist tactics is this insistence that negative scenarios are manipulative or inherently improbable (even -- or especially -- when the evidence supports them). The fact that it's often presented as an attack on "emotionalism" makes it even more absurd, since it's an entirely emotional reaction (kind of like shouting "Is not!" until your face turns purple). The fact that it's also hypocritical is demonstrated by their over-the-top alarmism about any steps we might take to address the problems. But then, everyone here knows this. Including, I suspect, the people who keep trotting these comments out. -
JosHagelaars at 07:44 AM on 14 July 2011OA not OK part 5: Reservoir dogs
@Doug Mackie When the oceans warm up, the uptake of CO2 will be reduced: http://thinkprogress.org/romm/2011/07/12/267277/climate-change-reducing-oceans-carbon-dioxide-uptake/. Is this reduced uptake already taken into account when an extrapolation of pH and the total dissolved carbonate species are calculated for a future date? PS, for those interested, on http://www.eoearth.org/article/Ocean_acidification estimates are given for several parameters at different dates regarding the ocean acidification. -
apiratelooksat50 at 07:24 AM on 14 July 2011Visions of the Arctic
Ken Lambert at 28 Good post. Goes back to my polar bear and manatee analogy. What may be bad for polar bears will probably be good for manatees. -
apiratelooksat50 at 07:08 AM on 14 July 2011Visions of the Arctic
Paul D @ 21 and 22, First, I wear several hats: science instructor, swim coach, and environmental consultant. My educational and professional background is in aquaculture, fisheries and wildlife biology. From there I moved into industrial EHS management and eventually into consulting. I am published in the environmental field and have worked closely with my local, state and Federal environmental regulatory agencies. I am also a recommended consultant by my state Department of Natural Resources for nuisance wildlife control. (I trap and relocate whenever possible). Don't know if that makes me a wildlife scientist, or not, but... And, you are absolutely correct about organisms being under 24/7 duress. It is eat or be eaten. Reproduce or watch your genes disappear. Food, shelter, and water are the primary needs. Survival of the fittest, right? Again, polar bears evolved due to the stressors of an ice age. But, life has always adapted and always will. Yes, human behavior has undoubtedly impacted many forms of wildlife. Some positive, some negative. No one knows for sure what our climate impacts on arctic biomes will be. -
DSL at 06:51 AM on 14 July 2011OA not OK part 5: Reservoir dogs
Riccardo, it's clear -- I was trying to be funny (but clearly was not). -
Tor B at 06:31 AM on 14 July 2011OA not OK part 5: Reservoir dogs
So, adding CO2 to the atmosphere causes CO2 to get into ocean water (via a partial pressure mechanism, or something else?). This CO2 mostly doesn't remain as CO2 but becomes ions of mostly bicarbonate (aka hydrogen carbonate) and some carbonate, all by chemical reactions with water at near-surface ocean depths (e.g., low pressure) and typical near-surface temperatures (does temperature matter much?). We know this experimentally and by measuring sea water concentrations. Do we have chemical analyses of sea water from 300 years ago or do we have vials of old water or is it determined by proxies? Are deep ocean carbon increases due mostly to ocean currents or to something else? How does this affect the Carbonate Concentration Depth? Does the carbonic acid species last long and is it what disolves sea shells? (I'm not doubting that there is some basic chemistry that I'm missing. Please correct any misunderstandings I demonstrate.) (And forgive me, please, for not knowing what you think I know.) -
BBD at 06:18 AM on 14 July 2011A Detailed Look at Renewable Baseload Energy
KR #320 Which can only be good news. Out of general, but practical interest, are we in broadly compatible time zones? As you have probably gathered, I'm in the UK. Please note, I do not ask where you are. -
KR at 06:15 AM on 14 July 2011A Detailed Look at Renewable Baseload Energy
Interesting note: July 4, 2011, the Spanish Torresol solar project became the first to generate uninterrupted 24 hour power from the sun. Torresol uses a 15 hour molten salt supply as a storage mechanism, and is predicted to provide power ~20 hours a day average, with summers having multiple 24-hour production cycles. It's expected to generate ~110 GWh/year from a 19.9 MW capacity tower design. -
BBD at 06:09 AM on 14 July 2011A Detailed Look at Renewable Baseload Energy
KR #317 Thank you. What I wanted to establish was whether you (or Tom) differed with MacKay's estimate. It was you who quite correctly emphasised the need for common definitions. I'm looking for figures which are generally going to be acceptable here. I'm not trying to get you or anyone here to actually 'do my homework'. Just to be clear. -
BBD at 06:05 AM on 14 July 2011A Detailed Look at Renewable Baseload Energy
The other thing that would be helpful are pointers to reliable estimates for transmission and conversion loss estimates for HVDC. Also, what is considered the maximum realistic distance over which HVDC can be employed. I'm looking at this myself, of course, but I'd be interested to know what figures would be generally accepted here. -
KR at 06:03 AM on 14 July 2011A Detailed Look at Renewable Baseload Energy
Given CSP's high conversion efficiency (a conversion efficiency of 31.25% for a Stirling engine dish system) and effectiveness ~60% greater for a tracking system over a fixed system, 15 W/m^2 for a desert system sounds entirely reasonable, despite the spacing required between collectors for 2-axis tracking. The Stirling engine dish systems are the highest conversion efficiency available, although linear Fresnel systems offer higher effective power density due to high fill factor, and are reasonably inexpensive to build. Incidentally, the above info was located with a quick Google on "concentrating solar power stirling engine". This information is readily available. -
BBD at 05:23 AM on 14 July 2011A Detailed Look at Renewable Baseload Energy
MacKay's estimate of a power density of 15W/m2 for CSP is explained here (note 178).178 Concentrating solar power in deserts delivers an average power per unit area of roughly 15 W/m2. My sources for this number are two companies making concentrating solar power for deserts. www.stirlingenergy.com says one of its dishes with a 25 kW Stirling engine at its focus can generate 60 000 kWh/y in a favourable desert location. They could be packed at a concentration of one dish per 500 m2. That’s an average power of 14 W/m2. They say that solar dish Stirling makes the best use of land area, in terms of energy delivered.
The SunCatcher appears to be a state-of-art two-axis CSP collector. Any views on MacKay's power density estimate for (Stirling Engine based) CSP plant? (This is not a loaded question btw. I am after knowledge). -
Riccardo at 05:04 AM on 14 July 2011OA not OK part 5: Reservoir dogs
DSL I apologise if it hurts your feelings. As a non-english speaking I may be wrong but the use of the word meat to indicate the essential part of something looks quite common to me. The Merriam-Webster Dictionary (entry #4) seems to confirm. In any case, I hope the sense of my comment is clear. -
Paul D at 04:54 AM on 14 July 2011Visions of the Arctic
Ken Lambert@28 said "Surely the odds are that some creature somewhere will benefit from a warmer world. In fact the odds are probably even that 50% of creatures will benefit and 50% won't." The whole issue is very complicated. If you assume that humans are more adaptable to change in climate than other species and we tend to like staying in one place these days. Then if a 'creature' Southern Europe started finding things tuff and migrated north, it is likely that it wouldn't have a problem because the it probably already adapted (or has been genetically manipulated by humans) and can live beside humans. However in the same scenario, creatures in North Africa may be used to living well away from humans. So even if they crossed the Mediterranean they have the added problem of cities, towns, industry and other human developments of Southern Spain and France. The chances are humans aren't going to be to happy with that (along with possible desertification of Southern Europe). So humans could be forced to move North or stay in hotter Southern Spain/France and live with the migrating species from Northern Africa. Now I suppose if you couldn't care about economics (which seems strange since economics seems to be the core of many skeptics opposition to AGW) then you could say, who cares? It will all sort itself out. Humans will just settle elsewhere and migrate North. But the reality of that concept is that it is really about ignoring the future and living for today. That is what current economic theory is about, so no surprises there. The main issues regarding all of this, including Polar Bears, is the capacity in the modern world for species to migrate. Probably air and sea species (birds, fish etc) have a head start, but will still have problems with other environmental issues. But land based species are going to have a hard time (with the exception of trees and plants possibly). But apart from just climate change, humans are putting huge amounts of pressure on species under the current climate conditions, let alone one in which climate is changing. -
WaxItYourself at 03:41 AM on 14 July 2011CO2 is coming from the ocean
David: Keeling, C.D. et al (2001), Exchanges of Atmospheric CO2 and 13CO2 with the Terrestrial Biosphere and Oceans from 1978-2000. I. Global Aspects II. Three-Dimensional Tracer Inversion Model to Deduce Regional Fluxes III. Sensitivity Tests IV. Critical Overview SIO Reference Series, Scripps Institute of Oceanography, 88 pages -
BBD at 03:00 AM on 14 July 2011A Detailed Look at Renewable Baseload Energy
KRFor some reason the difference between max capacity and average power keeps coming up in skeptical arguments against renewable power...
Ah. Now that I can help with. Certainly as regards the UK. The problem is that renewables manufacturers and the government have a naughty habit of quoting capacity rather than average output when talking up the latest wind project. -
DSL at 02:48 AM on 14 July 2011Trenberth on Tracking Earth’s energy: A key to climate variability and change
CO2isnotevil, the problem has always been that "skeptical" arguments are not consistent with anything else. No alternative theory has been brought forth that accounts for the physics and the data. At best, "skepticism" as you define it is just a series of attacks launched from no theoretical position and designed to get rid of the narrative that the reality of GW forces (it is us and it is bad) but not at all establish a more accurate, socially-produced scientific understanding of climate. In other words, you don't care about the science; you care about managing the spin--hence the nature of your comment.Moderator Response: [Dikran Marsupial] Please keep the discussion impersonal and on the science. As they say "don't wrestle a pig, you both get dirty, but the pig likes it"; if you think someone is not engaging in scientific discussion, the best policy is to simply ignore them. -
RyanStarr at 02:16 AM on 14 July 2011Visions of the Arctic
I suppose it begs the question (modern usage), how much warming can a polar bear?Moderator Response: [Dikran Marsupial] "warming" added -
KR at 02:02 AM on 14 July 2011What we know and what we don't know
I would suggest taking the (off topic) discussion on CO2 growth rates to the An exponential increase in CO2 will result in a linear increase in temperature thread. Or better yet, Eric the Red, go discuss this with Tamino, who has rigorously shown the greater than exponential growth of CO2. -
co2isnotevil at 01:53 AM on 14 July 2011Trenberth on Tracking Earth’s energy: A key to climate variability and change
Ken, [Moderation complaint deleted] BTW, it's my understanding that Trenberth is traveling around AU/NZ and will return on the 21'st. GModerator Response: [Dikran Marsupial] Posts containing complaints about moderation are normally deleted (after reading), so it is a bad idea to mix such complaints with any other comment you want to make as that will get deleted as well. I have edited your post, rather than deleting it, on this occasion to make sure you understand the situation. -
Eric the Red at 01:40 AM on 14 July 2011What we know and what we don't know
Kevin, Tom is correct in that I am not misreading the graph. If the CO2 increase was exponential, the rate of increase (Tom @16) would show a linear rise. Since 1900, atmospheric CO2 showed a near linear rise until WWII, then an exponential rise. As shown in @8 and @16, the rate of increase is decelerating. In an exponential, it would be constant, and if it were faster than exponential, it should be accelerating. I am not discounting Tom's analysis, as it may accurately portray the causes. However, the increase started deviating from an exponential growth in the 1960s, and is approaching a linear increase (has been linear for the past 13 years). In fact, had we continued growing exponentially, the rate of increase would be over 3ppm/yr, not the 2 that we have measured recently. The exponential growth was during a time of exponentially rising population and economic growth. Neither of these appear to be happening today. -
chris at 01:30 AM on 14 July 2011Visions of the Arctic
Eric the Red at 23:43 PM on 13 July, 2011 Eric, the evidence indicates otherwise. Surprising as it may seem global biodiversity as indicated by the fossil record is inversely related to temperature; i.e. greater biodiversity during cooler periods and lower during warmer. PJ Mayhew et al. (2007) A long-term association between global temperature and biodiversity, origination and extinction in the fossil record Proceedings of The Royal Society B 275, 47–53 abstract Of course the huge rate of warming that we are experiencing now and still to come is bound to lead to considerable species loss, compounded by habitat degradation and loss, and that's of greater concern (the very rapid warming) than a warm climate per se. -
KR at 01:20 AM on 14 July 2011A Detailed Look at Renewable Baseload Energy
In my previous post about Waldpolenz Solar Park and long term density, I did not actually show my calculation of the instantaneous power density. I wanted to show that as well for completeness. Waldpolenz occupies 110 hectares, and generates ~40,000 MWh per year. Conversion efficiency is irrelevant for this calculation. That's 4*10^10 Wh/year, divided by (24*365 hours), divided by 1.1*10^6 m^2, giving an average power density of 4.15 W/m^2, with correct units. This agrees with Smil's estimate of 4 W/m^2. Note that instantaneous power for a PV system like this will of course vary from summer noon maximum to nighttime zero - the rated capacity of the plant must be able to handle the summer noon maxima. This is one reason that the rated capacities of solar and wind power plants are so much higher than the average power produced. For some reason the difference between max capacity and average power keeps coming up in skeptical arguments against renewable power... Adding tracking to this fixed panel system would likely increase both average power density and effective collection of available sunlight by ~60%, without changing maximum capacity (through more time spent near maximum), albeit at a significant cost in initial build and maintenance. -
KR at 00:45 AM on 14 July 2011A Detailed Look at Renewable Baseload Energy
BBD - The ~230 Wh/m^2 average is taken directly from MacKay, and is a quite conservative estimate of tropical year round 24hr averages. The peak on his table is 273 Wh/m^2 in Nouakchott, MR. This refers to sunlight available prior to conversion into usable power. The 200 W/m^2 (note the different units - W/m^2 vs. Wh/m^2) came from peak insolation of 1000 W/m^2 and a 20% conversion efficiency - instantaneous converted power at noon, not time averages of sunlight. Apples and oranges. Wh/m^2 and W/m^2 are not equivalent, despite confusingly similar numbers. I always have to double check what I'm working with... -
DSL at 00:14 AM on 14 July 2011OA not OK part 5: Reservoir dogs
Meat - eating meat - a movement of carbon between reservoirs that are in an original figure (an animal that has organically grown (originated) the meat?) - resulting in fluxes - bloody flux? - uncooked meat? The Vegan in me is weeping quietly in a dark corner, Riccardo. -
Tom Curtis at 00:11 AM on 14 July 2011What we know and what we don't know
kevin s, I greatly appreciate the sentiment and comments, but let me assure you that Eric the Red is one of the regular cast of characters here, and is very unlikely to be misreading the graph in the way you suggest. -
Tom Curtis at 00:07 AM on 14 July 2011Visions of the Arctic
Eric the Red @29, that is a simplistic response. Life adapts to the conditions it is in, and when those conditions change, some species find themselves ill adapted to the new conditions and go extinct. That is part of the reason the end of the last glacial saw an extinction pulse, and why the PETM and the end Permian warming resulted in massive extinctions. Indeed, the end Permian extinction was the greatest extinction known in 600 million years. A shift from cold, relatively dry conditions to warm moist conditions, therefore, is likely to result in an extinction pulse. That in five to ten million years life will adapt and there will be more species, and more biomass on the planet will not change that. Further, unlike the events in the PETM and Permian extinction, on this occasion species around the world are already massively stressed from habitat loss and over exploitation. That means life has few resources with which to survive a significant environmental change. -
DSL at 00:04 AM on 14 July 2011Visions of the Arctic
Ken, you can't calculate the odds of evolution like that--even with very gradual changes. It all depends on the type of change. For example, if a snowball Earth gradually develops, will 50% of species benefit? No. If an mile-wide asteroid strikes the Earth, will 50% of species benefit? No. If gradual warming (3C over 40k y) occurs, will 50% of species benefit? Possibly. If rapid warming occurs, will 50% of species benefit? Maybe, but you'd damned well better have a studied reason for thinking so (and express it), because rapid change rarely benefits elements in a complex, integrated, dynamic biological system. Even elements that benefit in the short term in such conditions might be doing so at the (unfortunately necessary) cost of their long term survival. Your statement is evidence of poor thinking, Ken. In fact, it seems only to serve a need to be contrary. While I might agree that there might be a need to point out these "Natural World 101" type ideas for the sake of lurking doubters, in this case I think it's a complete waste of time. -
kevin s at 23:59 PM on 13 July 2011What we know and what we don't know
This succinct summary is useful...the more succinct the better, I find, because in face-to-face conversations, people taking the so-called "skeptic" position often change the topic frequently. This type of info seems to be best suited for people who are willing to modify their opinions in light of established facts. But as we know, not everyone is like that. I'm not sure what the proper approach is to those who aren't. But I think it's best to extend people the benefit of the doubt for as long as possible. For example, ETR's assertion that looking at all the data, CO2 rise is decelerating may seem like an unwillingness to accepts the facts plainly presented. But I wonder if perhaps he is reading the graphs of rate of CO2 increase presented here as graphs of CO2 level (instead of rate of increase). In that case graphs like the one from Tamino that Tom presents @ 16 would indeed *look* like there was a deceleration, and ETR would think *we* are the ones in denial. But of course, it is in fact a graph of *rate* of increase, and any curvature is not acceleration but acceleration of acceleration (or "jerk"). I think extending the benefit of the doubt feels better and has a better impact on lurkers than branding someone a denialist...even if they probably are. And I choose to believe that ETR is misreading the y-axis but being otherwise reasonable. Mods, I realize that most of this crosses into territory that's been declared off-topic, and I certainly won't be offended if this comment is deleted because of that. I just thought it was worth noting that in this particular case, what looks at a glance like trolling could be an honest mistake. I don't participate here often, so I don't really know the cast of regular characters....
Prev 1604 1605 1606 1607 1608 1609 1610 1611 1612 1613 1614 1615 1616 1617 1618 1619 Next


