


 Arguments


Recent Comments
Prev 1633 1634 1635 1636 1637 1638 1639 1640 1641 1642 1643 1644 1645 1646 1647 1648 Next
Comments 82001 to 82050:
-
Paul D at 08:11 AM on 20 June 2011Linking Extreme Weather and Global Warming
Norman: "With the extreme weather events only some nebulous and questionable correlations are presented without corresponding linking mechanisms." Extreme weather (harsher droughts and heavier rain fall) would be an indicator of climate change, not evidence. If the science of warming is established, then extreme weather purely adds to the list of indicators. There are enough changes that relate to weather, a far more prominent one is the change in timing of seasons, eg. starting earlier or later. -
Paul D at 08:04 AM on 20 June 2011Linking Extreme Weather and Global Warming
It's also looking as if the US Spring weather is going to be the most extreme to date. The UK is looking similar in many respects. -
Norman at 08:03 AM on 20 June 2011Linking Extreme Weather and Global Warming
Albatross @64 I checked out the link back to a Skeptical Science article that attempts to prove that preciptiation and river flows are increasing. In this same link did you bother to read Charlie A's responses to the author's claims? Post 41,42 and 44? In his 41 post, Charlie A actually post a graph which shows the opposite effect and would give a different conclusion. -
Norman at 07:56 AM on 20 June 2011Linking Extreme Weather and Global Warming
Tom Curtis @57 Here are some thoughts to consider with your post on the ENSO topic where you are demonstrating an increase in intensity of events that seems to correlate with Global Warming. Does Correlation equal Causation?. Some expamples that seem to Correlate. My main point questioning the linking of more extreme weather patterns to Global warming is that just coming up with a correlation is not good enough especially in something as complex as weather where many factors come into play in determining a weather event. This tactic is creating the huge denier syndrome that so many on this site complain about. It is not making people concerned and want to take action, it is generating the opposite effect. It closely resembles the reasoning of some on the Conspiracy sites. Every terrible natural event is caused by H.A.R.R.P. (all weather...floods, hurricanes, tornadoes, blizzards, droughts and even earthquakes). As a scientific minded individual I do not blantanly say this is wrong thinking, maybe it is HAARP, the possiblitly exists. I ask these people for a link, a mechanism a way HARRP can cause all these events. Anger such questions is the response. If you want to prove Global warming is causing more extreme ENSO events then you need to find a link or mechanism that directly couples these events. It is like AGW theory. The correlation is that CO2 is rising at the same time Global Temperatures are showing a rise. Without a possible linking mechanism it will never be an acceptable theory. Science does have such a mechanism and link. The link is that it can be demonstrated that CO2 absorbs certain bands of IR energy. And in the global arena sattelites can see reduction in IR energy at these bands and ground based sensors can pick up downwelling longwave radiation at CO2 band frequencies and measure the watt/meter of this radiation. So the observed correlation proves to have empirical links and can be considered a legitimate conclusion. With the extreme weather events only some nebulous and questionable correlations are presented without corresponding linking mechanisms. Many exterme weather events are caused by blocking patterns (will form heat waves, droughts, and flooding as storm system follow the same tracts as long as the block persists). Can you find or demonstrate a link that would explain how a warming planet will create more intense, greater numbers and longer lasting blocking patterns? -
Paul D at 07:54 AM on 20 June 2011Linking Extreme Weather and Global Warming
Camburn "People are suggesting extreme events are a somewhat recent occurance?" Nope, that is you implying others are. Camburn "How about the floods of the Mississippi River in the 1920's? The recent floods did not break those records." A single event in the past is not a signature of global warming. If the frequency of past events was higher then it would be. Hence your example(s) is fiction. Camburn "I have not read reliable data from any source that we are experiencing anything that is abnormal." A warming climate is abnormal and no sensible person is denying that the climate is warming. Glacial melt, changing seasons and numerous other changes are a very clear indicator. -
guinganbresil at 07:38 AM on 20 June 2011The Planetary Greenhouse Engine Revisited
Chris - In post 17, I think you missed my point. I agree with you on the isothermal layers in a one-dimensensional analysis. The simplest three-dimensional scenerio would be a tidally locked planet in orbit around a single sun. In this case there would be a large temperature difference between the day-side and night-side of the planet which would support vigorous convection and resulting tropospheric mixing. -
KR at 07:26 AM on 20 June 2011How would a Solar Grand Minimum affect global warming?
Camburn - I find links without comment rather difficult to parse/interpret; you might point out what you found interesting in such references. I believe that's part of the Comments Policy? To add to what SteveS found in the paper, it's worth looking at Figure 27 and the accompanying discussion, Global mean temperature anomalies, as observed and as modeled "Note that the models are only able to reproduce the late twentieth century warming when the anthropogenic forcings are included, with the signals statistically separable after about 1980." Figure 28, page 37, also illustrates this, showing estimates with and without anthropogenic forcing - only the modelling with anthropogenic forcings comes anywhere close to observations. And as SteveS quoted from section 6.4: "Despite these uncertainties in solar radiative forcing, they are nevertheless much smaller than the estimated radiative forcing due to anthropogenic changes, and the predicted SC‐related surface temperature change is small relative to anthropogenic changes." It's interesting work - but the uncertainties on TSI and other solar forcings are well below the knowns on anthropogenic forcings. -
guinganbresil at 07:17 AM on 20 June 2011The Planetary Greenhouse Engine Revisited
Chris - Thanks for the feedback! I think we are coming at the problem from two different directions... Literally. 1 - I argue that the planetary radiative balance is a result of the energy in vs. energy out of a sphere that encloses the entire planet plus its atmosphere. I think we should agree on this... 2 - This large sphere can be looked at a series of spheres defined by different emission wavelengths - all co-located at a radius that encloses the planet and its atmosphere. 3 - Each of these spheres will have a flux distribution mapped to its surface dependent on the properties of the planet and atmosphere below it - keep in mind day/night, hemispheric and geographic variations... 3 - Now 'shrink wrap' each of these spheres - by this I mean reduce the radius until any further radius reduction would change the flux distribution. Now allow the spheres to locally deviate from a sphere and continue the 'shrink wrap' This set of surfaces should define the radiative balance of the planet. 4 - The temperature profile of the atmosphere below these surfaces would be modeled using the 'shrink wrapped' surfaces as starting point. I understand this adds exceptional complexity, and should achieve the same results... Changing the point of view like this is important though. If you think of an Earth-like planet (~1 atm surface pressure, with ~15C average surface temperature) with a 100% cloud deck - to make it like Venus (please ignore albedo effects - we will hold that constant anyway.) Now use this method of modeling the atmospheric temperature downward to the surface - so far so good... Now remove ~65 km of dirt and replace it with atmosphere in a way that maintains pressure and temperature profile of the previous atmosphere above the former surface level. Perform the calculations again down to the new surface - you will find a very high surface temperature... Looking at the planetary surface as a 'zero point' is an anthropocentric point of view - some planets might not even have surfaces... -
John Hartz at 06:12 AM on 20 June 2011The Climate Show 14: volcanoes, black carbon and Christy crocks
@John Cook: You'll look a lot better if you don't lean into your screen so much. -
Camburn at 06:03 AM on 20 June 2011Linking Extreme Weather and Global Warming
DB: Yes, I know the Fram is more important than the Nares. But the Nares is open this year much earlier than normal, so it is allowing one more exit path for the ice.Response:[DB] THe Nares Strait ice bridge is now gone but the Strait itself is still blocked. At this time in 2010 the Strait was indeed open but not at this time this year.
-
SteveS at 05:35 AM on 20 June 2011How would a Solar Grand Minimum affect global warming?
Camburn@59: The paper looks interesting to me and I look forward to reading it (but family's in town, so it might take a while to get to it). However, I think the take-away from the paper (at least as far as this topic is concerned) is likely to be in the section about climate change: "Despite these uncertainties in solar radiative forcing, they are nevertheless much smaller than the estimated radiative forcing due to anthropogenic changes, and the predicted SC‐related surface temperature change is small relative to anthropogenic changes." -
Trueofvoice at 05:30 AM on 20 June 2011How would a Solar Grand Minimum affect global warming?
The deniers scorn the idea scientists can accurately project future temperatures, yet they immediately accept a projection on solar activity as settled fact. I get the feeling they cherry pick the data they want to believe, bu I must surely be wrong. -
Eric (skeptic) at 04:52 AM on 20 June 2011Linking Extreme Weather and Global Warming
Tom, my evidence is the text in bold in #57 which do not lend strong support for the "extreme El Nino from AGW " hypothesis. The statistics you quote in bold are completely insufficient to reject the null hypothesis: that extreme ENSO is natural. In the paper you quoted "during the 1600s ENSO appears to have weakened, coincident with the height of the commonly defined Little Ice Age" (my bold) there is no discussion of cause and effect in the cold period: some of the cold was due to lack of El Nino and that lack was due to longer term dynamic trends. For those trends, see this paper http://www.nature.com/nature/journal/v420/n6912/full/nature01194.html?free=2 where they state "The Holocene is characterized by increasing ENSO event frequency towards the present." That is a natural trend and there in no suggestion in that paper that warming causes El Nino although they don't cover extreme El Nino. Also I don't see a quantity expressed for percentage of extreme El Nino in Gergis and Fowler. If extreme El Nino is 10%, then that is much weaker support (for the AGW - extreme El Nino hypothesis) than 1% or 0.1% -
David Lewis at 03:54 AM on 20 June 2011Geologists and climate change denial
The situation among geologists isn't all bad. Dr. Bryan Lovell, President of the Geological Society of London and former senior executive of British Petroleum, in his book, Challenged by Carbon, argues that geologists can find evidence in a form most convincing to them, i.e. in the rocks, that the dramatic anthropogenic alteration of the Earth's atmosphere now underway has an historical analogue in the PETM and he warns that civilization must not allow this situation to continue. He writes about how it was that the European oil companies came to support nations signing the Kyoto agreement as opposed to US companies who continued on funding the climate science denial campaign. See: http://theenergycollective.com/david-lewis/47403/oil-industry-insider-expos-what-it-took-wake-some-them-climate Lovell's mantra is "you can't argue with a rock", a phrase which presumably has resonance with geologists. Refer recalcitrant geologists to this book the next time you are faced with one who denies climate science - the Geological Society of London is the largest such society in Europe and the oldest in the world. On another point: I would like to add to the famous quote from Richard Feynman (The Pleasure of Finding Things Out page 142) i.e: "I believe that a scientist looking at nonscientific problems is just as dumb as the next guy - and when he talks about a nonscientific matter, he will sound as naive as anyone untrained in the matter" I would change this to: Scientists looking at problems outside their own field of expertise can be just as dumb as the next guy, as illustrated by some geologists. But we can point to some climate scientists to confirm this as well. For instance, I think some of James Hansen's opinions, most notably when he said for publication at the peak of the most intense media spotlight climate change has ever experienced during the Copenhagen negotiations that he hoped the negotiations would fail, because his opinion was not about climate science but was about politics and the likely effect of cap and trade vrs a carbon tax, also illustrate my modification of Feynman's statement. For that matter, your own (John Cook's) statements on nuclear power in your recent book Climate Change Denial illustrate this point. How else can we explain what is published in that book in your brief critique of nuclear power? (see: http://www.skepticalscience.com/Climate-Change-Denial-book.html comment 25. -
Camburn at 03:46 AM on 20 June 2011Linking Extreme Weather and Global Warming
Albatross: The link you posted to river trends is really about worthless. I can only suggest that you research the long term Mississippi River basin discharges. You will find that there is a cycle on a long term basis. The same applies to the Nile River. People are suggesting extreme events are a somewhat recent occurance? How about the floods of the Mississippi River in the 1920's? The recent floods did not break those records. Or the heat waves and fires in Russia when Tchaivosky was creating beautiful music. There have been extreme weather events always. That is the nature of a chaotic climate, which we have. I have not read reliable data from any source that we are experiencing anything that is abnormal. I am very interested in facts and truths. I am not interested in inuendo. As far as Arctic Ice......here is a long term perspective. A Truely climatic perspective. http://paleoforge.com/papers/EnvironArchaeo.pdf The Nares straight opened yesterday, and that will allow ice to freely leave the Arctic. My prediction for Arctic Ice for 2011 summer low still stands at 3.50. Is this an extreme? Yes, on a short term basis it is, but on a climatic basis it appears that it isn't.Response:[DB] Your linked source is missing p. 114. Also, most ice export from the Arctic Ocean is through the Fram, not the Nares. And if you base your closing sentence upon your linked source, then you are reading into it more than what it says. Considering that this is about the 6th or 7th time you've posted it, you may want to make sure your understanding of it is up to par.
-
Albatross at 03:33 AM on 20 June 2011Linking Extreme Weather and Global Warming
Norman @ 25 and fellow 'skeptics' and contrarians, You continue to cherry pick and ignore the overwhelming and collective body of evidence out there. And one paper for one region of the planet does not make your case concerning a global phenomenon, that is why we look at the body of evidence across many disciplines (a.k.a consilience). I, and others, have repeatedly directed you to papers which have objectively and quantitatively found an increasing trend in heavy rainfall, droughts and heat waves around the globe. Indeed there is already research, (see here) suggesting that the hydrological cycle may be accelerating/intensifying, as work by suggests. This thread has become yet another example of "skeptics" demonstrating that they are not at all interested in the facts and truth, but deliberately seek out those data and interpretations of data that suite their preconceived bias. That is not true skepticism, and it is not good science. And talking of extreme events, I would be surprised if "skeptics' were to try and argue that the recent dramatic and accelerating loss of Arctic sea ice doe snot constitute an extreme event in its own right. In fact, that assertion is supported by the findings of Polyak et al. (2010). -
Camburn at 03:33 AM on 20 June 2011How would a Solar Grand Minimum affect global warming?
This is an interesting paper that shows what more we need to know. http://scostep.apps01.yorku.ca/wp-content/uploads/2010/07/Gray_etal_2009RG000282.pdfResponse:[DB] Per the Comments Policy:
"No link or pic only. Links to useful resources are welcome (see HTML tips below). However, comments containing only a link will be deleted. At least provide a short summary of the content of the webpage to facilitate discussion (and show you understand the page you're linking to). Similarly, images are very welcome as they can be very useful in explaining the science. But comments with pictures in isolation without explanation will be deleted."
Be advised.
Additionally, per KR's comment, the paper shows that we already know much more than we did just 20 years ago. And that replicating the observed warming without the AGW component is impossible.
-
actually thoughtful at 02:52 AM on 20 June 2011The Climate Show 14: volcanoes, black carbon and Christy crocks
The screen capture (with the play button over his eye) makes John Cook appear to be Borg from Star Trek. It isn't a bad look....Response: [JC] What does it tell you if a borg implant improves my appearance? -
Bob Lacatena at 02:01 AM on 20 June 2011Linking Extreme Weather and Global Warming
54, Eric, Again, your latest study is simply looking at short time frames (1949–2005) in one locality (U.S.) in a regime that really predates the bulk of climate change (since we haven't even gotten there yet!). No matter how many papers you trot out demonstrating a snowfall pattern in the past 30-60 years, they're not going to be representative of snowfall changes over longer periods and more dramatic climate swings. Did you read up on Hadley Cells (to understand one important mechanism that underlies the problem)? Here's another thing to consider... a NY Times article on a scientist's proposition that climate change could cause colder North American winters (and with them, more snow further south than has been usual). My main point is that the problem is more complex than any simple kitchen logic will resolve, and there will be different answers for different regions because wind, circulation, and precipitation patterns may all change in unexpected ways, leading to more or less snowfall in various areas. -
jerryd at 01:39 AM on 20 June 2011CO2 Currently Rising Faster Than The PETM Extinction Event
KR - To be honest, this has been very illuminating for me also. I had never heard of "Skeptical Science" before a few days ago when I accidentally clicked Rob's article when searching for something else. I discuss and argue these things with my friends and colleagues all the time, but didn't really think anyone outside our small circle was terribly interested. It's not like the topic will show up on Letterman, although Lee has an article coming out in Scientific American shortly, so who knows ... I think you can access my initial submission (and all the comments, including the imagine harder quote from Lee) as follows: 1. http://www.clim-past-discuss.net/papers_in_open_discussion.html 2. click "most commented papers" 3. third one down I've also sent a copy to John (per previous post) and maybe we can set this into some sort of tutorial for everyone to comment on. Jerry -
KR at 01:09 AM on 20 June 2011CO2 Currently Rising Faster Than The PETM Extinction Event
jerryd - "It's from a paper that should come out in the next month or so in Climates of the Past. Maybe there is a way I can send the figure and paper to this site?" Anything you can point us to, such as a link to the paper, would be great, Jerry. Speaking just for myself, I've found this discussion extremely illuminating! It's always great to hear from someone working with primary data. I had been thinking about the "Antarctica peat" idea, but I suspect you're quite right about the mass balance not supporting that as a major contributor. -
Chris Colose at 01:07 AM on 20 June 2011The Planetary Greenhouse Engine Revisited
guinganbresil, Your post #16 is really just full of assertions rather than any physics that can be usefully implemented in radiative transfer modeling. To treat even an Earth-like atmosphere radiatively can involve treating it as a stack of many near isothermal layers, with the temperature and absorber distribution as well as scattering. The upper atmosphere matters, but you can't just insert a cloud deck and watch the temperature soar to 735 K. Actually, in simplistic layer models with one blackbody absorbing layer, the surface temperature is constrained to be no more than the emission temperature multiplied by 2^0.25. This is especially the case where those clouds also make the albedo very large, and to first-order, offset their greenhouse effect. In post 17, there's no reason parcels of air will become bouyant, since the atmosphere will relax into a temperature required to eliminate convection. Also note that the equation for adiabatic lapse rate is not a function of the IR absorption Of course not, because in deriving that formula you turn off radiation. -
dana1981 at 00:44 AM on 20 June 2011The Climate Show 14: volcanoes, black carbon and Christy crocks
Thanks for giving me credit too, John. First time ever I've been called a "bloke"! -
Bob Lacatena at 00:42 AM on 20 June 2011Phil Jones - Warming Since 1995 is now Statistically Significant
178, jatufin, In the misquoted words of Darth Vader, as he tried to line up young Luke Skywalker in his sights and save the Death Star from total destruction:The Dunning-Kruger is strong in this one!
And then he blew poor Skywalker's x-wing fighter to little bits, and the Empire ruled the galaxy for the next 1,000 years. -
Bob Lacatena at 00:35 AM on 20 June 2011CO2 Currently Rising Faster Than The PETM Extinction Event
48, jerryd,With Lee, a classic exchange: "Lee, this is really hard to imagine; Jerry, you need to imagine harder."
This is a fabulous quote, and maybe should be put on a poster for all scientists, as well as anyone interested in climate science -- since both sentiments are keys to solving scientific problems and riddling our way towards the truths, and at the same time doing so in a congenial spirit of adversarial-cooperation. Interestingly, the climate debate is replete with this exact scenario and pair of opposing behaviors, with each component present in due proportion (understand the boundaries, and find the occasional, unexpected ways around them). -
Rob Painting at 23:11 PM on 19 June 2011Linking Extreme Weather and Global Warming
Generally, La Nina (now finished I guess) gives NZ wetter and warmer weather, and El Nino; dry and cool. Last winter was slightly above average, temperature wise. You can find the data at NIWA, but they don't compare the months to the long-term records, which is a bit useless. -
jerryd at 22:39 PM on 19 June 2011CO2 Currently Rising Faster Than The PETM Extinction Event
Rob, Laughing ... one of my favorite movies. The coal argument is an interesting one, but I think very much a "red herring" considering mass balance. The total amount of coal in strata of all ages is <20,000 Gt (Höök et al., Fuel, 89, 3546-3558, 2010). So, I find it difficult to suggest (without a long path through the chocolate factory) that the little bit of coal preserved in late Paleocene rocks, while greater than during some time intervals, is somehow meaningful. Received the email from John Cook and will pass along the paper and figure as it was originally posted on the EGU "open access" journal web site. I don't think there are any copyright issues this way (the final paper is slightly different, because of some corrections). Will be fun to see what people think. Jerry -
Bern at 22:25 PM on 19 June 2011The Climate Show 14: volcanoes, black carbon and Christy crocks
Speaking of long-term trends, has anyone charted the length of The Climate Show per episode? There certainly seems to be a strong recent upward trend, but whether it's statistically significant... :-P Another good show. 'Watched' it while doing some noise modelling work (gotta love dual-screen setups...) -
Rob Painting at 21:58 PM on 19 June 2011CO2 Currently Rising Faster Than The PETM Extinction Event
Jerryd - "I think the press releases for the forthcoming paper by Cui et al. (Nature Geoscience, 2011) initiated this thread." Yup, but I have read the paper. Cui 2011 "imagine" that the Late Paleocene was a 'coal giant'. Maybe you need some of this Jerry? The attraction of the paper was that it was the latest attempt to constrain the rates of carbon release during the PETM. I kinda preferred the organic carbon scenario (warts n'all) because it implied our current emissions weren't quite so bad. And yes, we'd be very interested in your latest paper. John Cook has sent you an e-mail I believe. -
jerryd at 21:28 PM on 19 June 2011CO2 Currently Rising Faster Than The PETM Extinction Event
scaddenp -- jerry - what about multiple event scenario? Elevated carbon in atmosphere, then volcanism in sedimentary basin releasing a spike big enough to trigger hydrate release at poles. With low pole - to equator gradient, the feedbacks release hydrate world wide. On longer term, the elevated temperatures speeded up methane production from sedimentary reservoirs (which are huge by comparison to surface carbon reserves). (This latter is what colleague is pursuing). This is, I think, close to the correct answer. I have made a figure showing how I think things work in the Early Paleogene. It's from a paper that should come out in the next month or so in Climates of the Past. Maybe there is a way I can send the figure and paper to this site? (I am traveling through Europe right now so cannot post on my home site easily). Then, you all can have fun finding the holes and problems in my logic. Jerry -
jatufin at 21:04 PM on 19 June 2011Phil Jones - Warming Since 1995 is now Statistically Significant
I have one quite close person, who is intelligent and in many ways open minded. And despise of his lack in education his understanding of scientific matters is well beyond layman. Still he insists, he can trisect an angle with a compass and a straightedge. He is in complete denial about mathematics, which show you can't do it. Neither can he produce any viable proof of the process for scrutiny. It's all about "the conspiracy of the high educated". -
jerryd at 19:47 PM on 19 June 2011CO2 Currently Rising Faster Than The PETM Extinction Event
Tom -- it all comes down to mass balance. There is no way to change the isotopic composition of the huge mass of carbon in the ocean by adding something of similar composition. This gets back to the pool and paint analogy. You have a large swimming pool of very light pink colour (d13C of ~1 per mil). You can add pretty much as much white or light pink as you want (d13C of 0-2 per mil), and the pool gets more full, but the colour does not change very much. You need to add something very red (d13C of -25 to -80 per mil), and still quite a bit, to get the pool to change colour. Following the previous post, Kurtz et al. (Paleoceanography, 2003) did the carbon mass balance exercise for the early Paleogene. They tried to drive the late Paleocene carbon isotope high and the early Eocene low as well as the PETM through formation and burning of peat. It's a very cool idea ... except there is a problem when one looks carefully at the masses involved. The +1 d13C excursion necessitates the storage of about 60,000 Gigatonnes of carbon in peat during the late Paleocene. (Note, this would be storage in a transient surface reservoir -- think of this as a hot tub on the side of the pool. It would not be burial, because the carbon needs to return to the exogenic carbon cycle in the early Eocene to drive PETM, other hyperthermals, and the long-term drop in d13C). The problem concerns the mass. The entire terrestrial biosphere, including soil, humus, peat, plants (and newts) at present-day is on the order of 2000-3000 Gt C. So, if this is the explanation, then one needs to imagine a terrestrial carbon reservoir radically different than present-day (more specifically, at least 5-10 times larger). I think the press releases for the forthcoming paper by Cui et al. (Nature Geoscience, 2011) initiated this thread. If you read the paper, you will see that they touch on this problem toward the end. More specifically, the authors suggest an input of 12,000 Gt C from land to cause the d13C excursion across the PETM; they then note that this is tremendously large compared to terrestrial pools at present-day. I have hassled Lee Kump and Rob DeConto about this mass balance problem (both are friends). With Lee, a classic exchange: "Lee, this is really hard to imagine; Jerry, you need to imagine harder." -
JMurphy at 19:35 PM on 19 June 2011Linking Extreme Weather and Global Warming
Thanks for the info, Rob. Seems to be isolated areas, rather than whole regions or countries, so far ? Any idea what it was like this time last year, or the previous one - if this is not too much off-topic. -
Paul D at 19:31 PM on 19 June 2011The Climate Show 14: volcanoes, black carbon and Christy crocks
Thanks for the applause and compliments :-) -
Rob Painting at 19:18 PM on 19 June 2011Linking Extreme Weather and Global Warming
JMurphy -"I haven't noticed anything to do with abnormally cold temperatures in the Southern Hemisphere"
Brisbane, Australia has been cold by all accounts. Just ask John Cook! In contrast, just across the ditch here in northern New Zealand it was 21 °C yesterday and nudging 20°C today. In the thick of winter! Looks like they're getting the "normal" cold further south in NZ though. -
jatufin at 19:02 PM on 19 June 2011Phil Jones - Warming Since 1995 is now Statistically Significant
165 I would call a man with PhD in his field some frantic hobbyist :) Einstein might has been outsider of the scientific community, but he was very aware of the works of others. He himself stressed intuition, logics and 'inner view'. But the real ground breaking thing, General Relativity (1916) is based on some very serious (and tedious) mathematics. It is also a work of some strange and ultimately genius person, with extraordinary inner view... Maybe one could do great things as hobbyist. But at least you should learn the language professionals use, so you work could be criticized. If your day job is in McDonalds' is rather irrelevant. -
JMurphy at 18:51 PM on 19 June 2011Linking Extreme Weather and Global Warming
With regard to cold Winters, I haven't noticed anything to do with abnormally cold temperatures in the Southern Hemisphere so far his year. I remember that the last couple of years had various local or regional unusual cold periods down there (especially in South America) which were highlighted by some posters as an indication of a coming 'ice-age' but I am more interested in whether there is some sort of link between cold spells in the Northern and Southern Hemispheres, because the UK had two cold spells over the last two Winters too. If there is a link, I look forward to a nice mild Winter again. Or, at least (because it was only really December that was cold here), a milder run-up to Christmas. If there is no link, who knows what the Winter will be like ! -
jerryd at 18:33 PM on 19 June 2011CO2 Currently Rising Faster Than The PETM Extinction Event
The long-term benthic foraminifera carbon isotope record for the Cenozoic is published in Zachos et al. (Science, 2001). An updated benthic foraminifera oxygen isotope record was published in Zachos et al. (Nature, 2008) but without the paired carbon isotope record; however, Jim has put the data on his web site (go to http://es.ucsc.edu/~jzachos/Publications.html, and then to 2008 publications). Interestingly, The first really nice long-term carbon isotope record for the Early Cenozoic was published by Shackleton and Hall (DSDP, 84, 1984). It can be downloaded at: http://www.deepseadrilling.org/74/dsdp_toc.htm The age axis is bit off in the above works, but not by too much. In any case, you will see that, from about 62 to 58 Ma, the d13C of the ocean (~exogenic carbon cycle) increased by ~1 per mil. Then, from about 57 to 52 Ma, the d13C of the ocean decreased by about 2 per mil. The peak in long-term temperature (the EECO) occurs at the end of the drop. Superimposed on the fall in d13C are the carbon injections related to the hyperthermals (i.e., the PETM occurred about half way along the drop). Assuming that the long-term and short-term d13C excursions are related, there is really only one way to explain things. Massive amounts of organic carbon were stored somewhere in the Late Paleocene (this preferentially removes 12C, increasing the d13C of the ocean); this carbon returned to the ocean, sometimes sporadically, during the latest Paleocene-early Eocene. The ideas in both Rob's and Andy's abstracts are appealing in this respect. Store a bunch of peat or gas hydrate, and then return it. However, I think the peat idea has some serious mass balance problems. -
Gwinnevere at 17:42 PM on 19 June 2011The greenhouse effect is real: here's why
Hello (no41) MoreCarbonOK; Yes. It is definitely man-made. The reason that any one of us — capable of performing basic calculations in mathematical physics (apart from reading the many convincing linked/argued documentations in Skeptical Science on the many details from many research groups) — can know why we certainly are on the right path in addressing Global Warming to Anthropogenic causes, is this one — please, MoreCarbonOK, and do tell your friends about it too: With a general human evolution of technology (illustrating image as below, details in AGW, the energy curve basic function as y=a[1–1/(1+[x/b]^n)], n=2, its derivative gives the effect [power] transient [ocean heat absorption, value 0,878 W/M² period 2000-2010, fairly in accord with other sources (Hansen group 2005), also in line with a more simple evaluation from Stefan-Boltzmann-radiation law, provided a correct interpretation], its integral gives the carbon-dioxide concentration [yielding a 98% match with measured values up to 2009, and further], both latter as long as t is added by fossil-carbon)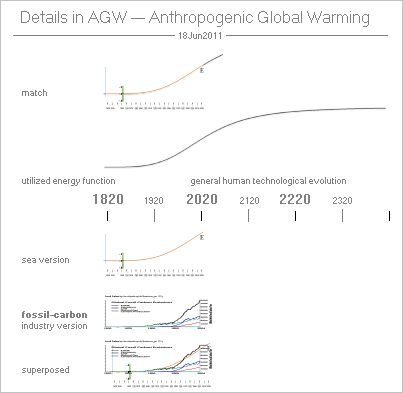 Fossil-Carbon curve (black) from WIKIMEDIA COMMONS and RENEWABLE ENERGY — Critical Evaluation of the U.S. Renewable Energy Policy, 2009, respectively
http://commons.wikimedia.org/wiki/File:Global_Carbon_Emission_by_Type_to_Y2004.png
http://www.renewableenergy.typepad.com/
it is IMPOSSIBLE to omit an additional temperature component (t) from a general fossil-carbon combustion temperature (T) from an emitted (combusted) amount (m) of the fossil carbon into the local atmospheric mass locale (M), account taken upon a general emissivity or absorption coefficient (a), simply expressed as
t/T=a(m/M) giving t = Ta(m/M)
[Temperature and Energy are proportional — as in the familiar General Gas Law: pV=kT=E giving T=E/k].
With account taken for thermal resistance
(R=t/P, P the irradiating power from the Sun: t catalyzes a thermal resistive increase from the already given irradiating Solar power)
the expression enhances to yield for a double
t := 2Ta(m/M)
[Of course, as long as a T exists (for fossils roughly around 2000-2200 °C), also a t inevitably will follow. But with no T (or a very low negligible value of it), also no t will be added: zero AGW].
With the given industrial fossil-carbon curve and its adopted mass-scale to fit the general energy-curve (E), m/t can be calculated [adopted value from 2005 as (average yearly scale base) 10.17094 T12 KG/°C, T for 10^+, with the reported yearly ca m=7 T12 KG fossil carbon to the measured total GW of ca t=+0.7°C], and (with a general Earth-based a=0.7, meaning ca 0.3 albedo) also M can be calculated [value 3.52138 T16 KG to be compared to the total atmospheric EarthM=5.3 T18 KG].
With simple figures [density at STP (Standard Temperature and Pressure) everywhere the same] M holds only at most h=60 meters above the solid Earth-surface to account for the measured t(AGW)-curve
— which (hence) excludes any AGW-debate on higher lying atmospheric layers (type Christy’s arguments, but also Lindzen’s »climate sensitivity»): these may (and do) contribute, but have no significance in the AGW-basics.
With a 50 pixel graphical square unit to draw from, and taking a more or less »simple» ocean (two-complex) period of type (cosx)+(cos3x) [coefficients must be added to get a scaling match to the other given curves] together with the basic t|E-smoothed fossil-carbon component, in all
y = 6[1-1/(1+[x/10]^4)] + 0.222(0.9[(2cos (pi x/1.48)) + 0.5(cos (3pi[x-0.1]/1.48))]),
or the corresponding now-year-based connection as
t(NASA)
= –0.4
+ (1.765)[1–1/(1+[(YEAR–1815)/212.7]^4)]
+ 0.0653(0.9[(2cos pi (YEAR–1880)/31.48)+0.5(cos 3pi[YEAR–1880-0.1]/31.48)])
we have the dotted (5) from the already known and well recognized sources (as) in
http://www.universumshistoria.se/AAAPictures/AGW1.htm
[The NASA-curve is reduced to 65% horizontally to match the time scale of Fossil-Carbon; The Fossil-Carbon vertical scale is then reduced to 33% to match (a closest possible approximation to) the (t|E)+(SeaPeriod) = NASA-curve vertical scale].
And as we clearly can see, the predictive power is unmistakable — however no account taken upon additive (radiative forcing) components (making the figure even worse); There is, obviously, only one known agent to account for the measured Global Warming:
industry. Safely. Exactly. Precisely.
While humanity is bound to the E-part of the t|E-function, it is necessarily not so to the t-part if, and only if, a solution is found in reducing the fossil energy source. (Meaning: we cannot stop human evolution, but possibly we can find another energy source than fossils to feed our [unstoppable] technological evolution, thereby removing a further t-increase).
Christy and Lindzen give wrong arguments (causing public chaos) because they do not account for the (unnoticed but simple) math-base (t/T-form) making up (an unmistakable equivalent to) the measured NASA-curve: the industrial fossil-carbon driving the whole (land-marine max height=60 meter) measure.
Radiative Forcing high above the Earth surface is explicitly not within the basic AGW-proof (the t/T-form giving a max h=60M), and therefore makes no contribution to the clarification of the AGW-quest itself. (Debates on the subject, not distinguishing the different aspects, make dead-end discussions).
AGW is no natural variation.
Hence, AGW cannot be explained by the general math referred to as Arrhenius’ expressions (often termed »radiative forcing» and associated with the higher atmospheric layers).
To explain (mathematically) for AGW, hence, a strict isolated mathematical-physical complex must be found (»no Arrhenius math»), including all the seven (7) known ingredients to the observed (A)GW-complex [and too, it must include »Arrhenius curves» as a special case if given specific offsets — so is also the case, indeed]. That is what the simple t/T-connection does — with a seemingly fine alignment to already presented figures.
wkg/Gwinnevere
Fossil-Carbon curve (black) from WIKIMEDIA COMMONS and RENEWABLE ENERGY — Critical Evaluation of the U.S. Renewable Energy Policy, 2009, respectively
http://commons.wikimedia.org/wiki/File:Global_Carbon_Emission_by_Type_to_Y2004.png
http://www.renewableenergy.typepad.com/
it is IMPOSSIBLE to omit an additional temperature component (t) from a general fossil-carbon combustion temperature (T) from an emitted (combusted) amount (m) of the fossil carbon into the local atmospheric mass locale (M), account taken upon a general emissivity or absorption coefficient (a), simply expressed as
t/T=a(m/M) giving t = Ta(m/M)
[Temperature and Energy are proportional — as in the familiar General Gas Law: pV=kT=E giving T=E/k].
With account taken for thermal resistance
(R=t/P, P the irradiating power from the Sun: t catalyzes a thermal resistive increase from the already given irradiating Solar power)
the expression enhances to yield for a double
t := 2Ta(m/M)
[Of course, as long as a T exists (for fossils roughly around 2000-2200 °C), also a t inevitably will follow. But with no T (or a very low negligible value of it), also no t will be added: zero AGW].
With the given industrial fossil-carbon curve and its adopted mass-scale to fit the general energy-curve (E), m/t can be calculated [adopted value from 2005 as (average yearly scale base) 10.17094 T12 KG/°C, T for 10^+, with the reported yearly ca m=7 T12 KG fossil carbon to the measured total GW of ca t=+0.7°C], and (with a general Earth-based a=0.7, meaning ca 0.3 albedo) also M can be calculated [value 3.52138 T16 KG to be compared to the total atmospheric EarthM=5.3 T18 KG].
With simple figures [density at STP (Standard Temperature and Pressure) everywhere the same] M holds only at most h=60 meters above the solid Earth-surface to account for the measured t(AGW)-curve
— which (hence) excludes any AGW-debate on higher lying atmospheric layers (type Christy’s arguments, but also Lindzen’s »climate sensitivity»): these may (and do) contribute, but have no significance in the AGW-basics.
With a 50 pixel graphical square unit to draw from, and taking a more or less »simple» ocean (two-complex) period of type (cosx)+(cos3x) [coefficients must be added to get a scaling match to the other given curves] together with the basic t|E-smoothed fossil-carbon component, in all
y = 6[1-1/(1+[x/10]^4)] + 0.222(0.9[(2cos (pi x/1.48)) + 0.5(cos (3pi[x-0.1]/1.48))]),
or the corresponding now-year-based connection as
t(NASA)
= –0.4
+ (1.765)[1–1/(1+[(YEAR–1815)/212.7]^4)]
+ 0.0653(0.9[(2cos pi (YEAR–1880)/31.48)+0.5(cos 3pi[YEAR–1880-0.1]/31.48)])
we have the dotted (5) from the already known and well recognized sources (as) in
http://www.universumshistoria.se/AAAPictures/AGW1.htm
[The NASA-curve is reduced to 65% horizontally to match the time scale of Fossil-Carbon; The Fossil-Carbon vertical scale is then reduced to 33% to match (a closest possible approximation to) the (t|E)+(SeaPeriod) = NASA-curve vertical scale].
And as we clearly can see, the predictive power is unmistakable — however no account taken upon additive (radiative forcing) components (making the figure even worse); There is, obviously, only one known agent to account for the measured Global Warming:
industry. Safely. Exactly. Precisely.
While humanity is bound to the E-part of the t|E-function, it is necessarily not so to the t-part if, and only if, a solution is found in reducing the fossil energy source. (Meaning: we cannot stop human evolution, but possibly we can find another energy source than fossils to feed our [unstoppable] technological evolution, thereby removing a further t-increase).
Christy and Lindzen give wrong arguments (causing public chaos) because they do not account for the (unnoticed but simple) math-base (t/T-form) making up (an unmistakable equivalent to) the measured NASA-curve: the industrial fossil-carbon driving the whole (land-marine max height=60 meter) measure.
Radiative Forcing high above the Earth surface is explicitly not within the basic AGW-proof (the t/T-form giving a max h=60M), and therefore makes no contribution to the clarification of the AGW-quest itself. (Debates on the subject, not distinguishing the different aspects, make dead-end discussions).
AGW is no natural variation.
Hence, AGW cannot be explained by the general math referred to as Arrhenius’ expressions (often termed »radiative forcing» and associated with the higher atmospheric layers).
To explain (mathematically) for AGW, hence, a strict isolated mathematical-physical complex must be found (»no Arrhenius math»), including all the seven (7) known ingredients to the observed (A)GW-complex [and too, it must include »Arrhenius curves» as a special case if given specific offsets — so is also the case, indeed]. That is what the simple t/T-connection does — with a seemingly fine alignment to already presented figures.
wkg/Gwinnevere
-
guinganbresil at 17:10 PM on 19 June 2011The Planetary Greenhouse Engine Revisited
"An adiabatic lapse rate only needs to develop by convection where air parcels at the surface become buoyant with respect to the air above it. In an infrared transparent atmosphere with no sources and sinks of energy, convection would eventually give out and the tropopause would migrate to the surface, developing a deep isothermal region." This is a very one-dimensional view... A planetary atmosphere is on a sphere illuminated by a sun - resulting in heat sources and sinks from differences in insolation from day to night and season to season. The natural state of a non-trivial planetary atmosphere has a lapse rate in the troposphere. In this imagined isothermal atmosphere, any vertical movement of parcels of 'air' would necessarily result in a change in internal energy, and heat transfer to or from the parcel - moving the temperature distribution toward the expected temperature lapse rate. In other words, this isothermal atmosphere can only me maintained if there is no vertical exchange in the atmosphere. Also note that the equation for adiabatic lapse rate is not a function of the IR absorption - monotonic gases like Argon still have a significant adiabatic lapse rate. -
trunkmonkey at 16:58 PM on 19 June 2011CO2 Currently Rising Faster Than The PETM Extinction Event
scaddenp Doesn't explain dC13. Not a really great idea. Pretty much untestable even if it were. Just threw it out in the spirit with several other folks thinking outside the box. -
Rob Painting at 16:56 PM on 19 June 2011Linking Extreme Weather and Global Warming
Tom Curtis @ 52 - I'm going to cover a couple of those papers in the next chapter on Amazon drought. The key point, as you mention, is that ENSO variability depends on the mean state of the tropical Pacific. When the tropical Pacific is cool (as in the MWP) the frequency/intensity of ENSO declines (although there still can be some pretty wild swings). When the tropical Pacific is warm then ENSO ramps up. That's what the proxies indicate. -
Tom Curtis at 16:01 PM on 19 June 2011Linking Extreme Weather and Global Warming
Eric (skeptic) @53, looking at Gergis and Fowler, and regardless of when the anthropogenic signal was strongest, the entire twentieth century has been unusually warm relative the the preceding 375 years, and the period since 1940 has been unprecedented in the last 485 years for the tropical Pacific, which was quite cool during the MWP. Consequently the fact is that 43% of extreme events occur in the warmest 21% of the time reconstructed, and that 30% of extreme events occurred in the very warmest 12.8% of the time. Not only that, but the coldest period, also experienced unusually low numbers of extreme events, particularly El Nino's relative to other periods:"Our results are consistent with the conclusions of D’Arrigo et al. (2005) concerning solar/temperature related modification of ENSO behaviour. Periods of inactivity were identified throughout the record; most notably, during the 1600s ENSO appears to have weakened, coincident with the height of the commonly defined Little Ice Age (∼A.D. 1550–1850) and Maunder Minimum (∼A.D. 1645–1715) epochs. Hendy et al.’s (2002) coral Sr/Ca SST reconstruction shows northern Australian SSTs 0.2◦ to 0.3◦C cooler than the long-term average between 1565 and 1700. This corresponds to enhanced La Niña activity in our reconstruction (1520s to 1660s) and a period of relative El Niño quiescence from the 1600s to 1780s."
Consequently it is grossly misleading to suggest that this evidence is based on a correlation over just 30 years; and while, as is true of all empirical evidence, it could be just the result of an accidental correlation, it is likely (>66%) that the correlation between increased tropical SST and increased ENSO activity and intensity is not coincidental. In fact, where it not for the fact that we clearly do not fully understand the mechanisms involved, I would say it is very likely (>90%). If you wish to claim that is not a fair range on our certainty, you need to present some substantial evidence. -
scaddenp at 14:59 PM on 19 June 2011CO2 Currently Rising Faster Than The PETM Extinction Event
truckmonkey, and that explains the dC13 how? Also to create significant amount of C14 would suggest radiating the earth in a way that would be somewhat deadly for all land fauna. -
dhogaza at 14:25 PM on 19 June 2011Linking Extreme Weather and Global Warming
Does anyone have any data showing an increase in snowfall with an increase in winter temperatures?
You're looking too narrowly. The big nor'easters that hit New England are sorta hurricane wannabees that start in the Atlantic off the SE US coast or further south. They then roar north and dump snow when they hit arctic air sitting over NE (or further south). It doesn't matter if winter temps increase, as long as they're low enough for snow to fall. -
Eric (skeptic) at 13:36 PM on 19 June 2011Linking Extreme Weather and Global Warming
Tom (#53), that might be suggestive as the authors state, but post 1970's when AGW was a clearer factor the El Nino & La Nina sample size is very small (can't rule out coincidence). -
Eric the Red at 12:50 PM on 19 June 2011Linking Extreme Weather and Global Warming
Sphaerica, More data showing the relationship between winter temperature and snowfall. This is mainly due to more days above freezing. http://www.cleanair-coolplanet.org/information/pdf/winterindicators_09.pdf Does anyone have any data showing an increase in snowfall with an increase in winter temperatures? -
trunkmonkey at 12:32 PM on 19 June 2011CO2 Currently Rising Faster Than The PETM Extinction Event
jerryd Wouldn't pelagic carbonate(shallow photosynthesizing silicic slab carbonates)be your red and benthic clay carbonates (marls)be your white? It seems photosynthesis is the isotopic filter. Getting way out there even for me, cosmic rays turn nitrogen into carbon 14, which becomes co2 for a half life of 5700 years. After a burst ceases it all decays innocently back to nitrogen (who me?)with paleoclimatologists none the wiser. -
Tom Curtis at 12:18 PM on 19 June 2011Linking Extreme Weather and Global Warming
Further to my 52, here is a bar chart from Gergis and Fowler showing the number and intensities of El Nino and La Nina events for each century over the indicated period. The lack of weak events in the 1500's is probably a function of reduced proxy number and quality in that period, but through out the rest of the record, weak events vary in approximate proportion with strong events, and strong events increase in frequency in the 20th century, the opposite of what we would expect if the change in frequency was an artifact of the proxy record. What the data shows is that with warmer conditions, both El Nino conditions and La Nina conditions become more frequent, and that the stronger events become more frequent relative to the weaker events. Also, the increase of frequency of El Nino events is slightly greater than that for La Nina events.
-
Mike Palin at 12:00 PM on 19 June 2011Who's your expert? The difference between peer review and rhetoric
A measure of the impact of a research article is the number of citations it receives in the peer-reviewed scientific literature. These are imperfect because of the difficulty of separating positive and negative citations (self-citation can be more easily filtered), but such numbers are routinely used to estimate quality of ones work in making a case for promotion or other research assessment exercises. Citations are also used as a measure of the "impact factor" of various scientific journals.
Prev 1633 1634 1635 1636 1637 1638 1639 1640 1641 1642 1643 1644 1645 1646 1647 1648 Next


