


 Arguments


Recent Comments
Prev 1637 1638 1639 1640 1641 1642 1643 1644 1645 1646 1647 1648 1649 1650 1651 1652 Next
Comments 82201 to 82250:
-
John Hartz at 00:22 AM on 29 June 20112010 - 2011: Earth's most extreme weather since 1816?
Dr. Master's report is the basis of the in-depth article: "Climate change hots up in 2010, the year of extreme weather" by Jon Vidal, Environmental Editor, Guardian/UK, June 27, 2011 -
KR at 00:06 AM on 29 June 2011It's the sun
JoeRG - Please see CO2 is not the only driver of climate, and mentally replace "CO2" with "the sun" throughout the article. There are a lot of forcings that affect the climate - when looking at climate change we need to look at what the forcing changes are. TSI changes (as with magnetic storms, and ion counts, and galactic cosmic rays) don't correlate with recent warming. -
KR at 00:00 AM on 29 June 2011Uncertainty in Global Warming Science
Arkadiusz Semczyszak - I don't believe this thread is appropriate to discuss Milankovitch cycles - but you are raising a red herring, a distraction from the subject, by claiming that any uncertainties in the glacial cycle (occurring on a time frame 10's of thousands of years) has anything to do with the current global warming (occurring over the last century). I sincerely hope this red herring is simply an error, and not a deliberate misdirection. --- Ken Lambert - "TSI is a power unit (W/sq.m) - energy/unit time. Integrating it wrt time will give the total energy under the TSI curve between times t1 and t2." And again you look at TSI in isolation, not considering the response of the climate. You are directly asserting a constant imbalance, requiring a constantly changing TSI - and that.is.not.the.case. More properly, you should state that "integrating the imbalance between TSI and TOA radiation wrt time will give the total energy change of the climate" - a much different question, particularly since we know the changes in TSI since the pre-industrial level quite well, and hence must look elsewhere for the imbalance leading to climate change. Moderators - I sometimes feel the need for a 'bit bucket' for arguments that have been refuted a thousand times...Moderator Response: (DB) The TSI/TOA/equilibria bit has indeed been "Point Refuted A Thousand Times" (PRATT); the conclusion is becoming inscapable that KL is purposefully conflating the issue. -
les at 23:47 PM on 28 June 2011Climate half-truths turn out to be whole lies
21 - CBDunkerson "Are we sure he knows what 'scientific malfeasance' means? Cuz... that'd be it." No. That is 'journalistic malfeasance' iz what that'd be. not much science to be had there. -
Ken Lambert at 23:32 PM on 28 June 2011Uncertainty in Global Warming Science
DM #65,66 "If so, it is well worth asking what is the physical mechanism that would mean that TSI affects the climate by long term integrated, rather than direct forcing?" TSI is a power unit (W/sq.m) - energy/unit time. Integrating it wrt time will give the total energy under the TSI curve between times t1 and t2. Energy will be absorbed in the system by two main mechanisms - mass x specific heat x Delta T (temperature increase in water, land, air) and phase change in ice or water at constant temperature (mass x latent heats of ice melt or water vaporization). -
CBDunkerson at 23:09 PM on 28 June 2011Climate half-truths turn out to be whole lies
Hmmm... let's see. In the past Bob Carter has said; "The Climategate files have demonstrated the scientific malfeasance of an influential and internationally well networked segment of the climate research community. A small group of scientists and computer modellers - with the aid of an enormous supporting cast of environmental activists and organisations, self-interested business groups, and crusading journalists - have managed to turn the global warming issue (which in 1990 was an entirely sensible matter to have raised) into the scientific scam of the century, if not the biggest ever." Carter's "Kill the IPCC" article So, Carter claims the people at HadCRUT are guilty of "scientific malfeasance" and "the scientific scam of the century"... and therefor he holds their results above all others? Are we sure he knows what 'scientific malfeasance' means? Cuz... that'd be it. -
Tom Curtis at 22:35 PM on 28 June 20112010 - 2011: Earth's most extreme weather since 1816?
Norman @77 continues to show his double standards when it comes to evidence. In this case he wants to argue that population growth is the cause the increase in disasters, and it is indeed a factor, but not sufficient to explain the entire trend as discussed in 55 above. However, he wants to argue that the trend in geophysical events is less likely to be effected by population growth than is the trend in weather related events. To do this he imagines the trend in geophysical events can be modeled by considering a quake in Los Angeles. In fact the entirety of California is heavily faulted, and quakes come at all levels on the Richter scale. Consequently California's population growth would see more people being likely to be harmed by small quakes, just as the US population growth would leave more people likely to be harmed by weather related hazards. What is more, large weather related hazards, such as a tornado outbreak, are counted as just one disaster even though they may spawn many thousands of thunderstorms and hundreds of individual tornadoes. It is only by assuming that earthquakes are always large, and come only at a very few locations and that weather related disasters are typically small and dispersed that he thinks he can get his argument up, whereas no such distinction exists. -
Kevin C at 22:23 PM on 28 June 2011Climate half-truths turn out to be whole lies
And here's a very similar result from Lean and Rind in GRL. -
Kevin C at 22:09 PM on 28 June 2011Climate half-truths turn out to be whole lies
Here's Tamino's plot of the temperature records with the El Nino, volcanic and solar effects removed: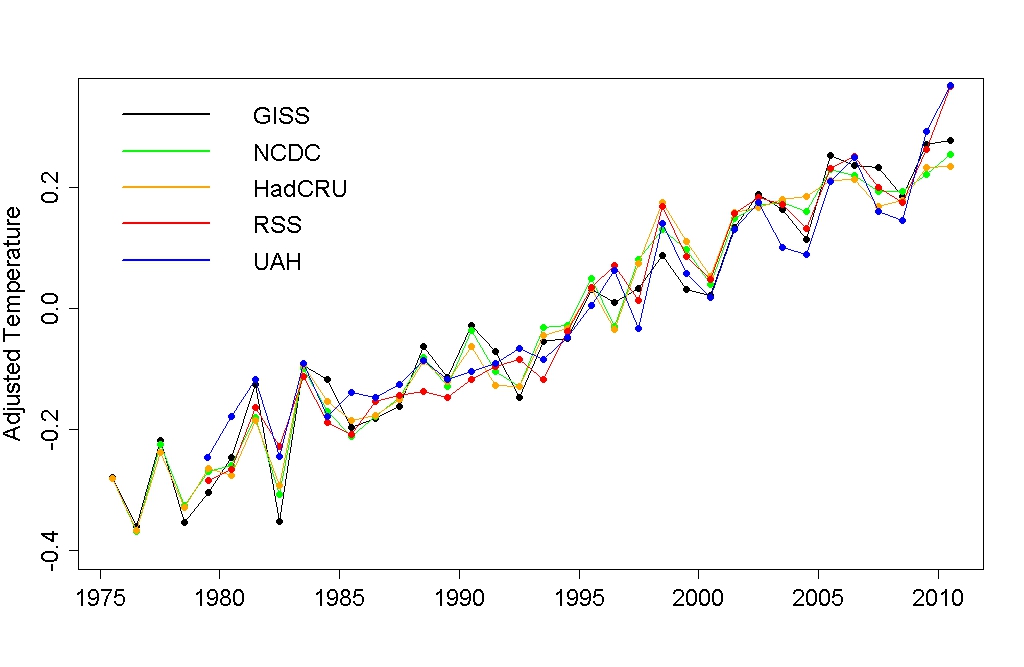 and here is the accompanying article.
-
Norman at 22:07 PM on 28 June 20112010 - 2011: Earth's most extreme weather since 1816?
Tom Curtis @57 I did look at your M. Latif/ Keenlyside paper. There looks to be no obvious trend in the graph from 1870 to 2010. The paper is based upon a model prediction that the ENSO will get much more intense in the future with further warming. It would not explain the increased levels of storms that are thought to be happening at this time. -
Arkadiusz Semczyszak at 22:04 PM on 28 June 2011Climate half-truths turn out to be whole lies
@Marcus I agree with you that now we can not otherwise explain the current temperature increase as the increase of GHG's in the atmosphere ..., ... but do not because, that - NOAA - “ Our understanding of the indirect effects of changes in solar output and feedbacks in the climate system is minimal ” ? This really, so we do not know the functionality of: „the near-centennial delay in climate in responding to sunspots indicates that the Sun's influence on climate arising from the current episode of high sunspot numbers ...” Perhaps it is: “The observed variations may have occurred in association with internal climate amplification (likely, thermohaline circulation and El Niño–Southern Oscillation activity).”, but ..., there is, however, "hard" evidence. Helama et al., 2010. - This is not "cherry picking" - I could cite at least dozens similar papers ... P.S. Milankovic cycles is not present changes - consent - which does not affect the fact that changes in TSI were (probably) very small. -
Norman at 22:00 PM on 28 June 20112010 - 2011: Earth's most extreme weather since 1816?
Tom Curtis @ 55 "There is a significant irony in your pointing to this paper. You have argued that Munich Re data should be ignored because it measures disasters (damaging events) rather than hazards (potentially damaging events). Now you look at a paper and cherry pick the damage done as being significant, while ignoring the clear evidence on the number of events, and that the increase in damaging events is correlated with an increase in hazards. And you now accept a study financed by, and using data from Munich Re because you think it supports your case. Your selective standards could not be more openly displayed." Actually I was not arguing that Munich Re should be ignored because it measures disasters rather than hazards. I was claiming that Munich Re is not an unbiased scientific group and that I do not know how they came up with their graphs. On the hazard vs disaster argument I was claiming that an increase in disasters did not necessarily mean an increase in hazards. I said it could but it did not have to as there are other variables involved. If population number was static and did not move then an increase in disasters would strongly indicate an increase in hazards. A disaster is a hazard that involves people (death and property destruction). If your population grows during the same time period as your graph of disasters it adds a variable that will not allow a clear correlation between hazard and disaster. Here is a link to US population growth since 1960. If you match the Munich Re graph of incresaed storm disasters in US with this graph, do they go up with the same slope? US Population growth since 1960. This can easily explain the increase in weather related disasters vs earthquakes. A large earthquake will be a disaster if if hits a populated area regardless of population growth. If Los Angeles grew in population by 10% it would not increase the disaster of an earthquake in that area, the population growth would not affect that. However if you have population growth in the plains where there are storms (tornadoes, winds, hail). The most severe part of a storm is smaller than the overall cell and if you have more population targets available to hit, the probability of a hazard becoming a disaster goes up. If you have links to actual numbers of severe storms in US over a 30 year period that would be a much better source to determine if weather is getting worse than an indirect approach through disaster charts. Hope this long post clears up my position. Some of my posts are just isolated attempts to answer some specific question posed. -
Eric the Red at 21:40 PM on 28 June 20112010 - 2011: Earth's most extreme weather since 1816?
I would hesitate to extrapolate such a small number so far into the future as the statistical uncertainty is overwhelming. While I cannot verify of refute his El Nino numbers, no one has thus far presented any evidence that the frequency on ENSO events has increased due to global warming. That said, I would refer back to the NOAA link as to the cause of the record snowfall. -
Arkadiusz Semczyszak at 21:39 PM on 28 June 2011Climate half-truths turn out to be whole lies
@ Stefaan Well ... partly the same thing ..., but in that case we can easily compare the 1998 - when there was (temperature) a more quickly decline - from 2010 - but remember that the temperature was far lower base in 1996. -
Marcus at 21:37 PM on 28 June 2011Climate half-truths turn out to be whole lies
[snip]Response: [JC] Ad hom, Marcus. -
Marcus at 21:36 PM on 28 June 2011Climate half-truths turn out to be whole lies
Ark. You're comparing apples & oranges there. The changes in insolation brought about by the Milankovitch Cycle are of a completely different order to those caused by changes in sunspots. My point was simply that, in spite of a very significant downturn in incoming energy-both the oceans & the atmosphere have continued to warm at a significant rate....in spite of attempts by "skeptics" like yourself to cherry pick outliers like 1998 to bolster your increasingly weak position! Now aren't you going to discredit yourself still further by telling us how all environmentalism is fake, because some guy said so in a non-peer reviewed publication? That's your usual stock-in-trade! -
LazyTeenager at 21:30 PM on 28 June 2011Climate half-truths turn out to be whole lies
I find the irony of climate skeptics favoring the hadcrut dataset, when at the same time they have concentrated on trying to discredit the scientists who produced the hadcrut dataset, very amusing. -
Norman at 21:27 PM on 28 June 20112010 - 2011: Earth's most extreme weather since 1816?
actually thoughtful @ 66 Looks like Tom Curtis provides answers to your questions @ post 70. His graph shows number and intensity of both El Nino and La Nina. -
stefaan at 21:14 PM on 28 June 2011Climate half-truths turn out to be whole lies
eum arka if you look to the graph you mentioned guess what you see for the year 1998? -
Arkadiusz Semczyszak at 20:57 PM on 28 June 2011Climate half-truths turn out to be whole lies
@Marcus “... when you factor in the Deep Solar Minimum of this last decade ...” ... which of course has no significant importance against: “... delay in climate response to external forcing (usually estimated at the range 10 - 100 years) ...”; and the fact that: “ If one computes the global and annual mean of solar forcing caused by the 100 kyr period of eccentricity one gets an amplitude of 0.12Wm~2 in the spherical mean. ", “But, despite the tiny global forcing value... ...The global mean temperature changes between glacial and interglacial periods are large: about 20C for polar (Johnsen et al., 1995) and 5 for tropical regions (Stute et al., 1995).” (Beer et al., 2000.). -
Arkadiusz Semczyszak at 20:53 PM on 28 June 2011Climate half-truths turn out to be whole lies
@steffan The temperature globally and regionally, reacts with several months delay (November / December 2010) at the end of El Nino. -
Marcus at 20:07 PM on 28 June 2011Climate half-truths turn out to be whole lies
Um, 1998 wasn't just a strong El Nino-it was the *strongest* El Nino ever recorded. If you want a real feel for the warming which occurred over the 1990's & 2000's-you have to recognize 1998 as the outlier it really was. The average temperature for 1990-2000 was +0.31 degrees above the 1961-1990 average, whilst 2000-2010 was +0.53 degrees above the 1961-1990 average, a change of +0.12 degrees, hardly something that could be ignored-especially when you factor in the Deep Solar Minimum of this last decade. -
skywatcher at 19:49 PM on 28 June 2011Climate half-truths turn out to be whole lies
Keeping it on topic (and not about droughts), it's worth pointing out, in true Phil Jones style, that the warming in the HadCRU dataset has been statistically significant since 1995, and stronly significant over the past 20 or 30 years (as it has in all major climate datasets, global or near-global). So Carter really doesn't have a leg to stand on in suggesting 'it's cooling', unless he wants to paint himself into a very tight corner, given the obvious trend. -
Dikran Marsupial at 19:41 PM on 28 June 2011A journey into the weird and wacky world of climate change denial
Arkadiusz Semczyszak "the current "unbalanced surplus" CO2 in the atmosphere (by us) mainly of natural origin, and absolutely all proxies of the former concentration of CO2 in the atmosphere are affected by a huge mistake." You do not need proxy data to demonstrate that position is untennable. If the rise in atmospheric CO2 were of natural origin, then the natural environment would have to be a net carbon source. If that were true, the annual rise in atmospheric CO2 would be the sum of the natural net annual source plus anthropogenic emissions. If that were the case, the observed annual rise in atmospheric CO2 would be greater than annual anthropogenic emissions. However, it isn't, it is only about half the size of annual emissions (on average), which means the natural environment must be a net carbon sink, not a source, and hence cannot be the source of the observed rise. I'd be happy to discuss that with you on a more appropriate thread, such as this one. -
stefaan at 19:40 PM on 28 June 2011Climate half-truths turn out to be whole lies
@Arka. Indeed there was a strong El Nino during the first half of the year but that was more or less compensated by the La Nina during the last half of the year... -
Arkadiusz Semczyszak at 19:34 PM on 28 June 2011Climate half-truths turn out to be whole lies
@Stefaan “... a very strong El Nino ...” In 2010, too. ... what does not change the fact that the delay in climate response to external forcing (usually estimated at the range 10 - 100 years) will bring us the new records in the next decade. (-Snip-) ... (-Snip-). Eg: ... a drought ... precipitation ... IPCC report : “...the net expected effect on precipitation over land is especially unclear.” (-Snip-)? P.S. (-Snip-)Moderator Response: (DB) Multiple insinuations of impropriety snipped. Be warned, Arkadius. -
les at 18:52 PM on 28 June 2011A journey into the weird and wacky world of climate change denial
10 Arkadiusz - it's a hypotheses. Here's another: They are being strategically wrong and can get away with it because they're outside the core peer review world. Here's a read about being strategically wrong. -
Arkadiusz Semczyszak at 18:39 PM on 28 June 2011A journey into the weird and wacky world of climate change denial
Lewandowsky and Ashley have a lot of reasons. But: 1. Among the skeptics is, however, many active researchers. Eg: Atte Korhola (are here in the photo "looks young") and says: “Unreasonable expectations are placed in the IPCC report.” 2. “... Time to close the phony debate on climate science ...” Polish Professor J. Weiner - among other things, the history of science researcher, and the scientific method - he says that scientific theory must give an answer to the most (seemingly) absurd and unscientific claims. The history of science teaches us that even the most an “innocent attempts” to "... to close the phony debate ..." may to finish the creation of "false science". ... and most eminent scientists (past and present - including Nobel Prize winners), has never been members of the National Academy of Sciences ... 3. I am still far from retirement. I am a skeptic the type d) - the current "unbalanced surplus" CO2 in the atmosphere (by us) mainly of natural origin, and absolutely all proxies of the former concentration of CO2 in the atmosphere are affected by a huge mistake - do not say truth (even in very approximate). 4. “ ... five Hiroshima bombs per second ...” - A lot but also very, very little ... depends on what this size compare. -
JoeRG at 18:24 PM on 28 June 2011It's the sun
First it is to notice that 'solar activity' means quite more than the single value of TSI. Also of importance, but unfortunately on a low level of scientific understanding according to the IPCC, are things like intensities of mass ejections, number and intensity of flares (2003 showed the most and most intense flares in history - what of course could explain the sharp rise of the OHC in 2003), magnetic fux and the interplay between magnetic fields of both earth and sun (we had a decrease of the earth MF of about 10% in the last 100 years while the solar magnetic flux nearly doubled in the same time). Second I wonder why you talk only about the last 35 years. Looking at the graphs in the basic and intermediate sections makes it quite obvious that the former correlation between TSI and temperature was not broken in the 70th but in the mid 40th instead. (Following the correlation would show a temperature level like the current in the mid 60th, but the TSI-level had not reduced significantly, what means that the level was still high until the mid of the last decade. This, of course, depends on the reconstructions that one uses.) From my point of view, it suggests itself that the temperature rise of the last 35 years was not caused by the change in the same time, but by the absence of warming in the area of time before. So, look at these graphs and tell me why only to speak about the last 35 years when the link was broken 30 years before. -
les at 18:15 PM on 28 June 2011Climate half-truths turn out to be whole lies
2 Quartermain: Really, the whole of SkS is an 'article' and research effort; of which this post is a part of a wide range of issues in which factors, including sun-related changes, are discussed. One might suggest that after reading the article research here, you might become skeptical. -
stefaan at 18:14 PM on 28 June 2011Climate half-truths turn out to be whole lies
@Arka, don't forget that 1998 was a year with a very strong El Nino effect! Of course this has a strong effect on the temperature (thats why 2011 is up to today not an extremely hot year because we had still a moderate La Nina active untill may)... -
heystoopid at 18:10 PM on 28 June 2011Climate half-truths turn out to be whole lies
Excellent work, please don't forget to vote in the online poll too. -
Chemware at 18:09 PM on 28 June 2011Climate half-truths turn out to be whole lies
@1, Arkady: ... and while you are at it, do a line of best fit on the entire graph and tell us all the slope and intercept. For bonus points, include the standard deviation of the slope and intercept. -
Quartermain at 18:07 PM on 28 June 2011Climate half-truths turn out to be whole lies
Your article does not mention sunspots or other sun cycles. Sunspots have been at a record low. An interesting article would be on the effect of sun-related changes on the ionization of the upper atmosphere, and the resulting effect on global temperatures. After researching to write such an article, you may become sceptical too.Response: [JC] We've examined sunspots in much detail here at SkS. Eg - our page on solar activity and this recent post on low sunspots. -
Arkadiusz Semczyszak at 17:36 PM on 28 June 2011Climate half-truths turn out to be whole lies
"2005 and 2010 being the hottest years on record" - does not change the fact, that the differences between 1998, 2005, 2010 are very small - within the limits of "Standard of Deviations."Response:[DB] And yet they are STILL the hottest years on record, during a period in which the anthropogenic forcing have been the dominant attribution to the rise in global temperatures.
-
Arkadiusz Semczyszak at 17:11 PM on 28 June 2011Uncertainty in Global Warming Science
I - like Cambrun - I agree that we now have a significant and rapid GW, that currently GW (and formerly) can not be explained by climate change without GHG's. Uncertainties the type "C", however, are very significant. These "uncertainties" in the "fitting curve" have the effect of significant errors in risk assessment and risk management. Camburn (synthesizing) mainly says: The main uncertainty concerns the natural influences on climate - especially the Sun. Practically same way - also - concludes NOAA:“ Our understanding of the indirect effects of changes in solar output and feedbacks in the climate system is minimal ” @KR If not Scafetta - may we quote - Beer et al., 2000., The role of the sun in climate forcing: “If one computes the global and annual mean of solar forcing caused by the 100 kyr period of eccentricity one gets an amplitude of in the spherical mean. This value is too small to be detected in climate records. But, despite the tiny global forcing value, we can observe the 100 kyr frequency during the last 800 kyr in most paleoclimatic records. The global mean temperature changes between glacial and interglacial periods are large: about 20C for polar (Johnsen et al., 1995) and 5 for tropical regions (Stute et al., 1995).” "0.12Wm ~ 2" - so would sometimes even multiply by 100 (!) - for the sum of direct and "indirect effects" influence of the Sun in palaeoclimate? Let us look at uncertainties based on an interesting example. The rotational motion of the earth. The authors of this figure: , on this basis - in this paper, write: “...the LOD [Length of Day] fluctuations are largely attributed to core-mantle interactions and that the SAT is strongly anticorrelated with the decadal LOD. It is shown here that 1) the correlation among these three quantities exists until 1930, at which time anthropogenic forcing becomes highly significant ...” All right ..., just that newer data (LOD) - from 198? year - are completely different from those shown on the aforementioned figure. If the author of the Wikipedia chart is right - that is, its graph - "curve" - is more "fit" - the true - is to "present day" - we have a (sometimes shifted in time - it's true) excellent correlation (ie anti-correlation ) - shorter day = higher temperature. What it can affect the climate? Earth rotating faster, the heat transport is closer to the poles (as in a glass - when we quickly mix tea ...), so the increase of CO2 added to the atmosphere with melted the "ancient" permafrost ... Kevin Trenberth ( More knowledge, less certainty, 2010.): „So here is my prediction: the uncertainty in AR5′s climate predictions and projections will be much greater than in previous IPCC reports ...” “But while our knowledge of certain factors does increase, so does our understanding of factors we previously did not account for or even recognize.” Sk.S. - skeptic, "denier", to the IPCC, and "mainstream" climate science? I think that - at least in some significant points type “C”- certainly yes. -
Dikran Marsupial at 17:00 PM on 28 June 2011Uncertainty in Global Warming Science
Ken Lambert Jut out of curiosity, is the "constant energy difference" idea based on the idea that you can regress global temperatures reasonably well as a function of integrated TSI? If so, it is well worth asking what is the physical mechanism that would mean that TSI affects the climate by long term integrated, rather than direct forcing? It is straightforward to construct accurate regression models by casting around to find variables that look correlated (or to manipulate them by e.g. integrating to make them look correlated). However this ends up over-fitting (you have as many degrees of freedom as the number of variables or manipulations of variables that you consider), which generally means the model has poor predictive value. As (effectively) a statistician, I can tell you there is no reason to be impressed by the fit of such models, unless physics suggests that form of model is justfiable. -
Dikran Marsupial at 16:48 PM on 28 June 2011Uncertainty in Global Warming Science
Ken Lambert It is fine to talk about the "radiative forcing side of the ledger" (except that CO2 also gives rise to radiative forcing), however if you only look at one forcing in isolation and ignore the feedback from that change in forcing (that would restore radiative equilibrium), then it is hard to see how any conclusion you might draw has any useful bearing on the discussion (as it would only apply to a planet with physics very different from that which applies on ours). "My point is that the TSI contribution is really unknown unless you know the 'equilibrium' TSI which will produce neither warming not cooling in the absence of all the other AG forcings." This point is incorrect as forcings are defined as a change from pre-industial levels. Satelite data gives higher precision estimates of TSI, that doesn't mean we don't know anything abou TSI prior to the satelite record. -
KR at 13:56 PM on 28 June 2011Uncertainty in Global Warming Science
Ken Lambert - I have responded on the far more appropriate It's the sun thread. Now, can we get back to the uncertainty discussion? -
KR at 13:54 PM on 28 June 2011It's the sun
Ken Lambert - If you are talking about forcing imbalances, then statements such as "If TSI is above an 'equilibrium' value and stays constant -there is a constant imbalance in forcing which translates to a linearly increasing gain in energy..." are completely unwarranted, as you should well understand. The climate will respond by warming due to increased energy in the system, and reduce the imbalance due to increased TOA radiation. The "constant imbalance" phrase is one you have repeated several times in this context - it's been wrong every time before, and it is wrong now, as it implies a constantly increasing TSI - which is not the case. "My point is that the TSI contribution is really unknown unless you know the 'equilibrium' TSI which will produce neither warming not cooling in the absence of all the other AG forcings." There is no such thing as an "absence of all other AG forcings". The climate is the sum result of all the forcings and feedbacks. Climate change is the result of changes in one or more forcings. TSI has changed very little over the past century, where we've seen the most warming, and the 'equilibrium TSI' would have been long since reached at some equilibrium in the absence of other changes. In particular, there has been essentially no change in TSI since 1980. "E pur si muove" - and yet it moves! Essentially, you seem to be looking for a unique equilibrium, when any fixed forcing will reach an equilibrium tied to that forcing. Climate changes from that point are due to changes in forcing, and we have an excellent track of what the TSI changes are - negligible. The observed climate change is therefore primarily due to the greater than exponential increase in CO2, hence a greater than linear forcing change. -
Bob Lacatena at 13:52 PM on 28 June 20112010 - 2011: Earth's most extreme weather since 1816?
71, Camburn, I fear that I agree that the effectiveness of the dams may be lost... around the world. Very many dams were built with an entirely different climate in mind, and will be overwhelmed. Maybe not today or tomorrow with any regularity, but it's inevitable, and sad. But for some people, until we can statistically prove that 95% of all pre-2000 dams are now worthless, they won't admit that climate change is a problem. -
Camburn at 13:51 PM on 28 June 20112010 - 2011: Earth's most extreme weather since 1816?
Must have done something wrong. Here is the link about the Missouri River http://www.capjournal.com/articles/2011/06/27/opinions/columnist/doc4e07cf2e2ec3a824492051.txt -
Camburn at 13:46 PM on 28 June 20112010 - 2011: Earth's most extreme weather since 1816?
Actually thoughtful: I spose I could dig up all the pertinent information with links etc but that is a huge task. I do know that in April and early to mid may, the discharge from Garrison was less than minor flood stage in Bismarck. I do know that NOAA has long range forcasts that showed above average precip. I do know the state has been asking the corp to release more water from Garrison for over 6 months so that the flow could be better regulated when the snow pack started melting. This article sums up the Missouri River flood. I fear that the effectiveness of the dams may be lost. Current state of Missouri -
Tom Curtis at 13:37 PM on 28 June 20112010 - 2011: Earth's most extreme weather since 1816?
Two comments on Norman's list: First, the author of the website made his list for the 19th century and earlier by taking a list of events made from examining logs of ships in ENSO effected areas around the globe, and then adding in other events as derived from other proxies. The risk of double counting with such a procedure is large. Second, the websites claims about 20th century El Ninos should be checked against the ENSO Southern Oscillation Index: Clearly the website he is relying on has very dubious information.
-
actually thoughtful at 13:36 PM on 28 June 20112010 - 2011: Earth's most extreme weather since 1816?
windbarb - thank you for clarifying some of the jargon. I see that the Lorenz of ensemble results is the same Lorenz of butterfly chaos theory (indeed that the latter suggests/requires the former) - that just makes me happy. Maybe the default of La Nina conditions is why CFS went with La Nina in the fall, even though most models disagree? -
actually thoughtful at 13:31 PM on 28 June 20112010 - 2011: Earth's most extreme weather since 1816?
Camburn - do you have facts (not anctedotes) to back up your claim that the Mississippi flooding is manmade? This has been a slow moving tragedy - it is hard to imagine those dams haven't been wide open for quite some time. Can you show reservoir levels for each year in April, for example, and show that they have been filling for 19 years (1992 Clinton was a new President - long time ago). Can you show that dam managers didn't follow best practices to manage/mitigate the flood situation? It really is a strong charge that these floods were manmade - other than in the broad sense that dams exist (or if you want to pin it on AGW) - but even that you would have to show it would have been better with no dams - which is not an obvious outcome. Or that the probability of this event WITHOUT AGW is less than 20% (a standard I just made up...). On a broader scale I think that is the problem. Dr. Masters has pointed out that all the things we are seeing are precisely what climate scientists are predicting, but to claim that it is caused by AGW (in a chaotic weather system (paging Dr. Lorenz)) you would need to establish a statistical likelihood without AGW, and then see a trend (more than one year) that demonstrated you were seeing those weather events well beyond the statistical likelihood. I think Dr. Masters did it for one year - but too soon to be able to scientifically make that claim (I think). I do think 2010 was a watershed year (pun intended) wherein we went from "we should see x because of AGW" to "we are seeing x because of AGW" - I personally have a lot less patience for those who claim it isn't happening, given the overwhelming evidence even the common person can observe. -
Rob Painting at 13:27 PM on 28 June 20112010 - 2011: Earth's most extreme weather since 1816?
Windbarb @ 65 - Yeah, I think the impact of the change in the background state is completely overlooked by many bloggers. As you point out that in itself will have a noticeable impact, particularly its effect on drought in the Amazon-should an El Nino-like state emerge. -
actually thoughtful at 13:20 PM on 28 June 20112010 - 2011: Earth's most extreme weather since 1816?
Norman, You ignore the 50% increase in the current decade. That could be an artifact, or it could be that some tipping point has been exceeded, thus switching us to a busier ENSO cycle. Also, I find your counting of cycles to be fairly unsatisfying. Even myself, not trained in this area, am asking basic questions you apparently have not thought about: 1) How long was each event in each decade? 2) How strong was each event in each decade? You might be exactly right, or you might be confusing number of events with duration and intensity - the point is your analysis leaves us with more questions than answers. I can't imagine drawing any conclusions from the sparse data you have presented (and as I recall, when I last checked your data I found it was off by at least 50%). I haven't checked your data yet as you are missing so much at the logical level it doesn't seem warranted yet. -
windbarb at 13:17 PM on 28 June 20112010 - 2011: Earth's most extreme weather since 1816?
Rob @60, yes, thank you for catching me there. Future ENSO events will occur on top of a background state that may look more like a modern El Nino or La Nina. The resulting impact to weather patterns around the globe, though, is likely to reflect the tendencies of whichever background state the SSTs do approach... thus impacting extreme weather events. In other words, if the future background state looks similar to current La Nina SST patterns, the impact on the storm track is likely to be similar, meaning that areas favored for (say) higher than usual tornado activity during/following a La Nina might trend in that direction in a climate changed world, too. -
Ken Lambert at 13:14 PM on 28 June 2011Uncertainty in Global Warming Science
Sphaerica, KR, DM I was only discussing the radiative forcing side of the ledger, and from TSI only. For sure S-B and other feedbacks (WV & Ice Albedo) will increase the outgoing 'climate response' side of the ledger to bring about a new equilibrium at a higher temperature. I have mentioned this elsewhere many times. For sure you cannot measure individually the radiative forcings in the climate system as listed in Fig 2.4 of AR4. They are modelled and theoretical individual warming and cooling forcings which add up to a total of about +1.6W/sq.m. My point is that the TSI contribution is really unknown unless you know the 'equilibrium' TSI which will produce neither warming not cooling in the absence of all the other AG forcings. Looking at the 'differences' in TSI which can be done with 'high precision' satellite measurement is only relevant if you know the 'equilibrium TSI'.
Prev 1637 1638 1639 1640 1641 1642 1643 1644 1645 1646 1647 1648 1649 1650 1651 1652 Next


