


 Arguments


Recent Comments
Prev 1654 1655 1656 1657 1658 1659 1660 1661 1662 1663 1664 1665 1666 1667 1668 1669 Next
Comments 83051 to 83100:
-
John Bruno at 06:19 AM on 10 June 2011Ocean acidification: Some Winners, Many Losers
Hi Rob, Thanks for covering this. Two questions. 1) What is the natural low pH value around the PNG bubblers? Ie, how high does acidity get? The common criticism in the field of this "natural experiment" approach is that when flow (current velocity) is low, pH gets to extremely low values (due to reduced mixing with ambient water), which is when the damage is likely done to nearby organisms. Yet what often gets reported in these papers is the mean pH, which isn't as relevant as the extreme values. IOW, are they an analogue for 750 ppm or 3000 ppm? 2) Why label macroalgae "slime"? Id rather eat algae than coral (being partly facetious) and lots of people love to eat urchins! [you might add that it is the inhabitant fish, which are dependent on corals, that would be lost from dinner plates] -
scaddenp at 06:18 AM on 10 June 2011Can we trust climate models?
Why you "separating the parameters from the physics"? They are physics too. Read the RealClimate FAQ on parameterization? -
Alexandre at 05:57 AM on 10 June 2011There's no room for a climate of denial
Albatross at 14:42 PM on 9 June, 2011 That Monty Python scene springs to my mind often too. -
dhogaza at 05:13 AM on 10 June 2011Impacts of a melting cryosphere – ice loss around the world
"In addition, how about L. Hamilton's research showing extent has declined in every month of the yea" Yes, the NSIDC trend graphs published in each monthly summary show this, too, though they're not gathered in one nice place like L Hamilton's graph. -
Bob Lacatena at 05:04 AM on 10 June 2011There's no room for a climate of denial
39, Daniel, That was awesome. It should be a post, not a comment. -
Bob Lacatena at 04:59 AM on 10 June 2011There's no room for a climate of denial
32, Glenn, Thanks for the offer. I'll keep it in mind, but for now I'd like to keep it between Pirate and I, to keep it focused, casual and non-confrontational (i.e. collaborative, rather than combative). -
Bob Lacatena at 04:58 AM on 10 June 2011Christy Crock #6: Climate Sensitivity
Eric the Red, I'm still waiting for evidence and citations for your statement about sensitivity at 34, however. -
Bob Lacatena at 04:57 AM on 10 June 2011Christy Crock #6: Climate Sensitivity
40, Eric the Red, Your comment on volcanoes in recent times is certainly correct, but I'm talking about geologic time scales, and the full history of the earth. In that history, periods of extreme volcanic activity (far in excess of what we see today) have been responsible for boosting CO2 in the atmosphere (Precambrian). I've also seen theories (i.e not entirely substantiated) that great increases in volcanic activity have caused sustained climate change in recent times (a theory that it caused Neandertals to go extinct) and further back (that it was implicated in the extinction of dinosaurs, through climate change). Your points about time scales is certainly true, and I thought obvious, but not relevant. I wasn't making any statement about current climate change causes, only about the likelihood of variability in climate sensitivity due to configurations, and the fact that these are the only parameters that would affect sensitivity, since all other aspects are themselves temperature dependent. As such, my point was more that any variability in climate sensitivity would only come into play when using paleoclimate data from the very distant past (i.e. different configurations), and even then, any variation would I expect (my opinion, not fact) be slight. Your final statement that physics is not going to change, and that the sensitivity to CO2 has probably been fairly constant, is exactly the point I was trying to make. So we agree on something!!!! The next round's on me! -
Tor B at 04:53 AM on 10 June 2011Geologists and climate change denial
MajorKoko @ 02:44 AM on 10 June, 2011 Walker and Hays (1981) describe A Negative Feedback Mechanism for the Long-term Stabilization of Earth’s Surface Temperature. Richard Alley describes this million year (+) weathering of silicates (rocks) process in his 2009 AGU lecture very nicely. My favorite book as a teen was Earth Abides. I’d like our descendants to abide with it (the Earth), and we humans don’t have a million years to get CO2 back down naturally in order for us to live in the pleasant Eden we've had these past ten thousand (or 2 million) years. We really need to 1) prevent greenhouse gas concentrations from skyrocketing they way they have been for 75 years and 2) figure out how to sequester CO2 in order to get us back to the proverbial 350. If we don't act individually, collectively, and soon, I fear Arctic region positive feedbacks (including methane release) will only exacerbate the weather extremes that seem to be on the increase and which modeling predicts will increase. -
Riccardo at 04:36 AM on 10 June 2011Can we trust climate models?
trunkmonkey I'm confused. What's the difference between the graph you show and the common notion of MOC? I can't see any atlantic-centrism here. It just describes a physical mechanism by which sea waters may sink and upwell, just Archimedes principle if you wish. -
dhogaza at 04:29 AM on 10 June 2011Impacts of a melting cryosphere – ice loss around the world
"just the normal progression of random variability around a declining trend." Even with his cherry-picking, the 2007-2010 minimum has been showing variability *under* the trend, in contrast to the years (eyeballing) 1995-2006. His "leveling off" simply doesn't exist, and if anything we're seeing a slight acceleration in the declining trend, as argued by tamino here. His fit with two std deviations is given in this graph, with the red dot endpoint being his fit's prediction for 2011: Some "flattening" ...
Response:
Some "flattening" ...
Response:[DB] Nice. In addition, how about L. Hamilton's research showing extent has declined in every month of the year:

And the southern sea ice edge of the Arctic Sea Ice has retreated northward in every month of the year:

No flattening here.
-
NewYorkJ at 04:19 AM on 10 June 2011Geologists and climate change denial
Would be interesting to see the percentage of geologists who haven't worked in the fossil fuel industry who are contrarian vs those who have. Interestingly, Richard Alley has many years of experience in the oil industry, but is very knowledgeable on climate science, but he's also spent many years studying climate science. -
CBDunkerson at 04:06 AM on 10 June 2011Impacts of a melting cryosphere – ice loss around the world
garethman, the sharp drop in sea ice extent in 2007 was due to a confluence of rare weather events. The subsequent years have had more 'normal' weather yet still shown similarly low extents because of the ongoing decline in sea ice. Basically, at the time the 2007 extent was anomalously low (due to conducive weather) for the amount of ice in the Arctic ocean. However, since then the amount (i.e. volume) of ice has continued to decline and extents that low are now 'normal'. In another few years the same extent will be considered 'high'. Nothing particularly mysterious about it... just the normal progression of random variability around a declining trend. -
Daniel Bailey at 03:54 AM on 10 June 2011There's no room for a climate of denial
Stay calm. Do not think. Do not adjust to reality - reality must adjust to you. Then you too can be a denier: [Source] H/T to Coby Beck and Tom Curtis (whom I shamelessly and brazenly quoted/stole this from) -
CBDunkerson at 03:51 AM on 10 June 2011Christy Crock #6: Climate Sensitivity
Badgersouth, no the earlier items in the series can be found here. -
dana1981 at 03:49 AM on 10 June 2011IEA CO2 Emissions Update 2010 - Bad News
Mark - I did cover it in the caption to the figure, but your'e right it would be good to include in the figure itself for when it's re-used. We'll look into that. -
trunkmonkey at 03:47 AM on 10 June 2011Can we trust climate models?
I checked out climateprediction.net and was pleased to find an actual table of the parameters and their values for one of the Hadley models. It was a daunting list, and after looking at scaddenp's GISS documentation it is clear what an enormous undertaking separating the parameters from the physics would be. Riccardo mentions difficulties approaching things the right way and this brings to mind the model handling of the THC. The cartoons at the top of this thread show schematically how the approach is rooted in the notion of Meridional Overturning Circulation. There is a large literature on MOC and I was disappointed to see at climateprediction.net references that people are stilled mired in this notion in 2010. IMO the entire notion of MOC reflects a Euro-American bias toward the Atlantic, sort of like we study Greece and Rome and ignore the Han Dynasty.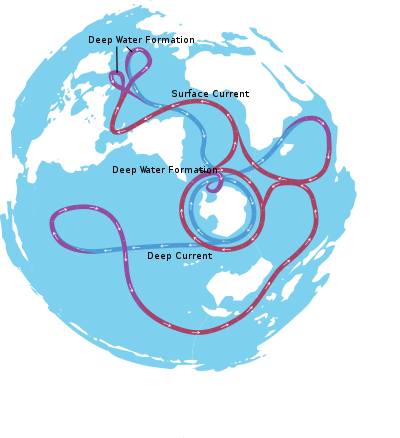 To really understand how the THC works requires a continuous ocean view like the one above (if it works)by Alexandro Van de Sande.
That the Atlantic bottom water is being actively pumped out is supported by satellite measurements that it is about a meter lower. The Antarctic beltway sure looks like a centrifugal pump to me...
The models are at their best when the fluid dynamic equasions spontaneously produce observed behavior. I don't think we can even evaluate the behavior if we are stuck on the notion of MOC.
Moderator Response: [Dikran Marsupial] "would be" is the wrong tense. As I said, sensitivity analyses have allready been done, including by climateprediction.net and you can even download their results if you want to analyse them for yourself.
To really understand how the THC works requires a continuous ocean view like the one above (if it works)by Alexandro Van de Sande.
That the Atlantic bottom water is being actively pumped out is supported by satellite measurements that it is about a meter lower. The Antarctic beltway sure looks like a centrifugal pump to me...
The models are at their best when the fluid dynamic equasions spontaneously produce observed behavior. I don't think we can even evaluate the behavior if we are stuck on the notion of MOC.
Moderator Response: [Dikran Marsupial] "would be" is the wrong tense. As I said, sensitivity analyses have allready been done, including by climateprediction.net and you can even download their results if you want to analyse them for yourself. -
Yvan Dutil at 03:42 AM on 10 June 2011Geologists and climate change denial
Without going deep into sociological interpretation, scientist most sensible to climate change are those: used to playing with model or seeing the impact of climate change first hand. The first criterion affects older and lab rats scientist. The second criterion impacts those working on very long and very short time scale (Geologist and meteorologist). This match my own observations. Off course, political orientation play also. -
Alexandre at 03:42 AM on 10 June 2011Geologists and climate change denial
garethman at 02:56 AM on 10 June, 2011 by what route do they get to commenting on the validity of Climate change Science ? They don't. I've engaged in some unfruitful debates with geographers here, and the basic pattern is what you see with denialists elsewhere: copy/pasting arguments they don't really understand, and if you respond to them, they just move on to some other denialist meme. The USA in an imperialist way could be using the problems of climate change to conveniently prop up it’s own economy. Geopolitics is a complicated game, and a major player like the US can play rough. The problem, of course, is when people get lost in these yummy conspiracy plots and forget to look at the evidence. The US could be the worse nasty exploiter of the world, but IR would still be obstructed by CO2. -
Mark-US at 03:29 AM on 10 June 2011IEA CO2 Emissions Update 2010 - Bad News
PS sorry Dana, I just saw the back and forth at comment 44. So the graph was energy combustion only.... ok that's clear. However, I still think a revision is in order for the reason that casual viewers might go away with the impression that OVERALL emissions (including everything) are still within IPCC ranges (which don't include lots of things such as permafrost carbon). If the lines on the figure are energy-combustion lines only, the lay newcomer should be told there is more to the story. I'm not enough of an expert to suggest a specific tweak. Thanks for your work Mark (USA) -
MA Rodger at 03:25 AM on 10 June 2011Impacts of a melting cryosphere – ice loss around the world
Not a good link @#13. It's URL is:- https://1449103768648545175-a-1802744773732722657-s-sites.googlegroups.com/site/marclimategraphs/collection/G14.jpg -
Geologists and climate change denial
MajorKoko@33, In addition to the link DSL has provided here is a quick summary of terms: positive feedback - Climate responds to increase the magnitude of the original forcing. Does not mean that the warming/cooling continues without limit. Example: 1 degree of original forcing results in 3 degrees of net change after feedbacks. negative feedback - Climate responds to decrease the magnitude of the original forcing. Example: 1 degree of original forcing results in .5 degrees of net change after feedbacks. The Broecker quote uses "self-stabilizing" as a synonym for negative feedback. The climate will still stabilize in the sense that feedbacks will be finite, even though they are positive. The geological record serves as evidence for a positive feedback because the magnitude of temperature swings seen is too great to be explained without taking positive feedbacks into account. -
Mark-US at 03:18 AM on 10 June 2011IEA CO2 Emissions Update 2010 - Bad News
Thanks for the graphic in Figure #1, though I'm having some trouble with the label "Observed CO2 Emissions". Two things. #1 A casual reader might think the picture shows EVERYTHING. For example emissions from increasing wild fires. There's no reason to think emissions from wildfires went down during the recession. Unless I'm just confused (very possible) a revision might be in order. #2 Also, I'd be interested to know if this really is an apples-to-apples comparison. How did IEA generate their data? From the scant bit I read, it sounds like they looked at international energy consumption and projected. If so, their data doesn't show emissions from a number of other sources. But IPCC's scenarios, so I believe, imagine at least some emissions sources beyond energy consumption. Go easy on me, I'm a newbie, and its a lot of material to compare. So the question is... do the lines show the same thing? Or are their some emissions sources in IPCC's lines that are not in the IEA curve in Figure 1? If so, and we added some amount to the IEA curve in accord with the IPCC's scenario definitions, wouldn't that push the IEA curve higher than A1FI? Thanks for comments Mark, USA -
MA Rodger at 03:16 AM on 10 June 2011Impacts of a melting cryosphere – ice loss around the world
I'm perplexed why Arctic Sea Ice should have but two futures – either a tipping point & rapid disappearance of summer ice or a gradual decline into this state over 20 years. The former “seems to be unfounded” according to this post. Certainly the dramatic melt of 2007 proved not to be a tipping point being not followed by more drama in 2008. Yet the dramatic output of the PIOMAS model (see link @ #4) suggests ice free summers at least before 2020. My own humble efforts at extracting this PIOMAS data are graphed here & are just as dramatic. If this is anything near reality, an ice free summer Arctic surely has to be years away, not decades. -
DSL at 03:16 AM on 10 June 2011Geologists and climate change denial
Garethman, I have to take exception at your use of "alarmist." You imply that "alarmist" and "denialist" are binary opposites. That's clearly not true. You also fail to define "alarmist." Can you point out any poster on this site who you would consider to be an "alarmist"? And could you point out any climate scientist who you consider to be an "alarmist"? You might want to reply an a more appropriate thread. -
dhogaza at 03:14 AM on 10 June 2011Impacts of a melting cryosphere – ice loss around the world
garethman: "It’s interesting to note from the NSIDC that the area of ice dropped considerably between 1997 and 2007, since when the melt has levelled off with the ice remaining at a significantly reduced level. The last 4 years has seen this low level stabilisation which cannot be seen as a recovery, but how long would it be before this is seen as the norm?" It's almost as though garethman isn't aware that the three years following 2007 are *all* lower in minimum extent than any other year in the satellite record, and that two of the three were well below the long-term trend, and the third right on the trend, isn't it?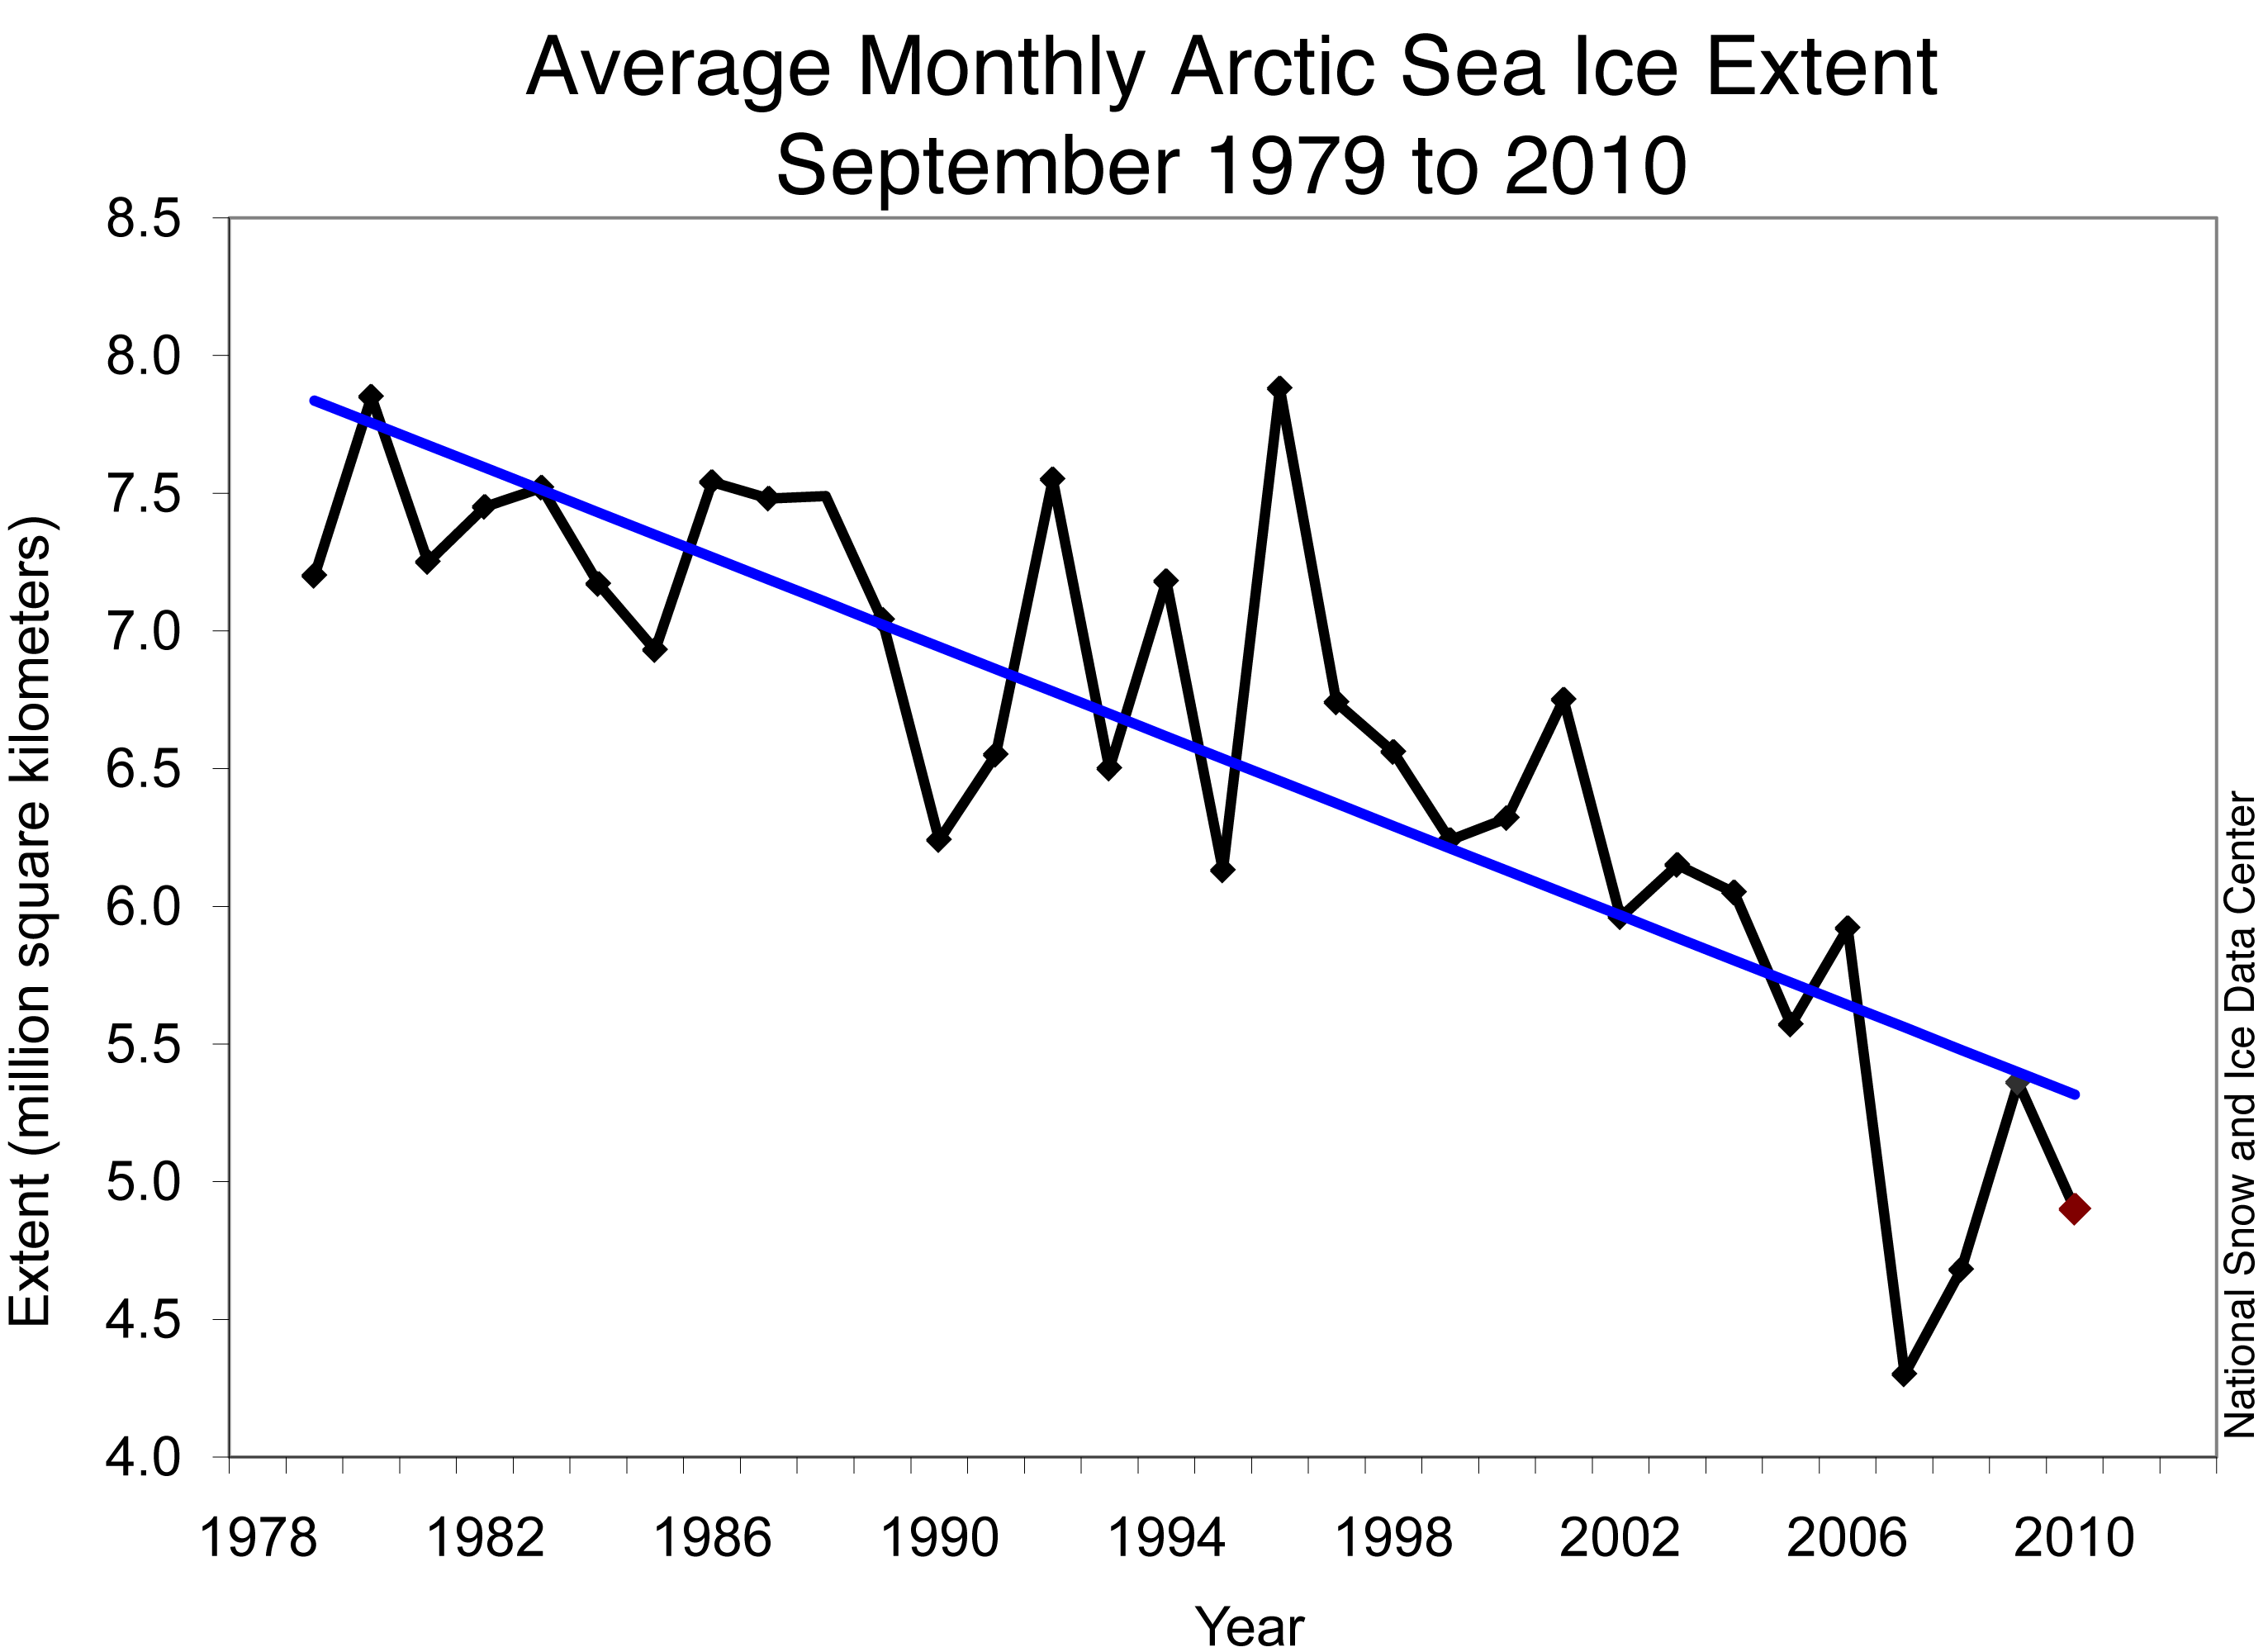
-
Eric the Red at 03:10 AM on 10 June 2011A detailed look at climate sensitivity
Tom, Sorry for the delay. Yours was a better analysis than mine, but it looked like John was confusing the equation by substituting oC for W/m2. Hence, he was arriving at a higher figure for climate sensitivity. -
DSL at 03:08 AM on 10 June 2011Geologists and climate change denial
MajorKoko, you might want to read all three levels this article and post any responses/questions there. -
KR at 03:06 AM on 10 June 2011Impacts of a melting cryosphere – ice loss around the world
Badgersouth - Using the "Search" box with "Christy Crock #" will locate all of them. -
JMurphy at 03:03 AM on 10 June 2011Websites for Watching the Arctic Sea Ice Melt
With regard to the UAH graph shown by villabolo, I remember one or two people posting on here back in April, saying that the anomaly showing for March 'proved' that temperatures hadn't risen since the readings began, or whatever cherry-picked date was relevant at the time; or that all the warming had now been 'wiped out'. Where are they now and what do they think at the moment ? I'm genuinely interested, if only to discover more about their thought-processes. -
garethman at 03:02 AM on 10 June 2011Impacts of a melting cryosphere – ice loss around the world
It’s interesting to note from the NSIDC that the area of ice dropped considerably between 1997 and 2007, since when the melt has levelled off with the ice remaining at a significantly reduced level. The last 4 years has seen this low level stabilisation which cannot be seen as a recovery, but how long would it be before this is seen as the norm? I strongly suspect the ice will once more resume it’s overall melt, but it would be great to see some opinions on why this low level stabilisation has occurred. -
garethman at 02:56 AM on 10 June 2011Geologists and climate change denial
Alexandre In Brazil the denialist bunker is Geography, which apparently is more of a social science here than elsewhere. They love the conspiracy theory of an imperialist evil USA plotting to control developing countries through emission targets. Garethman You never know, both ideas are not incompatible. The USA in an imperialist way could be using the problems of climate change to conveniently prop up it’s own economy. By the way, if Geography is seen as a Social Science, by what route do they get to commenting on the validity of Climate change Science ? -
JMurphy at 02:55 AM on 10 June 2011There's no room for a climate of denial
Eric the Red, I can't understand why you didn't link to the paper which actually created the graph rather than a version of it shown by CO2SCIENCE ? It can't have been difficult to find. -
garethman at 02:51 AM on 10 June 2011Geologists and climate change denial
Steve Brown It would be interesting to know if there was a correlation between the age of Geologists and potential denialist traits. If you were at University earlier than 1980, then you are unlikely to have had much exposure to the explosion of knowledge in Earth Sciences from the various ocean and ice-core drilling programs that began in the mid 70’s. Garethman I would bet that you were right on this Steve, from observation there is certainly correlation on the alarmists side, i.e. the younger an activist is, the more catastrophic the predictions. (Note, based on observations only!) -
JMurphy at 02:51 AM on 10 June 2011There's no room for a climate of denial
apiratelooksat50, what evidence do you have that shows (to your satisfaction) what is actually changing the climate now ? Does this evidence provide figures that everyone else can look at ? Can you also provide the evidence for the potential benefits ? -
MajorKoko at 02:44 AM on 10 June 2011Geologists and climate change denial
You quote the following... "The paleoclimate record shouts out to us that, far from being self-stabilising, the Earth's climate system is an ornery beast which overreacts to even small nudges." So I have a question... If the climate is not self-stabilising, why did the over-reactions that the paleoclimate record is "shouting to us" about *not* lead to runaway global cooling or warming, such that we are now in either a deep-freeze, or baked-dry situation? I don't understand how you can say that the Earth exhibits strong positive feedback (i.e. far from self-stabilising) during climate changes? The fact that we are here at all (and not enjoying a never-ending ice-age, or global meltdown) quite clearly shows that, historically at least, there must be some, as yet unidentified, braking effect (negative feedback) within the system? Otherwise we would already have found ourselves at either extreme I mention above would we not? Please explain... -
Eric the Red at 02:37 AM on 10 June 2011There's no room for a climate of denial
JMurphy, The site of the graphic does not concern me, since the only change was the added yellow bar, which does not change the data on the graph (I was unaware of the site, just looking for a link to the graph). The previous graphic references was the temperature plot in #27. Also, several different dates have been listed for the Medieval Warm Period, so I will not get bogged down with specific differences. The "bump" is uncertain, hence it is not filled in like the remainder of the graph. The decline from the 7th century to the 8th looks similar to what has happened in the past century. There is no "bump" currently, so if the "bump" was real, then it is not happening now. If it was not real, then it is happening now. I have no reason to dispute the paper's conclusions, as it is supported by the data. I cannot say if the same thing is occurring now. The intent was to show data comparing recent temperatures to those of past times. -
John Hartz at 02:19 AM on 10 June 2011Impacts of a melting cryosphere – ice loss around the world
Clive and Dirk Cussler do not pull any punches about climate change's impact on the Arctic in their Dirk Pitt nove, "Arctic Drift" If the Climate Denial Spin Machine can tout novels, so can we. BTW: I really enjoed reading "Arctic Drift" Much of the novel is based on the ill-fated Frankin expedition. The fate of the crews of the HMS Erebus and the HMS Terror is retold in gruesome detail. -
Albatross at 02:13 AM on 10 June 2011Impacts of a melting cryosphere – ice loss around the world
Rob @5, Did you source those Arctic ice volume data from here? Also, for more context, we have this from Polyak et al. (2010): "Historical records indicate that Arctic sea-ice extent has been declining since the late 19th century. Although this decline was accompanied by multidecadal oscillations,the accelerated ice loss during the last several decades lead to conditions not documented in at least the last few thousand years. Taking together the magnitude, wide geographic distribution,and abruptness of this ice loss, it appears to be anomalous in comparison with climatic and hydrographic variability observed on sub millennial timescales and longer-term insolation changes." And if I may take the liberty of directing those in denial about the rapid loss of ice to the video featured here. -
John Hartz at 02:05 AM on 10 June 2011Impacts of a melting cryosphere – ice loss around the world
Recommend adding a "links" tab to other relevant SkS postings on this topic. -
Eric the Red at 02:03 AM on 10 June 2011Christy Crock #6: Climate Sensitivity
Sphaerica, I would agree that there are four inputs (and I would agree than any thing else is a result of those inputs), with any time of galactic input being an anomaly. In the past, volcanoes have had short-term effects, except for the few super volcanoes. That leaves three primary inputs. The location of the continents has been shown to affect input, but change on such a long time scale to be only relevant to paleoclimatology. Surface albedo may play a much greater role. Orbital factors cause changes on a much shorter time scale; thousands up to a hundred thousand years. That leaves the sun. Total solar irradiance has been shown to vary only slightly, and is unliekly to be a large climate influence. Sunspots are much more variable, as is the solar magnetic field, and the results are inconclusive. I would argue that CO2 is only an input with regards to cloud formation and blocking incoming solar radiation. Most of the effects concern restricting output. Also, CO2 is affected by temperature; ocean dissolution and plant respiration. The physics is not going to change. While your four inputs may have changed significantly in the past, the sensitivity to CO2 has probably been fairly constant, except during the early Earth, when atmospheric concentrations approached 1%. -
John Hartz at 02:02 AM on 10 June 2011Christy Crock #6: Climate Sensitivity
Is this the first article in the Christy Crock series to be posted? If so, why is it #6? -
Alexandre at 02:00 AM on 10 June 2011Impacts of a melting cryosphere – ice loss around the world
skywatcher at 00:32 AM on 10 June, 2011 You're right. So 190 GT of methane carbon would actually mean 4750 GT of the equivalent in CO2 (25x). Or 558 years worth of human emissions, considering a 100 year CH4 time span. Is this right? Feel free to correct me if anyone sees a mistake in my calculations. I remember David Archer claiming that no model showed a self-sustained warming from permafros emissions alone. So my figures here seem too high to be true... -
Rob Honeycutt at 01:59 AM on 10 June 2011Impacts of a melting cryosphere – ice loss around the world
Jay... What is being projected by pretty much everyone is ice free summers in the coming 10-15 years. And that has all kinds of implications from habitat loss issues for a wide range of Arctic species, loss of summer ice albedo, warming Arctic ocean, methane release... it's extremely concerning and it's happening right now. -
JMurphy at 01:57 AM on 10 June 2011There's no room for a climate of denial
Eric the Red wrote : "This graphic by Hanspeter Holzhauser shows changes in the Great Aletsch Glacier in recent times which mimics the previous graphic (reverse axis of course). http://www.co2science.org/data/mwp/images/l2_greataletsch.gif" What "previous graphic" are you referring to, and why do you rely on graphics from a dodgy site like CO2SCIENCE(sic) ? Doesn't it bother you that they have added a yellow bar alluding to what they want you to see as the MWP, when the original graphic (from the paper) shows a later Medieval Climate Optimum (MCO) ? And what about that bump during that warmer time-period ("from around AD 800 to the onset of the LIA around AD 1300") that "was interrupted by two weak advances in the ninth (not certain because based only on radiocarbon dating) and the twelfth centuries AD (around AD 1100)" ? Is that happening now ? And what about the conlusion that "the residual 14C records supports the hypothesis that variations in solar activity were a major forcing factor of climatic oscillations in west-central Europe during the late Holocene" ? Is that occurring now ? -
Rob Honeycutt at 01:54 AM on 10 June 2011Impacts of a melting cryosphere – ice loss around the world
Jay... To put that into a more current context... try this. -
Albatross at 01:32 AM on 10 June 2011There's no room for a climate of denial
The "skeptics" here continue to create and then argue a strawman concerning the Holocene climate or concerning climate pasts. I find it ironic that they are willing to grasp onto the meme that "Climate has changed before and been warmer before" while completely missing the point and completely missing about where we are heading. That is just another form of denial folks. To add to Daniel's informative figure @27: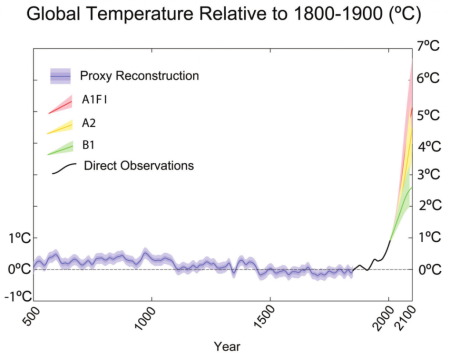 [Source]
Also, I find it odd that some "skeptics" are of the belief that paleo data are of little use, but then use (or abuse) those same data to (incorrectly) reinforce their preconceived ideas and misguided ideas.
Finally, a lot has changed since the peak warmth of the Holocence, the planet is now home to 7 billion people, and by the time we have doubled or tripled CO2 there could be more than 10 billion people on the planet.
[Source]
Also, I find it odd that some "skeptics" are of the belief that paleo data are of little use, but then use (or abuse) those same data to (incorrectly) reinforce their preconceived ideas and misguided ideas.
Finally, a lot has changed since the peak warmth of the Holocence, the planet is now home to 7 billion people, and by the time we have doubled or tripled CO2 there could be more than 10 billion people on the planet.
-
CBDunkerson at 01:09 AM on 10 June 2011CO2 is not increasing
The global recession did cause a dip in CO2 emissions for a couple of years, but emissions started rising again in 2010 and the emissions dip was much too small to have any impact atmospheric concentrations... which have continued increasing at about 2ppm per year through the recession. -
Albatross at 01:07 AM on 10 June 2011Impacts of a melting cryosphere – ice loss around the world
Thanks to Alexandre and Skywatcher for ruining my morning tea...jeez. Excellent points though. -
Albatross at 01:03 AM on 10 June 2011Geologists and climate change denial
Be careful about painting all geologists with the same brush. The Canadian Geophysical Union is also convinced by the evidence that humans are causing global warming. Then again, I concur with this statement: "So climate scepticism seems strongest among geologists closely linked to the mining and fossil fuel industries". Think the coal lobby in Australia and the USA, two mention but two examples. Also think ClimateAudit.
Prev 1654 1655 1656 1657 1658 1659 1660 1661 1662 1663 1664 1665 1666 1667 1668 1669 Next


