


 Arguments


Recent Comments
Prev 1678 1679 1680 1681 1682 1683 1684 1685 1686 1687 1688 1689 1690 1691 1692 1693 Next
Comments 84251 to 84300:
-
Harry Seaward at 09:49 AM on 31 May 2011Are you a genuine skeptic or a climate denier?
Before I label myself, can anyone say in a nutshell: 1. What the cause of climate change is? -
Composer99 at 09:44 AM on 31 May 2011Of Averages and Anomalies - Part 1B. How the Surface Temperature records are built
Damorbel: Please provide citations to literature to support your assertions. The bloggers posting to this site and the commenters adding their two bits (or responding to posters making contrary efforts, such as yourself) generally take the time and effort to do so. It would be a minimum courtesy to back up your claims with evidence of similar quality, rather than with snide insinuation. -
Bern at 09:44 AM on 31 May 2011Are you a genuine skeptic or a climate denier?
I just went back to look at the comments thread on the article. Interesting to see what sort of comments the moderators are letting through... I can't recall exactly what I posted yesterday, but it obviously didn't make the cut. Perhaps I made the mistake of supporting your argument, rather than trotting out a long-debunked denialist argument, like so many of the comments do? :-) I tapped out a couple of quick replies to some of the comments there. I wonder if any of them will make it through moderation either? -
actually thoughtful at 09:32 AM on 31 May 2011Are you a genuine skeptic or a climate denier?
I think an interesting point has been raised here - what is a denier? (OK sure - we have raised it thousands of times on this site). I think the answer is finally available (it does contain a value judgement, but anytime you call someone a denier vs a skeptic you have made a value judgement). The value judgement is: The body of evidence in climate change REQUIRES and active mitigation response. If you agree with that statement you are pro-science. (Even as you wonder about the precise nature of sensitivity, how we can accurately measure OHC, precisely when the oceans will swamp low-lying cities, how global warming will affect the West Anarctic ice sheet, etc. etc.) If you disagree with that statement - you are a denier. The particular stripe of your denial is of great interest to you perhaps, but not to the rest of us. Does that satisfactorily encapsulate the issue for anyone else? I like it - but I suffer from a little "brilliant in his own mind" syndrome. And long time readers KNOW I have a strong bias towards action on this issue. -
Tom Curtis at 09:25 AM on 31 May 2011Of Averages and Anomalies - Part 1B. How the Surface Temperature records are built
Damorbel @16, a correlation of 0.5 is quite low. That is why the GISS method assigns a station a weighting to a station 1200km away of (1200-1200)/1200 = 0. A station 1199 km away will receive a weighting of (1200-1199)/1200 =~= 0.00083. In other words, it will have a significant influence on the GISS tempurature if there are very few, and very distant stations from that location. This, as with the rebuttal of all your other objections, was clearly explained in the article above. Nice piece of trolling about the ice ages, by the way. Transparently the lack of correlation of the existence of a continental ice sheet in the middle of the northern USA and the middle of the Antarctic Ocean has nothing what so ever to do with correlation of temperatures withing a 1200 km radius over land, but still you snuck it in there. As GISS (nor any other temperature index) does not use southern hemisphere temperatures at equivalent latitudes to determine northern hemisphere temperatures (except within 1200 km of the equator), your comments about the ice age are a complete red herring. Transparently so! Actually on topic, if you do not like GISS's 1200 km smooth, their website allows you to create anomaly maps with a 250 km smooth. It even computes the global anomaly for you using only the sub cells within 250 km of a surface station (over land). This is not a superior measure because, unlike the 1200 km smooth it de facto must assume that the temperature anomaly over land of any area more than 250 km from a surface station equals the global average. In effect, it does assume that the temperature anomaly in those isolated regions can be determined by measuring the temperature anomaly at arbitrary longitudes and latitudes in the opposite hemisphere. So I guess your red herring does have a point. It clearly demonstrates the superiority of using the 1200 km smooth over using a 250 km smooth. -
dhogaza at 09:15 AM on 31 May 2011Of Averages and Anomalies - Part 1B. How the Surface Temperature records are built
"The Patagonian Ice Sheet covered about 480,000sq km from around 41 deg S down to Cape Horn." 55 degrees south, the "thin finger" I mentioned above. The southern tip of africa is only about 35 degrees south, so it's not surprising it didn't get covered by ice sheets during various ice ages. Damorbel need to take more care that he doesn't fall off while galloping gish's horse. -
adelady at 09:11 AM on 31 May 2011The Critical Decade - Part 1: The Science
okatiniko. Land rising and coastlines? Remember that GIA includes downward as well as upward movements. Britain is the classic example. The 'advancing' sea in southern England coastal regions is really more like a leverage effect from the rising Scotland land mass. The sea is not advancing so much as the land, in some areas of England, is lowering. Unfortunately, there's no guarantee that the rising/ lowering effects will be matched either in time or in extent. So the GIA numbers are calculated separately to be introduced into the SLR calculations. -
scaddenp at 09:11 AM on 31 May 2011Can we trust climate models?
Charlie A, "Do you have a better suggestion on how to test the hypothesis (or assertion) put forward by PaulFP". His assertion would have the corollary that there would be no term temperature trend. This is easily tested. By comparison, the robust prediction from climate models is the 30 year trend. Climate models make no pretense of being able to predict year to year temperatures or even decade to decade temperatures with current skill. -
skywatcher at 09:09 AM on 31 May 2011Climate Change Denial book now available!
#66 As you know, there are many ways of measuring sensitivity, not just the one you cherry-picked (e.g. Knutti and Hegerl). It's rather hard to have ice ages with low sensitivity. Tom analogises your approach nicely. Actually, I think this thread illustrates very well some points in Haydn and John's book, including deniers using cherry picking, claims of science suppression, use of unsupported science, and diversion when inconvenient truths are pointed out. No denier is willing to evaluate the full gamut of evidence, including all the many different lines supporting each part of the science, and then come up with an hypothesis that both explains all that existing evidence and gives us a reason not to change our carbon-emitting ways. Such an hypothesis does not yet exist, and given the level of testing that climate science has survived over the past century and a half, is extremely unlikely to materialise. So what is left is that we must do something about our carbon-emitting ways. -
Tor B at 08:59 AM on 31 May 2011An Interactive History of Climate Science
This seems to be a great tool to look for certain types of historical papers, especially after including DaneelOlivaw's (#4) idea. To look at a particular year, I went to the previous year, then slid the bar to add one more year, and watched where the circle landed. I've read in Sks, Climate Progress and elsewhere that some scientific papers specifically skeptical about one or another AGW topic have been demonstrated in subsequently published papers to have serious errors, making the skeptical paper's existence (or at least part of it) moot. As I read into CBDunkerson's comment above (#9), all sorts of papers get left behind by developing science. I'm sure there are recently published pro AGW papers that have been effectively refuted by subsequent publications (undoubtedly also pro AGW papers). Could the database identify at least the most grievous of such subsequently refuted or "left behind" papers? Perhaps little circles showing publication years of subsequently refuted papers? Perhaps footnotes by the actual paper titles identifying "partially refuted by subsequent literature" or "substantially refuted by subsequent literature." I'm curious about the 1960 CO2 concentrations paper (pro AGW) Table 1 with some hand written numbers and checkmarks! -
skywatcher at 08:38 AM on 31 May 2011The Critical Decade - Part 1: The Science
Camburn, do you still assert that sea level rise is decelerating, having seen the graphs and sources presented by Albatross in #81 and #87? -
actually thoughtful at 08:29 AM on 31 May 2011An Interactive History of Climate Science
I don't understand what makes a paper neutral. I think this particular graphic is hampered by the large number of neutral. A skeptic will think "well all those neutrals are ACTUALLY skeptical" and all the pro-science people with think "well all those neutrals are ACTUALLY pro-AGW". I think a different metric is needed. Maybe "supports current understanding" or "supports climate myths". I am not saying it is easy. -
skywatcher at 08:15 AM on 31 May 2011Of Averages and Anomalies - Part 1B. How the Surface Temperature records are built
No point in arguing with someone who thinks they're in the business of educating us about the ice ages, or thinks that how you compile a temperature record depends on what you think changed the temperature record. But in case any lurker thinks that mid-latitude ice sheets did not grow in South America and New Zealand (the only land masses at mid-southern latitudes of 40-60S), here's a little info. The Patagonian Ice Sheet covered about 480,000sq km from around 41 deg S down to Cape Horn. Geomorphology is unequivocal on this, though many key references on mapping tend to predate the Internet era - the existence of this ice sheet is not exactly scientific news! A small fraction (~4%) of this ice sheet remains as the North and South Patagonian Ice Sheets. A similar linear ice sheet grew on the Southern Alps of New Zealand, covering ~25% of South Island. Ice sheets grew where they could, but ice sheets don't tend to grow in deep oceans! -
Charlie A at 08:00 AM on 31 May 2011Can we trust climate models?
Diran Marsupial @62 "the errors depicted in your graph are dominated by high-frequency annual variations, something that no model would claim to be able to predict." and "I am assuming that the GISS model E prediction is actually the mean of an ensemble of model runs (comparing the observations with a single model run would be an obviously unfair test). If this is the case, you appear ignorant of the fact that the models attempt only to predict the forced component of the climate. " The GISS-E model response is per the Hansen 2007 paper and data is available at Data.Giss:Climate Simulations for 1880-2003. These are ensembles of 5 runs, GISS-E, ocean C, Russell Ocean. My plot of this data appears to be identical to that of figure 6 of Hansen 2007. Yes, the largest component of the residuals is due to natural climate variability. However, both the naive model and GISS-E are on equal footing in regards to the effect on their errors. Do you have a better suggestion on how to test the hypothesis (or assertion) put forward by PaulFP in comment #59? His assertion is relatively straightforward: "Even climate skeptics use models but, for many, the model is simply that next year will be the same as last year. That sort of model is indeed unreliable. " In keeping with the "Can we trust models" topic of this thread, I think it is an interesting exercise to compare the performance of PaulFP/Skeptics naive model and the GISS-E model. -
scaddenp at 07:58 AM on 31 May 2011Are you a genuine skeptic or a climate denier?
"However, I think the 'enhanced' warming of 3 C cannot be supported. What does that make me? " Someone who has been puzzlingly unable to understand the science despite the enormous effort some people have explaining it to you .... or a wishful thinker who blanks out evidence that is challenging to your position. -
Eric (skeptic) at 07:47 AM on 31 May 2011Are you a genuine skeptic or a climate denier?
KevinC, the link on Prall's site leads here http://www.eecg.utoronto.ca/~prall/climate/list_sources.html which contains lists of "activist" documents and statements (their wording) that is an incomplete starting point for examining the whole of the science. OTOH, starting with a list of papers the way Rob Honeycutt did here http://www.skepticalscience.com/meet-the-denominator.html can ultimately separate AGW with CAGW which have two different bodies of evidence behind them (with some overlap). Then one can say that 97/100 climate experts support the need for immediate action (or something similar). There's a good chance that the (relative) 100 will increase faster than the relative 97 if Prall moves beyond lists of activists. -
Charlie A at 07:47 AM on 31 May 2011Can we trust climate models?
Tom Curtis @61 "The GISS model is not updated annually with real temperatures". The GISS model hindcast was updated each year with the real forcings. In fact, the GISS-E model was able to look forward into the future and know the forcings for the coming year to make the forecast for that year. The naive model of "next year same as last" didn't get to look into the future as did the GISS-E hindcast. I further handicapped the naive model by not adjusting the mean guess. For the GISS-E model, I reduced the error by adjusting the anomaly mean to match the observed mean. -
Alex C at 07:33 AM on 31 May 2011An Interactive History of Climate Science
@Jampack: I would tend to think that those that have been grouping these papers are more careful than that. Did you go to the page that has the papers (so on) sorted by argument? There is an option to only filter down to peer reviewed papers, were you sure to click on that? -
okatiniko at 07:17 AM on 31 May 2011The Critical Decade - Part 1: The Science
Bern & Dhogaza : I don't understand what you mean by local effects and land rising - I thought that satellites measure only the sea level, so why would they be influenced by land rising and anything that happens to coastlines ? I understood that GIA was a global -not local - effect increasing the overall volume of the ocean basin, but it is a real effect. In any case it doesn't change anything to the acceleration term Albatross : the plot of Church & White 2006 is without GIA correction, so actually the rate would have been 3.4 mm/yr in 2006 with GIA correction, and now it is only 3.1 mm/yr, right ?Response:[DB] Actually, glacial isostatic adjustment (GIA), or isostatic rebound, is a regional effect, confined primarily to areas formerly and currently covered (but losing mass) by continental ice sheets and the areas immediately adjacent to them. As the basement rocks are relieved of the immense overburden of ice, they rebound upward. Since the areas next to them had been pushed up slightly while the glaciated areas were depressed, those adjacent areas tend to sink back downwards. This is all well-studied and understood and is incorporated into tide gauge and satellite data.
For further reference, I suggest this Wiki page as a start, plus this page at SkS: Greenland-rising-faster-as-ice-loss-accelerates
You may want to look into the Geoid and Datums if you want even more detail.
-
KR at 07:01 AM on 31 May 2011Of Averages and Anomalies - Part 1B. How the Surface Temperature records are built
Readers Please note that damorbel has a history of arguing for the sake of arguing.. this includes contradicting himself to prolong a discussion. The'2nd law of thermodynamics' thread shows this clearly. I'm seeing the same pattern starting here. -
Jampack at 06:42 AM on 31 May 2011An Interactive History of Climate Science
The possibilities inherent in this graphic approach are stunning for so many areas of human discourse. However, in this case, I wonder about the use of the term "peer-reviewed" when it seems that a skeptic argument published in a known echo chamber for a specific political agenda is given, at least visually, the same weight as a paper published in a peer-reviewed scientific publication. The first skeptic article I checked was published in "American Thinker" which is not a science based publication. -
Mike Lemonick at 06:40 AM on 31 May 2011Even Princeton Makes Mistakes
Rob@109: I wasn't entirely clear, I think. I totally agree with the policy of refuting Happer's ridiculous claims, thoroughly and often. The "banging your head against the wall" comment refers to the idea that Princeton can do anything about him. -
dhogaza at 06:30 AM on 31 May 2011Of Averages and Anomalies - Part 1B. How the Surface Temperature records are built
Damorbel's riding that galloping horse hard ...A feature of historical climate change are the ice ages; these were times when large sheets of ice formed over the land masses of the Northern Hemisphere
45 south is in the middle of the ocean (the "roaring 40s"). 45 north lies about about 30 miles south of where I'm sitting in Portland, Oregon. South America's a thin finger pointing southward, Africa's a blunt thumb, neither is in the least as massive as north america or eurasia and of course the latter two lie at much higher latitudes on average than the southern continents. Antarctica already had a large sheet of ice, BTW. -
dhogaza at 06:19 AM on 31 May 2011Are you a genuine skeptic or a climate denier?
Kudos to RW1 for being honest enough to declare that yes, he is a denier, rather than respond with faux "how dare you equate me with holocaust deniers" etc blah blah blah. Refreshing honesty .. -
DaneelOlivaw at 05:56 AM on 31 May 2011An Interactive History of Climate Science
Would it be possible to see the raw data in a spreadsheet format? (just like Information is Beautiful usually does) -
Camburn at 05:45 AM on 31 May 2011The Critical Decade - Part 1: The Science
Albatross: I have no quible with your post at 76, nor am I alarmed by it at present. Sea Level. 1. first off, what are the error bars of the satillite data. The authors of the papers take them into account and present them. 2. GMSL.....both papers that are being talked about express the difficulty in even DETERMINING current GMSL. 3. GPS as an added source to verify information. Not enough time yet, but hopefully within the next 10 years this valuable tool will provide insight into sea level rise, rate, and actual GMSL. -
Albatross at 05:35 AM on 31 May 2011The Critical Decade - Part 1: The Science
Camburn, I repeat, "Are you going to deny the findings in the scientific literature that I posted @76?"? Also, I am not sure how your quote @85 is meant to support your argument...nice cherry picking too. From Church and White's (2011) abstract: "There is considerable variability in the rate of rise during the twentieth century but there has been a statistically significant acceleration since 1880 and 1900 of 0.009 ± 0.003 mm year-2 and 0.009 ± 0.004 mm year-2, respectively. Since the start of the altimeter record in 1993, global average sea level rose at a rate near the upper end of the sea level projections of the Intergovernmental Panel on Climate Change’s Third and Fourth Assessment Reports" Sea level change for 1870-2001, based on tide gauge measurements, from Church J.A. and White N.J. "A 20th century acceleration in global sea-level rise" Geophys. Res. Lett. 2006; 33: L01602. University of Colorado data are shifted to have the same mean for 1993-2001 as Church and White. The trends were computed for 1870-1920, 1920-1975, 1975-2001 for Church and White data, and 1993 - late January 2011 for University of Colorado data.
[Source]
As for the recent increases, from Tamino's analysis:
Sea level change for 1870-2001, based on tide gauge measurements, from Church J.A. and White N.J. "A 20th century acceleration in global sea-level rise" Geophys. Res. Lett. 2006; 33: L01602. University of Colorado data are shifted to have the same mean for 1993-2001 as Church and White. The trends were computed for 1870-1920, 1920-1975, 1975-2001 for Church and White data, and 1993 - late January 2011 for University of Colorado data.
[Source]
As for the recent increases, from Tamino's analysis:
 "Well well … there seems to be change after all, with both acceleration and deceleration but most recently, acceleration. And by the way, this fit is significant."
Tamino also makes this sage observation and calls the 'skeptics' on their game:
"And now to the really important part, which is not the math but the physics. Whether sea level showed 20th-century acceleration or not, it’s the century coming up which is of concern. And during this century, we expect acceleration of sea level rise because of physics. Not only will there likely be nonlinear response to thermal expansion of the oceans, when the ice sheets become major contributors to sea level rise, they will dominate the equation. Their impact could be tremendous, it could be sudden, and it could be horrible."
Next...
"Well well … there seems to be change after all, with both acceleration and deceleration but most recently, acceleration. And by the way, this fit is significant."
Tamino also makes this sage observation and calls the 'skeptics' on their game:
"And now to the really important part, which is not the math but the physics. Whether sea level showed 20th-century acceleration or not, it’s the century coming up which is of concern. And during this century, we expect acceleration of sea level rise because of physics. Not only will there likely be nonlinear response to thermal expansion of the oceans, when the ice sheets become major contributors to sea level rise, they will dominate the equation. Their impact could be tremendous, it could be sudden, and it could be horrible."
Next...
-
les at 05:27 AM on 31 May 2011An Interactive History of Climate Science
Fab! I've dropped a heads up to Info is Beautiful. -
CBDunkerson at 05:11 AM on 31 May 2011An Interactive History of Climate Science
This is very cool and highly useful for tracking recent research, but I have to wonder about the accuracy of the early tabulations. For instance, Fourier's 1824 paper is listed as 'pro AGW'... but the concept of AGW wasn't even suggested until Arrhenius in 1896. I can sort of see this as 'pro AGW' in that Fourier detected the existence of additional warming which we now call 'the greenhouse effect', but he thought it was most likely due to cosmic rays... which we would now call a 'skeptic' argument. It could be said that Fourier's paper 'supported basic AGW principles' and the things it got wrong were reasonable mistakes at the time (in contrast to arguing cosmic rays NOW)... but it's a fine line. The other thing is that I have to wonder how complete the database is in regards to failed ideas in the early years. There were unquestionably alot of papers on the glacial cycle which suggested all kinds of causes having nothing to do with greenhouse gases. Again, taken a certain way it could be argued that as the AGW theory was not well known (or yet extant) at the time these papers were not 'skeptical' of it per se... but that inherently introduces a paradigm where papers would be classified as 'skeptical' more often as AGW theory became more established. Still, a great resource... and these definitional issues fall away as we get closer to the present and the most up to date science. Indeed, I'd love to be able to exclude years and thus easily see just what 'each side' has put out in the past few years. -
Camburn at 05:07 AM on 31 May 2011The Critical Decade - Part 1: The Science
Dikran: If you cared to read the whole Houston and Dean paper, you will realize the analysis is much more than US tide gauges. -
Camburn at 05:06 AM on 31 May 2011The Critical Decade - Part 1: The Science
I can only urge you folks to read both "Houston and Dean" and Church and White. Using statistical analysis, including error ranges, there is not a lot of difference in their findings. In fact....from Church and White "As in earlier sutdies (using 10 and 20 year windows; Church and White 2006; Church et al 2008), the most recent rate of rise over these short 16 year windows is at the upper end of histogram of trends, but is not statistically higher than the peaks during the 1940's and 1970's." -
dana1981 at 04:52 AM on 31 May 2011Are you a genuine skeptic or a climate denier?
To be fair, you can argue for 0.5°C sensitivity if you also argue that much of the recent warming is due to internal variability (which is another denial argument, but one which Spencer/Christy/Lindzen use to justify their ridiculously low sensitivity denial - i.e. see Lindzen Illusion #7). -
CBDunkerson at 04:46 AM on 31 May 2011Are you a genuine skeptic or a climate denier?
RW1: "Not more than about 1 C and probably more like 0.5 C or less." We passed 0.5 C a couple of decades ago. So, the only 'logical' way you could still hold such a position would be if you deny the accuracy of the surface temperature record... and the various proxy records which corroborate it. You'd also have to deny that the consistency of the satellite temperature reconstructions for the period of overlap supports the accuracy of the surface records... AND ignore the fact that those satellite records are now themselves approaching 0.5 C after just 30 years. In short, if your position can only be maintained by denying the validity of all available evidence then you are definitely not a 'skeptic'. -
Albatross at 04:08 AM on 31 May 2011An Interactive History of Climate Science
Congratulations and kudos to all involved! -
Rob Honeycutt at 03:59 AM on 31 May 2011An Interactive History of Climate Science
It might be worth while to add tags that allow this to come up in google searches along side Pop[you-know-who]'s 900 papers. -
RW1 at 03:58 AM on 31 May 2011Are you a genuine skeptic or a climate denier?
Yes, to the extent possible (of 3 C rise), I'm a denier. -
Albatross at 03:52 AM on 31 May 2011The Critical Decade - Part 1: The Science
Indeed Dikran @83, if anything the 'skeptics' and those in denial about AGW are very consistent....normally that would be a good thing, but not so in this context. -
Dikran Marsupial at 03:42 AM on 31 May 2011The Critical Decade - Part 1: The Science
Albatross There is a certain irony in Camburn claiming that "Some of us contrarians like to try and view SLR in its entirety" immediately after directing you to a paper analysing SLR focussing on a small sample, of tide gauges from the US. ;o) -
dana1981 at 03:39 AM on 31 May 2011An Interactive History of Climate Science
Great job with the app Paul, it's super cool. And nice work by Ari and Rob P to add so many papers, too! -
Albatross at 03:35 AM on 31 May 2011The Critical Decade - Part 1: The Science
Nice analogy @80 JMurphy. -
Albatross at 03:34 AM on 31 May 2011The Critical Decade - Part 1: The Science
You are making a strawman argument @78 Camburn, and you know it. Are you going to deny the findings in the scientific literature that I posted @76? Houston and Dean is not good science-- I expect some poor overworked scientist who is an expert in the field now has to waste time refuting yet another dodgy scientific paper published by 'skeptics' in the scientific literature (peer-review is just the first step in establishing whether or not a paper is any good). It was probably also written to feed fodder to those in denial about the seriousness of AGW; people like you Camburn who will uncritically accept their convenient findings. In contrast, the findings of Church and White (2011) [I suggest that you read that, it is comprehensive and rigorous, much more so then Houston and Dean] are not convenient for me, nor do they make me feel better about the reality we are facing. But I am not going to think of every reason under the sun to delude myself that there is not a very real and serious issue that needs to be dealt with. Here is a yet reminder for you: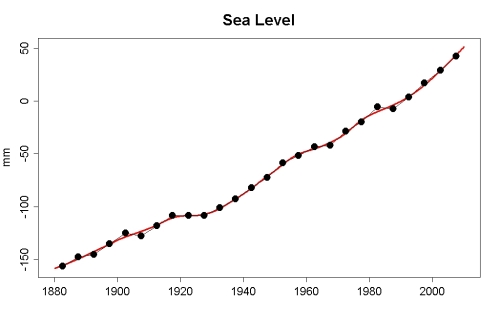 [Source]
Until an official refutation of Houston and Dean appears in the reputable literature, we will have make do with this critique of Dean and Houston by a professional statistician. To quote Tamino:
"Why do they use tide gauge records from just U.S. stations? Why not a global sample? Why use individual tide gauge records when we have perfectly good combinations, from much larger samples, which give a global picture of sea level change and show vastly less noise? Why do they restrict their analysis to either the time span of the individual tide gauge records, or to the period from 1930 to 2009? Why do they repeatedly drone on about “deceleration” when the average of the acceleration rates they measure, even for their extremely limited and restricted sample, isn’t statistically significant?"
And
"As for the “bombshell” research from Houston & Dean, I have one more question: with bombshells like this, who needs creampuffs?"
Next....
[Source]
Until an official refutation of Houston and Dean appears in the reputable literature, we will have make do with this critique of Dean and Houston by a professional statistician. To quote Tamino:
"Why do they use tide gauge records from just U.S. stations? Why not a global sample? Why use individual tide gauge records when we have perfectly good combinations, from much larger samples, which give a global picture of sea level change and show vastly less noise? Why do they restrict their analysis to either the time span of the individual tide gauge records, or to the period from 1930 to 2009? Why do they repeatedly drone on about “deceleration” when the average of the acceleration rates they measure, even for their extremely limited and restricted sample, isn’t statistically significant?"
And
"As for the “bombshell” research from Houston & Dean, I have one more question: with bombshells like this, who needs creampuffs?"
Next....
-
JMurphy at 03:30 AM on 31 May 2011The Critical Decade - Part 1: The Science
Ken Lambert wrote : "This cannot mean anything else than SLR slowing or decelerating - not accelerating." That is so obvious, if you're a so-called skeptic, is it not ? In fact, to take the 'obvious' further, into temperature increases, it is 'obvious' that while temperatures increase as Spring moves into Summer, eight or nine or ten days of cooler than average temperatures mean that temperatures are slowing or decelerating - not accelerating. It cannot mean anything else...if you're a so-called skeptic. -
damorbel at 03:29 AM on 31 May 2011Of Averages and Anomalies - Part 1B. How the Surface Temperature records are built
Re #14 MarkR You wrote:- "at 1200 km separation the temperature change correlation coefficient dropped below 0.5, so used 1200 km as their cut off for weighting." For a start a correlation coefficient of 0.5 is rather low. Also it is only related to climate change of any cause, the figures are just as valid for Svensmark's cosmic ray theory as for CO2. As far as HL87 is concerned, it is about 'filling in for missing stations' A feature of historical climate change are the ice ages; these were times when large sheets of ice formed over the land masses of the Northern Hemisphere. During the ice ages Antartica and the Southern Hemisphere did not acquire large sheets of ice, substantially beyond what they have now. The meaning of this being that climate change is not correlated over the Earth's surface. -
Dikran Marsupial at 03:26 AM on 31 May 2011The Critical Decade - Part 1: The Science
camburn@78 Looking at the number of times the paper has been cited and in what context is usually a good start. Looking at the publication record and expertise of the authors is another. It is always a good idea to apply some skepticism to any new paper, because until there has been time for the research community to digest and either refute, take up or ignore the ideas it puts forward, we are not in a good position to judge its value. This is especially true of papers adopting a controversial stance, they generally turn out to be wrong - for every Galileo, there are thousands of scientists who are simply mistaken. This happens in all fields, not just climatology, I can tell you for certain there are loads of dud papers that get published every year on statistics. Generally their fate is that they are ignored and receive no citations. Most of the papers that form the underpinnings of AGW theory have been in print for a long time, have been widely discussed/criticized, and have withstood the criticism. That means they are very likely (but not certain of course) to be correct. -
Paul D at 03:23 AM on 31 May 2011An Interactive History of Climate Science
Daniel@4 one of the ideas for a future version is to have a search option, so that you could select a topic and it will display the number of papers in each year for that topic in the appropriate 'argument'. -
DaneelOlivaw at 03:18 AM on 31 May 2011An Interactive History of Climate Science
I'm not sure about that categorization. I think that what's relevant is how many papers agree with the basic consensus that the Earth is warming and we are the primary cause. Many of the skeptic arguments wouldn't undermine that conclusion even if true. Overall I think that Oreske's method is simpler, clearer and more relevant to the discussion. If you want tu pursue this type of classification, maybe you could filter by argument. So the graph could tell you, for each argument, how many papers are for, and how many against. -
Rob Honeycutt at 03:07 AM on 31 May 2011Are you a genuine skeptic or a climate denier?
RW1 @ 21... "Not more than about 1 C and probably more like 0.5 C or less." You original question was, "What camp does this put me in?" This would clearly put you in the denier camp because to accept that proposition you have to deny a wide range of existing research that suggests otherwise, all consisting of papers which appropriately apply scientific skepticism. -
Camburn at 03:02 AM on 31 May 2011The Critical Decade - Part 1: The Science
And Albatross: How do you know your papers are correct verses other papers written by distinguished scholars? -
Camburn at 03:01 AM on 31 May 2011The Critical Decade - Part 1: The Science
Albatross: I can only suggest that you read this paper. Some of us contrarians like to try and view SLR in its entirety.Moderator Response: [Dikran Marsupial] hot linked paper -
dana1981 at 02:57 AM on 31 May 2011Are you a genuine skeptic or a climate denier?
RW1 @21: claiming sensitivity is just 0.5-1°C for doubled CO2 (3.7 W/m2 forcing) denies the massive body of research using many different lines of evidence that all consistently shows otherwise. Just as one example, it's nearly impossible to explain the ~5°C warming between glacial and interglacial period if sensitivity is that low. Also see the forthcoming Christy Crock #6: Climate Sensitivity which is due to be published sometime in the next week.
Prev 1678 1679 1680 1681 1682 1683 1684 1685 1686 1687 1688 1689 1690 1691 1692 1693 Next


