


 Arguments


Recent Comments
Prev 1697 1698 1699 1700 1701 1702 1703 1704 1705 1706 1707 1708 1709 1710 1711 1712 Next
Comments 85201 to 85250:
-
Albatross at 01:14 AM on 21 May 2011Lindzen Illusion #5: Internal Variability
Stephen @124, Thanks. BP is also very likely not comparing apples with apples-- he is conflating different data. And notice how the goal posts have shifted...the 'skeptics' are shown that heat uptake is occurring in the deep ocean waters and that doing so increasing the positive slope in OHC, the 'skeptics' do not acknowledge that but instead then ask how heat uptake can occur down to 2000 m or deeper. That is addressed, the 'skeptics' ignore that, and then try to demonstrate that that is not what is happening and that it is 'unphysical' using data from different datasets (yes Argo, but with different assumptions, post processing, corrections etc.) . And note how they repeatedly refuse to answer this question: "And again, please provide some context--what the does this all have to do with Lindzen's illusion about the warming arising from internal variability?" It has been presented bold text, underlined text, so I know they have seen it. -
Stephen Baines at 00:33 AM on 21 May 2011Lindzen Illusion #5: Internal Variability
I want to add that, from an oceanography viewpoint, the real value of the Argo floats isn't in balancing the global heat balance, important though that is. The oceanographic interest is in understanding the interaction between water masses at depth, and the implications for fluxes of matter, energy and, ultimately, biological processes. Of course, the findings will impact climate science. We know very little about deep sea processes, and I'm sure there will be surprises ahead. Exciting times for physical oceanographers! -
Tom Curtis at 00:27 AM on 21 May 2011Oceans are cooling
Charlie A, I would agree that the total OHC would be a reasonable proxy for global radiative imbalance. Obviously the more heat reservoirs you include (ice melt; atmospheric heat; land heat) the better it is. Conversely the more restricted the Ocean Heat you measure (top 700 meters, top 300 meters) the less valuable a proxy it is.) Having said that, it seems evident that flows between different heat reservoirs in the climate system are large relative to the annual increase in OHC. Also measurement error prior to 2005 has to be considered significant at annual resolution. Therefore I would not consider annually resolved OHC a good proxy at this time. -
Stephen Baines at 23:55 PM on 20 May 2011Lindzen Illusion #5: Internal Variability
"Are we being asked to believe that warmed surface water travels down through a 700m column of water of lower temperature without giving up heat to that column?" All that is required is for heat in the 0-700m layer to be transported to deeper water at a rate that balances the influx into the 0-700m layer from above. Remember, surface waters are sandwiched between the atmsophere and deeper waters. The heat balance of surface waters is governed by inputs/outputs from above and inputs/outputs with deeper waters. A lot of heat can move through surface waters without there being a net gain in heat in surface waters. -
Ken Lambert at 23:30 PM on 20 May 2011Lindzen Illusion #5: Internal Variability
BP #121 "On the other hand the studies do not provide any description of a conceivable physical process that could accomplish such a quest. Nor could I find other studies attempting the same. Therefore if one does not "fully understand that there are mechanisms by which deep ocean heat uptake can occur" without ever touching the upper layers, one is not alone" Precisely. If heat is being found by VS and Levitus in the 700m to 2000m range and NOT in the 0-700m layers, then a physica;l explanation is necessary. Are we being asked to believe that warmed surface water travels down through a 700m column of water of lower temperature without giving up heat to that column? For that to occur the warm surface water must be packaged in insulated bags which suddenly pop open when propelled below 700m. Albatross #122 "Anyhow, IIRC, you both seem to think that the heat cannot be going below 700m, and if it is, only a trivial amount is. Now above you seem to be arguing that too much heat is being mixed downwards, although I'm pretty sure that that deduction is probably b/c of the above-mentioned issues" No, what BP is saying is that heat cannot travel below 700m without showing up in the 0-700m layers. That means that one could have heat in both places, but heat travelling from the top down must produce a warm gradient through the column however far down it goes. -
Charlie A at 23:22 PM on 20 May 2011Coral atolls and rising sea levels: That sinking feeling
Main article: "Thousands of guyots are spread throughout the Pacific. These were once coral atolls, but "drowned" when they passed the Darwin Point." Does anybody have a map that shows the geographical distribution of Guyots? The ones I have heard about, such as the Emperor seamounts are at the far northern or far southern reaches of coral growth areas. In looking at peer reviewed literature, I see discussions of Darwin point in terms of latitude such as varying between N24 and N30 degrees, depending upon the geologic era. Are there numerous Guyots in the tropics? -
Charlie A at 22:33 PM on 20 May 2011Oceans are cooling
I see Pielke Sr's graph no more cherry picking than are temperature anomalies. Anomalies are looking at changes in temperature. Pielke's graph is looking at changes in OHC. @Tom Curtis -- do you agree that the change in OHC, at least in theory, is a good proxy for the global radiative imbalance ? If you agree, then the question becomes, over what period must we measure OHC in order to get a reasonably accurate estimate of radiative imbalance over that period. Obviously, with poor spatial and temporal distribution of samples, the period over which one must average must be longer. With more complete coverage, such as with Argo over the last several years, the period over which we can accurate deduce global radiative imbalance becomes shorter. ------------------------- When looking at temperature anomolies, the absolute temperature becomes less important. When looking at the OHC to diagnose radiative imbalance over the last 8 (or 6, or 5) years, the absolute starting point of the OHC graph is not relevant. -
chris1204 at 21:01 PM on 20 May 2011Polish translation of The Scientific Guide to Global Warming Skepticism
Gratuluję i życzę powodzenia moim kolegom w Polsce. Krzysztof1204 Translation Congratulations and all success to my Polish friends. Chris1204 (yes I happen to be Polish) -
Paul D at 20:00 PM on 20 May 2011Polish translation of The Scientific Guide to Global Warming Skepticism
Cool, I'm continually amazed by the amount of effort that is made by such a diverse bunch of people, who have never met and get no payment for their efforts. -
JMurphy at 19:00 PM on 20 May 2011Abraham reply to Monckton
KaneWilliams, a thread at The Blackboard, which contains the following email from Abraham, should interest you : Lucia, on June 10 he sent me this document. It sounds like he hasn’t changed it since then. My reply is that I continue to stand by my work, I invite people to view it and come to their own conclusions. Finally, my university has not asked me to remove the presentation. How is that for a reply? As should these links : Monckton embarrasses himself further Monckton's response to John Abraham is magnificently bonkers Monckton's reply to Abraham, and how science really works By the way, it is never a good idea to use links to WUWT - unless you include some humour or irony in your comment... -
Gareth at 17:35 PM on 20 May 2011Carter Confusion #1: Anthropogenic Warming
Hi Dana - yes, you have him nailed. He is an honorary fellow of the Royal Society of NZ, because he did much good work in NZ. He gets (arguably too much) of a free ride from senior NZ academics because he was helpful in many of their early careers. -
Rob Painting at 16:02 PM on 20 May 2011Coral atolls and rising sea levels: That sinking feeling
Stephen Baines, re- guyot depth, actually I was certain my original reference was correct, but couldn't find the study where I got that information from (my computer is a jumble of thousands of papers and links). I've altered the text, to avoid further quibbles. -
Rob Painting at 15:56 PM on 20 May 2011Coral atolls and rising sea levels: That sinking feeling
Charlie A -most summits lie 1,000 to 2,000 metres (3,300 to 6,600 feet) below sea level-Yes. That's pretty deep to be a drowned atoll" See Flood 1999 (link provided in the advanced version), the seven guyots drilled were between 1-2 kms below sea level. A lot can happen over the course of tens of millions of years. -
angusmac at 15:54 PM on 20 May 2011Lindzen Illusion #2: Lindzen vs. Hansen - the Sleek Veneer of the 1980s
@100 to 102, I do agree that aerosols could turn out to be a "Faustian Bargain". I also agree that they would probably be a temporary blip similar to Schmidt's 1940s aerosol blip.The use of aerosols was my suggestion for getting Scenario B to work if you wished to use a sensitivity greater than the 2.7°C used in Dana's Scenario D.
-
angusmac at 15:53 PM on 20 May 2011Lindzen Illusion #2: Lindzen vs. Hansen - the Sleek Veneer of the 1980s
@97 to 99, I am aware that Scenario C emissions have been significantly lower than real-world emissions since 2000. Therefore, Scenario C temperature projections should be below observed temperatures but this is obviously not the case. Real-world temperatures track Scenario C very closely from 1958 to present. Coincidence? Perhaps.Dana addressed this problem with his 2.7°C sensitivity Scenario D and achieved good results. However, this change is not "minor". It has resulted in the 2019 temperature projections plummeting from 1.57°C/1.10°C in Hansen (1988) to 0.69°C in Dana (2011).
This is a dramatic drop of either 0.88°C or 0.41°C depending on which version of Hansen 1988 you prefer.
-
Stephen Baines at 14:52 PM on 20 May 2011Coral atolls and rising sea levels: That sinking feeling
scaddenp Yes, that's of course correct. I was thinking in terms of guyots formed during the last few glacial cycles, as that is what the post focuses on. But older guyots could get quite a bit deeper as plates move. There is a technical definition that a guyot has to be a certain height above the seabed. I thought it was 1km, but that's from memory. -
scaddenp at 14:31 PM on 20 May 2011Coral atolls and rising sea levels: That sinking feeling
Just remember that any seamount can deep below current sea surface because of subsidence, not that sea was once that low. Mid-ocean ridge volcano cones move into deep water as the ocean crust subsides and the plate expansion moves it away from the spreading center. Determining whether something was once an atoll in its dim and distant past would at first look involve looking at morphology. -
Charlie A at 14:09 PM on 20 May 2011Coral atolls and rising sea levels: That sinking feeling
#2 Stephen Baines "Rob, when you say a Guyot is 1500 m "below the sea surface", I think you mean "above the seafloor." That would be pretty deep to be a drowned atoll." A number of references indicate that 1500m below the sea surface is not atypical. For example, Encyclopedia Britannica: "In the Pacific Ocean, where guyots are most abundant, most summits lie 1,000 to 2,000 metres (3,300 to 6,600 feet) below sea level." Yes. That's pretty deep to be a drowned atoll. -
Daniel Bailey at 13:32 PM on 20 May 2011Lindzen Illusion #2: Lindzen vs. Hansen - the Sleek Veneer of the 1980s
@ Albatross Hansen has a great deal to say about aerosols as a negative forcing in his book Storms of My Grandchildren (Pgs. 98-99). Without aerosols, net forcing is about 3 watts (W m2). Aerosols have a forcing of 0 to -3 watts, with a most likely value of -1 watt, thus reducing net forcing to 2 watts. Thus, aerosol cooling might be masking about one-third the greenhouse forcing. But if aerosol forcing is -2 watts, reducing the net forcing to 1 watt, then aerosols have been masking most of the warming. Further cleaning up the air would then result in a doubling of the net climate forcing from what we've been observing. Hence his labeling of our GHG/aerosol emissions as a "Faustian Bargain". -
Albatross at 13:01 PM on 20 May 2011Lindzen Illusion #2: Lindzen vs. Hansen - the Sleek Veneer of the 1980s
Michael @100, Re aerosols, yes, that is why it is so very unfortunate that the the Glory satellite did not make it into orbit a few months ago. That would have been an invaluable mission. -
Bern at 12:59 PM on 20 May 2011Carter Confusion #1: Anthropogenic Warming
scaddenp: yes, I understand Plimer is (was?) also one of the best geologists in Australia. Why they feel that makes them experts in climate science, I'm not sure. It seems to be a surprisingly common position amongst geologists. I suspect it's because they know enough about paleoclimate to understand the massive variation the earth's climate can have on geological time scales, while failing to understand that what we're staring down the barrel of now is on a human time scale - i.e. 100s or 1000s of times faster. -
Tom Curtis at 12:33 PM on 20 May 2011Oceans are cooling
Charlie A @67, I do not think anyone on this forum has accused you of Cherry Picking because of your graph with its start point in 1980. Nor is there anything wrong with that graph beyond the fact that it labels the OHC of the 0 to 700 meter layer as being the OHC simpliciter (a fault of the source of the graph, but not the sources documentation). Tamino's graph was produced in one of two recent posts pointing out, and rebutting denier cherry picking. It is not a rolling five year average as DB's initial comment might suggest, but a plot of successive non-overlapping five year averages with the penultimate point being the mean of the years 2005-2009, and the last datum being an average of the data from January 2010 to present. (See the comment by Ned.) I personally think Tamino should have made the years 2006-2010 the final datum to not compare apples and oranges, but that is a minor point and would not make a substantive difference to the graph. I say it makes no substantive difference because the mean of 2001-2005 would clearly be less than the mean of 2006-2010. Indeed, based on your plot of the running 21 quarter mean, it would be about 2.5*10^22 Joules less, which suggests that Tamino's use of just over a years data for the final datum under estimates the trend rather than over estimates it. The red line on Tamino's graph plots a lowess smooth of the original data (not the means). In this case it overstates the final trend in the data, but in another example it understates it, so clearly Tamino is not fiddling with the smooth to exaggerate the trend. When I say Tamino was rebutting cherry picking, I mean examples like this from Bob Tisdale: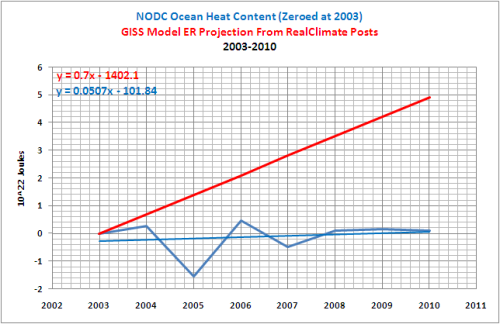 (Copied from Tamino)
Or this recent example by Berényi Péter in a comment on Skeptical Science:
(Copied from Tamino)
Or this recent example by Berényi Péter in a comment on Skeptical Science:
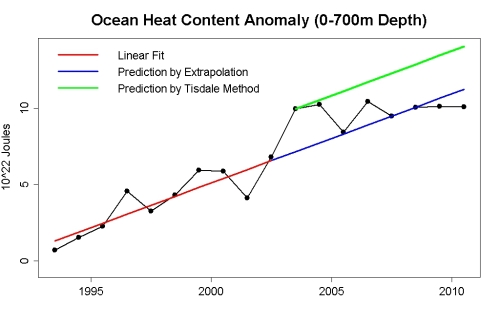
 In the later case, Berényi Péter simply wants to treat all pre-2003 data as void. That is, of course, absurd. The pre-2003, indeed, the pre-2005 OHC data is rightly suspect for determining inter-annual variability. It is, however, fairly robust for determining the decadal trend. As I have pointed out above, assuming the pre-2003 trend to be significantly different from that recorded implies a multitude of bizzare, and unsubstantiated hypotheses. (BP's effort was, of course, a double cherry pick in that he selects the 0-700 meter data when 0-2000 meter data was readily available.)
In Bob Tisdale's case, the cherry pick involves picking the year with the largest departure above the trend line as a start point for the prediction. This has the straight forwardly dishonest effect of displacing the "predictions" above the trend line so that even should data follow the trend, they will still be seen to be below the doctored "predictions".
In the later case, Berényi Péter simply wants to treat all pre-2003 data as void. That is, of course, absurd. The pre-2003, indeed, the pre-2005 OHC data is rightly suspect for determining inter-annual variability. It is, however, fairly robust for determining the decadal trend. As I have pointed out above, assuming the pre-2003 trend to be significantly different from that recorded implies a multitude of bizzare, and unsubstantiated hypotheses. (BP's effort was, of course, a double cherry pick in that he selects the 0-700 meter data when 0-2000 meter data was readily available.)
In Bob Tisdale's case, the cherry pick involves picking the year with the largest departure above the trend line as a start point for the prediction. This has the straight forwardly dishonest effect of displacing the "predictions" above the trend line so that even should data follow the trend, they will still be seen to be below the doctored "predictions".
 (From Tamino)
From your 66 above, it is plain that you are not trying to cherry pick in any such fashion. That makes it rather surprising that you chose to defend Pielke's rather straightforward cherry pick in 2007. Contrary to your claim, both Willis et al 2004 (which Pielke references) and Lyman, Willis and Johnson 2006 (which, surprisingly, he does not) show 2003 as the highest datum point, and indeed, 2003 lies above the long term trend in both. Despite this, in the true spirit which Tidale later copied), Pielke makes the 2003 the start point of his "prediction" for future OHC as a test case for AGW.
Finally there is nothing wrong with choosing 2003 (or better 2005) as a start year for an analysis of OHC. What is wrong is suggesting that previous measurements of the OHC trend are some how invalid because they predate the "Argo era". There are certainly issues in resolving annual variability in OHC prior to 2005, but that is not the same as issues resolving decadal trends. On this point I will let Willis have the last word:
(From Tamino)
From your 66 above, it is plain that you are not trying to cherry pick in any such fashion. That makes it rather surprising that you chose to defend Pielke's rather straightforward cherry pick in 2007. Contrary to your claim, both Willis et al 2004 (which Pielke references) and Lyman, Willis and Johnson 2006 (which, surprisingly, he does not) show 2003 as the highest datum point, and indeed, 2003 lies above the long term trend in both. Despite this, in the true spirit which Tidale later copied), Pielke makes the 2003 the start point of his "prediction" for future OHC as a test case for AGW.
Finally there is nothing wrong with choosing 2003 (or better 2005) as a start year for an analysis of OHC. What is wrong is suggesting that previous measurements of the OHC trend are some how invalid because they predate the "Argo era". There are certainly issues in resolving annual variability in OHC prior to 2005, but that is not the same as issues resolving decadal trends. On this point I will let Willis have the last word:
"Second, This estimate only goes back to 2005. The reason for this is that Argo still has a number of floats for which no PI has responsibility for quality control of the data. For early incarnations of these floats, this could mean that significant (albeit correctable) biases still exist in the pressure data. Normally, these biases are corrected by the PI, but since these floats are sort of homeless, they have not yet been corrected. It is also difficult (or in many cases impossible) for the end user to correct these pressure data themselves. Argo is still trying to figure out how to deal with these data and I sure they will receive bias corrections eventually, but for the moment we need to exclude them. So, for this reason I am still not comfortable with the pre-2005 estimates of heat content. Anyway, the consequence of this is that we still do not have a good estimate of ocean heat content changes from about 2002 to 2005, when the dominant data source for ocean heat content went from XBTs to Argo floats. For this reason, I remain a bit skeptical of any heat content estimates during that period. That said, however, I do think that longer-term estimates like those of Levitus et al., Domingues et al., and Lyman et al. are robust with respect to the long-term heat content increases. The issue with the 2002-2005 period is that the uncertainty during this period is still much larger than any year-to-year fluctuations that may exist."
(From an email to Roger Pielke Snr)Response:[DB] If my sloppy attribution of Tamino's graph is the cause of all this, I humbly apologize to all parties.
-
Michael Hauber at 12:25 PM on 20 May 2011Lindzen Illusion #2: Lindzen vs. Hansen - the Sleek Veneer of the 1980s
I think the idea that actual forcings may match scenario C closer than scenario B is intriguing. A lot depends on the aerosol forcing, which is the only reasonable candidate for causing a flattening of forcing since 2000. As far as my google skills and level of patience can tell,there is no direct measurement of aerosol forcings. I have found a paper from 2004 discussing the need for such measurement. http://glory.gsfc.nasa.gov/publications/2004_JQSRT_88_149.pdf So if there is no direct measurement, that must mean that aerosol forcings used in models such as GISS E are indirect estimates based on calculations such as looking at economic activity etc? A few years ago I made an amateur attempt at trying to indirectly calculate aerosol forcings using Co2 emission data. Assuming that aerosol emissions and Co2 emessions have grown at the same rate and guessing some parameters to match total changes in aerosol forcings over the last century, and the claim I have read that most aerosols only last in the atmosphere for about 3 years, I was able to generate a forcing profile that peaks around 2002 and actually decreases for a few years. This is due to the explosive growth in activity in China in the last decade, and the fact that due to the 3 year lifespan of aerosols, aerosols react much faster to changes in economic activity than Co2 does. This crude analysis of course did not take into account the effects of clean air legislation, but I would expect that as the recent growth in emissions is largely in China that this would not be an issue? If the China effect really is the cause of a dog-leg in forcings, and forcings really do follow scenario C, then this will not last. Due to the short life time of aerosols, Co2 accumulation from the China boom will steadily overcome the short term aerosol effect and the forcing will steadily rise to meet and maybe overtake scenaerio B in the next decade or so. -
Marcus at 10:40 AM on 20 May 2011Carter Confusion #1: Anthropogenic Warming
Dana, if you need to be sure, just listen to him say words like fish & chips or six. If it sounds more like Fush & Chups or Sux, then he's almost certainly a New Zealander ;-). Sorry for the OT post, but just had to poke a bit of fun at our Trans-Tasman cousins. -
scaddenp at 10:14 AM on 20 May 2011Carter Confusion #1: Anthropogenic Warming
While I am baffled by Carter's take on climate - especially recitation of things he must know are wrong - I wouldn't rush to wholesale condemnation either. He was stimulating teacher when I attended Otago University(NZ) in the 1970s and he has made excellent scientific contributions to NZ geology. I would read with some respect what he published in the scientific literature - just not what he says to media, very much like Lindzen. The "gone Emeritus" phenomena perhaps? -
bibasir at 09:24 AM on 20 May 2011Carter Confusion #1: Anthropogenic Warming
I love the quote from Richard Alley's book Earth, The Operators Manual. "The natural-not-human problem that isn't happening and wouldn't matter is too big to handle." -
SouthWing at 09:22 AM on 20 May 2011Carter Confusion #1: Anthropogenic Warming
RealClimate has the right idea for the CWs of this world: a bore hole for them to live in. -
dana1981 at 09:17 AM on 20 May 2011Carter Confusion #1: Anthropogenic Warming
It looks like Carter was originally from NZ and works in Australia, eh Gareth? -
KaneWilliams at 09:15 AM on 20 May 2011Abraham reply to Monckton
I've been trying to find out where this thing went? Was Abraham making false accusations etc. Monckton claims that Abraham was misquoting him etc. I found this, which does appear to indicate some wrong doing on Abraham's part. http://wattsupwiththat.com/2010/07/14/abraham-climbs-down/ -
Albatross at 09:07 AM on 20 May 2011Lindzen Illusion #5: Internal Variability
BP @121, I'm running around putting out some "fires" right now and tonight-- so I do not have time to fact check your numbers or reasoning. But a quick read of your post suggests that you are possibly contradicting earlier assertions made by Ken and perhaps even yourself. I would caution arbitrarily comparing numbers for different depths from different studies as they process the data differently and make different corrections. I can't recall, does VS 2011 separate out the OHC into layers, say 0-700, 700-1500 etc.? If yes, then you should be comparing those numbers. Anyhow, IIRC, you both seem to think that the heat cannot be going below 700m, and if it is, only a trivial amount is. Now above you seem to be arguing that too much heat is being mixed downwards, although I'm pretty sure that that deduction is probably b/c of the above-mentioned issues. My point was and still is this-- if one includes the data below 700 m from 2003 onwards (as per Trenberth 2010), the positive slope of the OLS line fitted to the OHC increases. Do you deny that? -
Berényi Péter at 08:38 AM on 20 May 2011Lindzen Illusion #5: Internal Variability
#119 Albatross at 01:18 AM on 20 May, 2011 It is odd that you and BP are arguing that the OHC can't be increasing below 700 m, but do not fully understand that there are mechanisms by which deep ocean heat uptake can occur. Quite the contrary. If you compare data provided by Fig. 5 (middle panel) Schuckmann 2011 (OHC above 1500 m) and NOAA NODC OCL Global Ocean Heat Content (OHC above 700 m), based on Levitus 2009, it turns out much more heat is sequestered between 700 m and 1500 m than in the upper 700 m (expressed as the partial planetary imbalance at TOA going to the respective layer). 2005-2010, 0-700 m: 139 ± 55 mW/m2, 700-1500 m: 396 ± 57 mW/m2 That is, in this period about three times more heat went to the 800 m thick layer below 700 m than above it. It is even more interesting for the last five years. 2006-2010, 0-700 m: −7 ± 67 mW/m2, 700-1500 m: 427 ± 56 mW/m2 That is, since the beginning of 2006 nothing stayed above 700 m. Both studies provide proper error bars, so these results are unequivocal. On the other hand the studies do not provide any description of a conceivable physical process that could accomplish such a quest. Nor could I find other studies attempting the same. Therefore if one does not "fully understand that there are mechanisms by which deep ocean heat uptake can occur" without ever touching the upper layers, one is not alone. Albatross, if you happen to know such a reference, please show us. Otherwise we are forced to believe either Levitus 2009 or Schuckmann 2011 is flawed. Or both. -
scaddenp at 08:03 AM on 20 May 2011Oceans are cooling
CharlieA - your link to previous discussion is broken. Hansen 2011 is also only looking at 2005-2010 for Argo but reaching very different conclusions.If you dont like VS 2011 for OHC, what is your objection and do you have better? As to Tamino, I think that his claim of cherry picking as a motive is suspect - the stated reasons for starting at 2003 are also valid - but the comments on the effect of starting at 2003 still stand. One thing is for sure, Argo is a superb tool and another 5 years of data is going to be very interesting.Response:[DB] Fixed Link.
-
Gareth at 06:51 AM on 20 May 2011Carter Confusion #1: Anthropogenic Warming
Small point: Carter is one New Zealander we are very happy to have Australia claim as one of their own...Response:[dana1981] Is he? We Americans have a hard time distinguishing between Aussies and New Zealanders (if Flight of the Conchords is any indication, that was a highly offensive statement). I was always under the impression Carter was an Aussie, but I'll take your word for it.
-
Rob Painting at 06:09 AM on 20 May 2011Coral atolls and rising sea levels: That sinking feeling
Whoops, sorry about the typos guys and gals. Stephen Baines - Yes it would be!. Corrected thanks. -
Richard McGuire at 06:09 AM on 20 May 2011Coral atolls and rising sea levels: That sinking feeling
An interesting and informative article, particularly as it relates to the following comments in Ian Plimer's Heaven and Earth. On page 310 "the ocean floor around Tuvalu is sinking" and on page 321, "Tuvalu's problems have nothing to do with global climate change." -
John Hartz at 05:45 AM on 20 May 2011National Academy of Sciences on Climate Risk Management
Turns out that "America's Climate Choices" is actually the fifth (not the fourth) in a series of NRC reports on climate change. The lead sentence of this article should be edited accordingly. -
Paul D at 05:12 AM on 20 May 2011Coral atolls and rising sea levels: That sinking feeling
Shouldn't that be Holocene Reef Growth? -
les at 04:21 AM on 20 May 2011Carter Confusion #1: Anthropogenic Warming
15 - Albatross "I sincerely hope that people following this thread take what CW states/claims as 'truth' with a grain of salt.". Some will cheer him, others will frown; but I'm sure I'm not alone in reading SkS for the quality of the science and give the noise produced by 'skeptics' no more than a wry smerk. -
mclamb6 at 04:21 AM on 20 May 2011Oceans are cooling
Tamino isn't "heralded as a 'world-class professional time-series analyst' for his [OHC] plot." He established his bona fides long prior. The question is whether you will take your concerns directly to Tamino or if you will remain on a separate site criticizing his work... -
John Hartz at 04:12 AM on 20 May 2011Coral atolls and rising sea levels: That sinking feeling
@Dana Thanks for the clarifications. @Rob Kudos on an excellent article and series of rebutttals. -
gpwayne at 03:44 AM on 20 May 2011Coral atolls and rising sea levels: That sinking feeling
Chaps - there's a typo where you refer to Darwin 1942 - don't think he lived quite that long... :)Response:[dana1981] Survival of the fittest. He was just really, really fit!
Actually it should say 1842. Change made, thanks.
-
Charlie A at 03:29 AM on 20 May 2011Oceans are cooling
Scaddenp -- you and others are perhaps confused about my statements because the posts above are a continuation of a discussion that started here. My depiction of OHC was somehow considered to be cherry picking and improper smoothing, while Tamino was heralded as "a world-class professional time-series analyst" for his plot. Described by Skeptical Science moderator DB as "Smoothed (5-year averages), one gets this:"
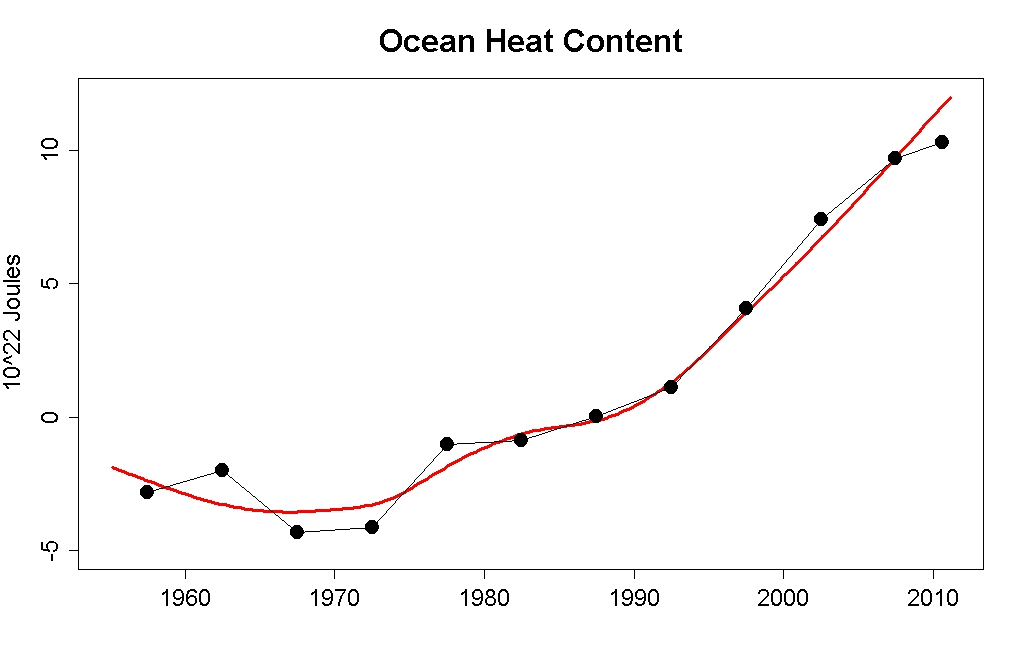 I chose to concentrate on data since 1985 to expand the detail. My smoothing technique is a standard 21 quarter moving average, aka boxcar average, with the moving average of each quarter plotted. The smooth plot terminates 10 quarters before the unsmoothed quarterly data, because that is the point where I would have to start making assumptions about future data in order to generate a smoothed datapoint.
I do believe that the OHC data does show a change in trend. This sort of change in trend has been seen before ... as can be seen in the source data at NODC.
I chose to concentrate on data since 1985 to expand the detail. My smoothing technique is a standard 21 quarter moving average, aka boxcar average, with the moving average of each quarter plotted. The smooth plot terminates 10 quarters before the unsmoothed quarterly data, because that is the point where I would have to start making assumptions about future data in order to generate a smoothed datapoint.
I do believe that the OHC data does show a change in trend. This sort of change in trend has been seen before ... as can be seen in the source data at NODC.
 Response:
[DB] Despite your impying it, the provenance of your first graphic is not Tamino's.
The whole point is the selective use of the outlier, 2003, as the start point.
The issues with this practice are detailed here.
Suggestions:
- Do the work with the bigger picture to give context
- Do the requisite significance testing
If after that you feel Tamino to be in error, then go to Open Mind and say so.
-
John Hartz at 03:23 AM on 20 May 2011Coral atolls and rising sea levels: That sinking feeling
@Dana, OK. Is the above announcing the posting of all three levels of rebuttals?Response:[dana1981] Yes
-
Stephen Baines at 03:17 AM on 20 May 2011Coral atolls and rising sea levels: That sinking feeling
Rob, when you say a Guyot is 1500 m "below the sea surface", I think you mean "above the seafloor." That would be pretty deep to be a drowned atoll. -
Albatross at 03:11 AM on 20 May 2011Carter Confusion #1: Anthropogenic Warming
Daniel @15, Thanks. A fair compromise IMHO. -
Albatross at 03:10 AM on 20 May 2011Carter Confusion #1: Anthropogenic Warming
CW, Dana was addressing was Carter's claim that no signature of AGW has been identified. I hope you at least can agree that for him to state that is utter BS? But your post @11 suggests otherwise, in fact you seem to be defending his misguided position. If you deny that at least one such signal/fingerprint has been identified, then you deny the theory of AGW, and that then does not make you a 'lukewarmer' (that is a fabricated position of convenience) . Do you agree with Carter's assertion that not signature or fingerprint of AGW has been identified? An unequivocal/unambiguous answer please. That is "Yes" or "No". Thanks. -
Charlie A at 03:04 AM on 20 May 2011Oceans are cooling
I think the way this discussion evolved and moved has left some misconceptions. My posts on the other thread were in response to others saying that Pielke Sr's choice of 2003 as the start point for comparison of observed OHC with radiative imbalance projections. When he started posting on this subject, back in 2007, he stated that he chose 2003 as the start point because that is when there were nearly complete global coverage. The data from Climate Prediction Center of NOAA supports that, or at least supports 2004 being the year of reasonably complete spatial coverage. Prior to that, the coverage was much spottier, both temporal and spatial. Trends can still be determined, but only over the longer periods needed to average out the sampling noise. On the other thread, some OHC plots by Tamino were cited as evidence that there has been no change in trend. My alternative plot was criticized as being a "cherry pick" and not looking at long enough of a period. (I'll post those plots in another comment). In the comment #65 just above, Tom Curtis says "As you seem to be suggesting the significant change in trend in the OHC of the upper 700 meters in 2003 as being an artifact of sampling," Tom, I think if you look around this site you will find that most do not accept that there has been a significant change in the trend. Tamino's graph says there is no change. Various contributors to this site say that 2003 onward is too short of a period to consider, and to even analyze a trend since 2003 is "cherry picking". So that the discussion can continue with common understanding, I'll make a series of statements below. Then we can discuss where we agree and disagree. 1. There is a change in trend in OHC in 2003. Maybe. The measurement accuracy and frequency of measurement is much better since 2003/2004 than before and it does appear that taking the OLS trendline over the last 7 or 8 years does provide a reasonable estimate of the average OHC gain over that period. It is dangerous to assume a trend change that occurs simultaneously with a change in measurement method is real, but there is now sufficient data to say that the observed trend since 2003/2004 is actual, rather than an artifact of the transition in measurement method. My plot with 21 quarter (63 month/5.25 year) smooth, I believe, is a reasonable presentation of the data. Note that I also include the 3 month unfiltered data for comparison. 2. The change in OHC trend, if any, is indicative of a long term change. Unlikely. While the long term OHC measurements have very high uncertainty, the average uncertainty over a long period, such as 1970-2000 gives a reasonable estimate of the long term trend over that period. Without evidence to the contrary, I assume that the long term trend will continue at more or less this same average rate. In this sense, Tamino's highly filtered plot is accurate. 3. OHC measurements in the "Argo era" (staring 2003 or 2004) are reasonably accurate estimates of the average global radiative imbalance when measured over periods as short as 1 year, and definitely an accurate estimate of the average radiative imbalance over the entire post 2004 period. I do agree with this statement. 4. OHC measurements over a 1 to 5 year period, when combined with estimates of ice melt are a suitable way to estimate the global radiative imbalance over that 1 to 5 year period. I do agree with this statement. This is an important assumption as it shows us a way toward more accurate estimates of the various forcings. This is the point where estimates of OHC in the abyss become important. The amount of heat going into the deep ocean is a matter of significant debate at this time. 5. The direct forcing from CO2 increases can be accurately estimated. I strongly agree. The uncertainty with this forcing is small. 6. The change in solar forcing can be accurately measured. Partial agreement. The delta is reasonably well measured, but with concerns about drifts and step changes between satellites. It is clear that that the absolute values of solar forcing are not well measured, since various satellites disagree by several watts/meter squared. 7. Aerosol forcings remain highly uncertain. Absolutely. There is a high variance in the aerosol forcings assumed, with various climate models using different assumptions. The uncertainty in aerosol forcings are significantly greater than the uncertainty of equivalent radiative forcings associated with Argo era OHC content measurements averaged over just a few years. 8. OHC measurements (of upper 700 meters) since 2003 (or 2004) indicate that the average global radiative is much smaller than previously assumed. I'm agnostic on this point. We have now have good measurement and tracking of upper ocean OHC. Estimates of OHC in the deep ocean widely vary, and in some cases appear to be driven by an attempt to close the energy budget. 9. OHC measurements can be used to diagnose the climate response to warming in regards to changes in albedo. Maybe. That's why the reason behind the slowing of OHC rise(or at least upper ocean OHC) since 2003 needs to be investigated and, if possible, the cause determined. =========================== yes, it's a long post, but hopefully it is organized such that specific points of agreement and disagreement can be directly addressed. -
Albatross at 02:53 AM on 20 May 2011Carter Confusion #1: Anthropogenic Warming
Dana @14, I agree and share your frustration. One could delete such Gish gallops, because they are of no scientific value really. I do not know what the solution is, but I sincerely hope that people following this thread take what CW states/claims as 'truth' with a grain of salt.Response:[DB] I implemented a compromise strategy.
-
Albatross at 02:49 AM on 20 May 2011Carter Confusion #1: Anthropogenic Warming
CW @11, Re the trends in the diurnal temperature range (DTR), you might want to read a paper by Zhou et al. (2010) [H/T to Eli Rabett]. They conclude that: "When anthropogenic and natural forcings are included, the models generally reproduce observed major features of the warming of Tmax and Tmin and the reduction of DTR. As expected the greenhouse gases enhanced surface downward longwave radiation (DLW) explains most of the warming of Tmax and Tmin while decreased surface downward shortwave radiation (DSW) due to increasing aerosols and water vapor contributes most to the decreases in DTR in the models. When only natural forcings are used, none of the observed trends are simulated. The simulated DTR decreases are much smaller than the observed (mainly due to the small simulated Tmin trend) but still outside the range of natural internal variability estimated from the models." Inconvenient findings for Carter. Then again, many factors affect the DTR other than GHGs, so I agree that it is perhaps not the best indicator of AGW. The changes in the annual cycle (winters warming faster than summers) is a robust fingerprint of AGW. And before you introduce Fall et al. (2011), their results bring the models projections into closer agreement with observations. -
dana1981 at 02:41 AM on 20 May 2011Carter Confusion #1: Anthropogenic Warming
CW's comments just make me shake my head. It's enough work to deal with the Gish Gallops of professional "skeptics". I don't have the time, energy, or patience to do so in the SkS comments too. Suffice it to say most of CW's arguments in #11 are excellent examples of cherrypicking. For example focusing on the stratosphere while ignoring the higher layers of the atmosphere, choosing convenient short-term data, dismissing inconvenient data for no apparent reason, etc. Not to mention misunderstanding or misreading the arguments (assuming he read them at all). For example, confusing sea level rise with sea level pressure (combined with making a false statement about sea level rise).
Prev 1697 1698 1699 1700 1701 1702 1703 1704 1705 1706 1707 1708 1709 1710 1711 1712 Next


