


 Arguments


Recent Comments
Prev 1705 1706 1707 1708 1709 1710 1711 1712 1713 1714 1715 1716 1717 1718 1719 1720 Next
Comments 85601 to 85650:
-
angusmac at 04:46 AM on 15 May 2011Lindzen Illusion #2: Lindzen vs. Hansen - the Sleek Veneer of the 1980s
KR@91, I have run some statistical checks (Dana not the eyecrometer) and I confirm that Dana's 3°C scenario gives good results. Almost as good as Scenario C. Therefore, I might use it for future temperature comparisons to save all the hassle about Scenario C not being "real". Dana@93. No I wasn't trying to, ""find a way in which Scenario C, which doesn't reflect reality, could reflect reality."" Scenario C already gives the right temperatures. I was actually trying to suggest an alternative method of getting Scenario B to reflect reality. I still haven't received your figures to show aerosols are taken in to account in Scenario B. Nevertheless, I have downloaded your spreadsheet (which doesn't show aerosols) from SkS Graphics Resource (this is a good resource and excellent FOI) and as I said to KR above your 3°C scenario gives good results. However, I make the following comments:- The sensitivity is actually 2.7°C because you have left the 0.9 x 3.0 factor in your calculations.
- You splice your 2.7°C sensitivity to the 4.2°C Scenario B. This is illogical but I assume that you did this because Gavin Schmidt (2007) at RC states that you should start analyses at 1984 to avoid a "cold start". However, I see no reference to the "cold start" in any of Hansen's papers. To the contrary, Hansen (1988) explains that 1959 was chosen as his best estimate of climate equilibrium. Nevertheless, using 1959 as a start date increases the temperature projections by approximately 2% and gives you a better fit with real-world temperatures.
Response:[dana1981] You're mistaken. The 0.9 is to account for the fact that the observed radiative forcing (which includes aerosols) is 10% lower than Scenario B.
-
Eric (skeptic) at 04:33 AM on 15 May 2011CO2 has a short residence time
drrocket, I'm not sure I determine the total uptake from my simple spreadsheet. I have the net flows for each year and that would give a Mean Residence Time of 1/(3400/814000) or 255 years. The 814000 is the reservoir for 2007 and 3400 is the net loss from the reservoir in 2007 based on my hypothetical exponential decay with lambda of 4.25 But I was able to fill the spreadsheet with more rows and turn off the ACO2 starting in 2008. At that point the "extra" CO2 in the reservoir decays from 814000 to 708000 in 58 years. However, this is likely a high estimate because my lambda is constant in my spreadsheet from 1750 to present and in reality lambda increases as the reservoir increases. Englebeen thinks the half life is about 40 years. I posted my spreadsheet on my (brand new) online iwork account if anyone wants to look at it. It should be publicly accessible here: http://public.iwork.com/document/?a=p1415598010&d=CO2growth.numbersModerator Response: [Dikran Marsupial] For the calculation of the residence time, it is the mass of the reservoir divided by the total flux out of the reservoir, rather than the net flux. You should get an answer of about four years. The use of the net flux gives you something more like the adjustment time, although that can't be calculated meaningfully without doing a differential equation or two. -
JMurphy at 04:29 AM on 15 May 2011What scientists are saying about Skeptical Science
I can understand the snipping of garyhemminger's comment (because it was a farce - as is what has been left), but it did provide a great example of the type of so-called skeptic (or, rather, someone deep in denial) who will trot out his beliefs whenever or wherever he can, while ignoring reality and facts. Quite sad, in a way. -
chris at 04:28 AM on 15 May 2011Lindzen Illusion #5: Internal Variability
Ken Lambert at 00:17 AM on 15 May, 2011 Don't really understand your point about Willis, KL! His work is abundantly described in Hansen's paper, and his Lyman et al (2010) analysis forms the basis of Hansens 1993-2008 OHC estimate of radiative imbalance. Willis's data is shown in two of the Figures and 5 of Willis' papers are cited. I hope you're not suggesting that since Hansen doesn't mention Willis by name (much), Willis's contribution is being downplayed. That's just silly, and seems a trifle obsessive! After all Willis contributed to the analysis of the Lyman et al data (as you can see by reading the author conttribution in the paper in Nature). So Willis clearly endorses that data. You should realize that in papers a scientists work is pretty much always discussed without mentioning the author by name (other than perhaps "Blogs et al determined that"...or "this is consistent with recent independent analyses (e.g. Blogs et al (2007)). I have to admit to doing a partly vanity inspection of the Web of Science update that appears on a Saturday morning to see who might have cited my own work - this morning a paper in a very similar research are to mine cited 6 of my papers. My name wasn't mention once in the text. Why should it have been? I'm not going to plough through your points since they really seem an attempt to over-fixate on uncertainties within sub-levels of the thermodynamic analysis of Earth's energy budget. A fascinating and important subject - when/if the uncertainties are resolved we'll have a much better handle on the Earth response to enhanced greenhouse gas levels, both in terms of nett equilibrium response and time evolution. For now, I'm comfortable with the evidence from Willis's analysis that the 1993-2008 ocean heat uptake is consistent with a radiative of around 0.65 W/m2. A tumble of recent papers on deep ocean heat uptake that I believe was not considered in the Lyman et al analysis (you'll tell me if I'm wrong I hope) suggest perhaps another 0.1 W/m2 "worth" has gone there. There's clearly been a bit of a slow-down in heat uptake in the last few years. Hansen's paper that you are enjoying suggests the radiative imbalance is around 0.75 W/m2 averaged over the solar cycle for this period. That also seems to be a supportable analysis. Note that Hansen hasn’t referred to any more recent work by Willis since Willis hasn’t published this (not in print yet or even in press apparently). Dr. Willis was rather “burned” by an earlier episode arising from artifacts in ARGO data. I expect when he’s confident in any new publishable data he’ll publish this and no doubt Dr. Hansen will subsequently cite it and then everyone will be happy! Note, btw that Dr. Willis is very clear that he considers that full understanding of the Earth energy budget will require further information on deep ocean heat content. He says so here. I don’t think anyone would disagree with that. No? -
Riccardo at 04:27 AM on 15 May 2011Lindzen Illusion #1: We Should Have Seen More Warming
RW1 when you have a periodic forcing the amplitude of the response depends on the amplitude of the forcing (of course) and on the ratio of the period of the forcing and the response time of the system. You can do the calculations, they're pretty standard. "This much change could not occur over this short a period of time if all or most of the whole mass of the ocean had to warm or cool by this much." Indeed. The mixed layer depth is around 100 m. This is the relevant heat capacity which contribute to the response time. Beware that by changing the time scale you also change heat capacity and response time. "with most of the response occurring in the first year." A totally unsupported claim. -
KR at 04:23 AM on 15 May 2011Lindzen Illusion #1: We Should Have Seen More Warming
RW1 - Seasonal variations don't penetrate deeply into the oceans, and they don't completely melt the Antarctica or Greenland ice caps, either. Only the upper 100 meters or so of ocean (the "well mixed" region where wind/wave turbulence has an effect) shows any significant response to seasonal variations. On the other hand, the average depth of the oceans is about 3800 meters. The ice caps contain well over 35*10^6 km^3 of ice (depending on who's doing the averaging). Those thermal masses are what will be affected over time by a change in the average temperature, as they respond much slower than the seasons do. Various people have looked at this, and the 40 year response for short term climate change is well established. Your "seasonal response" argument is ill-founded, and quite frankly I find it more than a little disingenuous. -
RW1 at 04:15 AM on 15 May 2011Lindzen Illusion #1: We Should Have Seen More Warming
Furthermore, what is the average sea surface temperature in the tropics? Since the tropics are roughly equivalent to perennial summer, this should give us an general idea of how much more change above 5 C is needed to occur at equilibrium. From this, we should be able estimate about how much longer it would take beyond 6 months. -
RW1 at 04:06 AM on 15 May 2011Lindzen Illusion #1: We Should Have Seen More Warming
Riccardo (RE: 107), "RW1 "delay" doesn't mean that nothing happen in the meanwhile." I never claimed or meant to imply that it doesn't. The point is an extremely large amount of temperature change occurs in each hemisphere in a very short period of time. "The seasonal forcing is huge in comparison and the diurnal forcing is even larger. Still we see part of the effect. Should we be locked into a perennial winter or night it would be worse." Of course, but how about a quantification showing it would take 40 years of a perennial winter or summer to reach equilibrium. There is roughly 5 C of change in average sea surface temperature occurring in each hemisphere every 6 months. This much change could not occur over this short a period of time if all or most of the whole mass of the ocean had to warm or cool by this much. As a result, it's doubtful the equilibrium response time to changes in forcing is much more than only few years with most of the response occurring in the first year. -
chris at 04:01 AM on 15 May 2011Lindzen Illusion #7: The Anti-Galileo
ClimateWatcher at 02:38 AM on 15 May, 2011 (and Camburn at 12:29 PM on 14 May, 2011) (and multiple posts by Ken Lambert) Your post contains an essential illogic CW, and illustrates a rather tremulous approach to scientific knowledge if I may say so. Scientists are generally brave chaps and lasses since they are willing to embrace uncertainty honestly. Science delves from certainty into uncertainty as it advances. Scientific investigation into sub levels of areas that are reasonably well established, identifies interesting realms of uncertainty (this is where scientists love to play, since novel discoveries are made in these realms). However novel uncertainties in sub-levels of a discipline don't drive out areas of certainties above them. Scientists rather bravely roll up their sleeves and get stuck into novel uncertainties; it takes a certain style of armchair cynicism to sit on the sideline, wait for these sub-levels of uncertainty to pop-up.....and then attempt the pretence that these sub-level uncertainties negate our essential knowledge. Camburn's example (see 12:29 PM on 14 May, 2011) We know with rather high certainty that increased tropospheric temperatures result in enhanced water vapour concentrations. This provides a positive feedback to warming from enhanced radiative forcing. A large body of careful research has established that empirical observation (one that Lindzen was at pains to negate at a time when this was an area of high uncertainty, empirically-speaking). We can now think about sub-levels of this water vapour feedback. How strong is it? Camburn points out that some studies support the conclusion that water vapour concentrations increase to maintain roughly constant relative humidity (RH), whereas one study he's found indicates that RH might decrease somewhat in a warming atmosphere. However, that's relative humidity. All of the data are in agreement that the specific humidity (SH) increases (more or less as models predict). the uncertainty about the precise nature of the water vapour response in a warming world, doesn't negate the higher certainty that the water vapour concentrations do increase as the upper troposphere warms. ClimateWatcher's example (02:38 AM on 15 May, 2011) A similar approach. We have known for over a century that CO2 is the dominant independentally-variable greenhouse gas, and there is a very large body of evidence that the earth surface responds to enhanced [CO2] with a temperature rise between around 1.4-4.5 oC at equilibrium per doubling of [CO2]. Attribution of the contributions to 20th century global warming rather strongly supports the likelihood that the climate sensitivity is at least 2 oC per doubling. Monitoring of sea level rise and ocean heat content, together with measurement of surface temperature, and the increase of atmospheric temperature and water vapour, along with other evidence, indicates with very little room for doubt that the Earth is currently in radiative imbalanace (absorbing around 0.75 Wm-2 excess solar energy averaged over the solar cycle, as Ken Lambert has informed us elsewhere in reference to a recent summary by Hansen). Scientists have rolled up their sleeves and entered the hugely difficult area of attempting to account for the components of the energy balance; they've attempted to apportion sea level rise into its mass and thermal components; to measure incoming and outgoing energy at the TOA; to measure the enhancement of thermal energy in the surface and deep oceans.... There is lots of uncertainty in these sub-disciplines of climate thermodynamics. But this uncertainty does not negate the higher level certainty about the nature of the radiative imbalance, its source and its likely consequences ClimateWatcher comments on these sub-level uncertainties and concludes the stunning non-sequiter that since "....we dont know the albedo precisely...", and "...don't know the budget....", that we don't know whether "....global warming is a huge problem..." or whether "...climate is completely INsensitive to changes in CO2..." -
DSL at 03:46 AM on 15 May 2011What scientists are saying about Skeptical Science
Gary, is that some sort of argument? Could you point out where "all the predictions of the AGW proponents are being shown to be incorrect?" And you might want to post your evidence and argument to the appropriate threads (see the left menu). -
garyhemminger at 03:40 AM on 15 May 2011What scientists are saying about Skeptical Science
I really don't see the difference between you or Malthus. You will both be proved wrong. all of the predictions of the AGW proponents are being shown to be incorrect. Your cause is doomed. ( -Snip- )Moderator Response: (DB) Inflammatory snipped. -
dhogaza at 03:17 AM on 15 May 2011Lindzen Illusion #7: The Anti-Galileo
Also ... "the NOAA satellites are 'Polar Orbiters'" They don't actually pass directly over the poles, just near them. -
dhogaza at 03:14 AM on 15 May 2011Lindzen Illusion #7: The Anti-Galileo
"MSU data does cover the poles ( the NOAA satellites are 'Polar Orbiters' ). The RSS analysis does exclude Antarctica because of its high elevation, but the MSU data provides superior global coverage to surface or sea surface measurements." RSS cuts off at 82.5 degrees north and south, and it's not because of the altitude of Antarctica. From the RSS site itself, which I trust to be more accurate than CW's misrepresentation: "We do not provide monthly means poleward of 82.5 degrees due to difficulties in merging measurements in these regions, and because these regions are not sampled by all central fields of view." UAH attempts to extend their reconstruction further north and south but not to the poles. I'm too lazy to look up their exact cutoff latitude. "Further, the GISS data does not differ because of number of stations included but rather the huge smoothing radius that GISS employs ( 1200 kilometers ). This allows GISS to induce data where none actually exists ( polar regions and Africa )." Teleconnections are real ... the analysis done by the Anthony Watts et al paper that was just published depends on the reality of this, too ... -
dhogaza at 03:07 AM on 15 May 2011Lindzen Illusion #7: The Anti-Galileo
"Since we don't know the budget, we can't know sensitivity to changes. That could mean that 'global warming' is a huge problem that has somehow been masked. Or it could mean that climate is completely INsensitive to changes in CO2 ( at least in the range experienced so far )." No, it does not mean that sensitivity is *unbounded*. And, what masking are you talking about? It's been pointed out numerous times that temperature trends are following model ensemble predictions, within the error bounds given for them. "Trenberth knows this. Hansen knows this." They'd both say you're lying about what they know. -
WheelsOC at 03:04 AM on 15 May 2011Who Ya Gonna Call???
kdkd, seriously, theories don't become laws. They stay theories, which makes them extremely powerful and useful since they seek to tell you what's going on. Laws only state a relationship, theories explain how the relationship works. Newton's Law of Universal Gravitation was not a theory. Einstein's General Relativity is a theory; it will never be a law, no matter how well-vetted (and it's being tested and confirmed constantly, even into last week). -
ClimateWatcher at 02:54 AM on 15 May 2011Lindzen Illusion #7: The Anti-Galileo
89. Marcus: CW. You are aware that the Satellite Data (RSS & UAH) doesn't cover the poles, which have been shown to be warming much faster than the rest of the planet. HadCru also suffers from a lack of coverage. GISS is actually the most accurate because it relies on the greatest number of weather stations covering the greatest portion of the globe. MSU data does cover the poles ( the NOAA satellites are 'Polar Orbiters' ). The RSS analysis does exclude Antarctica because of its high elevation, but the MSU data provides superior global coverage to surface or sea surface measurements. Further, the GISS data does not differ because of number of stations included but rather the huge smoothing radius that GISS employs ( 1200 kilometers ). This allows GISS to induce data where none actually exists ( polar regions and Africa ). The GISS indicates a higher trend than CRU because of this. In the early twentieth century warming, GISS indicated a lower trend than CRU. By assuming data where none exists, GISS is more variable than CRU, That is why comparing data sets Surface versus Sea Surface versus MSU lower versus MSU middle gives us more confidence. Among these data sets, GISS is the highest, UAH middle is the lowest. Throwing both of these data sets out and averaging the remainder is probably a reasonable measure of temperature trend. -
Riccardo at 02:50 AM on 15 May 2011Lindzen Illusion #1: We Should Have Seen More Warming
RW1 "delay" doesn't mean that nothing happen in the meanwhile. The seasonal forcing is huge in comparison and the diurnal forcing is even larger. Still we see part of the effect. Should we be locked into a perennial winter or night it would be worse. -
ClimateWatcher at 02:38 AM on 15 May 2011Lindzen Illusion #7: The Anti-Galileo
85. Ken Trenberth 97 Trenberth 2009 NOAA satellite measurements of OLR And you can plot GISS values for the various models on the GISS site for modeled albedo and OLR. Since we don't know the budget, we can't know sensitivity to changes. That could mean that 'global warming' is a huge problem that has somehow been masked. Or it could mean that climate is completely INsensitive to changes in CO2 ( at least in the range experienced so far ). Trenberth knows this. Hansen knows this. You may have read his recent paper in which, despite claiming to know the budget, he dedicates discussion to the albedo problem ( reflection has varying angles which can't be captured by single satellite vantage. ) We may not know albedo precisely enough for a century. So anyone saying global warming is a huge problem or not a problem at all is not doing so on the basis of knowledge of the energy budget, because we don't know the energy budget. -
RW1 at 02:35 AM on 15 May 2011Lindzen Illusion #1: We Should Have Seen More Warming
DB, My question is not answered there. How do you explain seasonal change with a 40 year delay?Response:[DB] In addition to Riccardo's comment, seasonal variation is a consequence of the Earth's tilt, relative to it's plane of orbit around the sun, and intense heating of the sea surface in the regions at the equator. See illustration below:
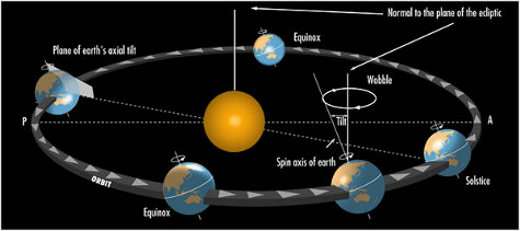
Earth's tilt relative to it's plane of orbit around the sun. Left-hand side=southern hemsiphere (austral) summer. Right-hand side= northern hemisphere (boreal) summer. Image courtesy of the Austalian Bureau of Meteorology
Thanks, Rob P!
-
Dikran Marsupial at 02:32 AM on 15 May 2011CO2 has a short residence time
drrocket, let's try going through this line by line. Forgetting for a moment about the mechanisms by whcih it takes place, would you agree that there is conservation of matter in the carbon cycle? i.e. dC = E_a + E_n - U_n i.e. the annual rise in atmospheric CO2 is the difference between total emissions (anthropogenic and natural) and total uptake (assuming for simplicity that anthropogenic uptake is effectively zero - we are not achieving significant carbon sequestration at the current time). I would hope you do agree with this, as it is basically just saying that any CO2 (from any source) that is not taken up by the oceans/terrestrial biosphere remains in the atmosphere, which seems completely uncontraversial as far as I can see! -
RW1 at 02:28 AM on 15 May 2011Lindzen Illusion #1: We Should Have Seen More Warming
Can anyone quantify specifically how the amount of seasonal change the occurs in ocean water temperature corresponds to a 40 year delay between forcing and final response? No one, including Lindzen, disputes there is a delay, but it certainly can't be anywhere near 40 years. If it were, seasonal variability would not even occur. Heck, there would barely even be any difference between night and day with a decades long response time.Response:[DB] See here: The-40-Year-Delay-Between-Cause-and-Effect
-
Glenn Tamblyn at 02:14 AM on 15 May 2011Infographic: 97 out of 100 climate experts think humans are causing global warming
Harry Seaward #158 If you haven't already followed Sphaerica #153 to Spencer Wearts history run don't walk to read it. All the major theory and observational history is there. And most of the imprtant names - Arhenius, Hulbert, Callender, Plass, Revell Suess, Bolin. In may ways all the key discoveries and understandings of AGW were in place by the mid 60's. What followed was refinement of the understanding and people starting to get their heads around the idea that this was real and serious. Also this article by Ray Pierrehumbert in Physics Today covers a lot of the radiative physics side really really well. http://geosci.uchicago.edu/~rtp1/papers/PhysTodayRT2011.pdf Particularly read the section related to figure 3 - the exquisite agreement between theory and observation wrt to the Earths outgoing IR spectrum. The two spikes highlighted are modelled so well because the stratosphere warms as you go higher and this effect is captured by the theory, but only at the frequencies with the highest CO2 absorption. A thing of beauty!Response:[DB] Hot-linked URL.
-
dhogaza at 02:13 AM on 15 May 2011Who Ya Gonna Call???
No, please leave #11 - Ken doesn't understand that greater cooling due to aerosols pushes climate sensitivity to increasing CO2 in a direction opposite to that he wants ... -
Dikran Marsupial at 02:09 AM on 15 May 2011CO2 has a short residence time
drrocket@64 You have a bad case of Dunning-Kruger, there are aspects of the carbon cycle you are ingorant of, and your ego is getting in the way of you correcting this failing (calling an argument you don't understand 'gobbledygook' is a classic example of D-K in action). "Natural emissions are exactly balanced by natural uptake, as modeled (incorrectly) by IPCC." No, the models of the carbon cycle used by the IPCC do not have natural emissions exactly balanced by natural updake. If they did, the airborne fraction for their model would be 100% instead of 45%. "It's incorrect because natural emissions follow sea surface temperature, keeping the atmosphere perpetually out of balance as it responds to the long term waxing and waning of the Sun" One of the things you appear to be ignorant of is that the ocean uptake is also governed by the difference in partial pressure of CO2 between the atmosphere and the surface waters. This means that if atmospheric CO2 rises, the oceanic uptake increases. The increase in uptake due to increasing atmospheric CO2 exceeds the increase in emissions due to the modest rise in temperature, which is why the oceans are a net sink. This is carbon cycle 101 stuff. "(1) The fact that it is in balance, i.e., that E_n = U_n does not make the residence time either short or long. " It is not a fact that E_n = U_n, and I did not say it makes the residence time short or long. The residence time does not depend on E_n only on U_n. It is the adjustment time that depends on the difference between E_n and U_n. "(2) What does determine the residence time is [CO2_air]/(U_n + U_a). It is the ratio of the concentration in the reservoir to the uptake rate. " Yes, you know that, I know that and the IPCC knows that. However, where the you (and Essenhigh) differ from the IPCC and I is that we know that residence time is irrelevant to the discussion of the increase in atmospheric CO2, and it is tha adjustment time that matters. " The residence time of each type of gas has a huge, proportional effect on its atmospheric concentration." No, it doesn't as the residence time is dominated by an exchange of carbon between the atmosphere and oceans/biosphere that has no effect whatsoever on the atmospheric concentration. Right, if you are still reading at this point, here is a variation on the challenge. Explain how the natural environment can be a net source of CO2 into the atmosphere while the observed annual rise in atmospheric CO2 is less that anthropogenic emissions. If you can't answer that question, your position is untenable. -
Albatross at 01:58 AM on 15 May 2011Who Ya Gonna Call???
Re "collected a huge climate science research grant." Come one. Can we delete #11 please..... -
Riccardo at 01:56 AM on 15 May 2011Who Ya Gonna Call???
In common language "it's just a theory" is used to indicate something unproven, an hypothesis. In science "theory" has different meaning. And yes, gravity is only a theory, like "Intelligent falling". -
caerbannog at 01:48 AM on 15 May 2011How people are using the Scientific Guide to Global Warming Skepticism
ScaredAmeoba@4 The Tripati paper is quite credible but should be treated as preliminary at this time. The "at least 2 million years" line is probably overly conservative, but it's an appropriate figure to use until there is independent confirmation of the Tripati results... Skepticalscience is kind of like the IPCC -- it's a conservative alarmist organization that tends to understate the evidence out of an abundance of scientific prudence. And that's what makes these alarmists so dangerous. They very cleverly understate their cases so that skeptics will have nothing to attack -- it's all part of a very clever plan to smear the skeptics. -
WSteven at 00:42 AM on 15 May 2011Who Ya Gonna Call???
@RickG #10 I try to drill this into kids' heads all the time. Hopefully some of it sticks before they leave high-school. -
Ken Lambert at 00:17 AM on 15 May 2011Lindzen Illusion #5: Internal Variability
Chris #83 If this were a trivia night, you would win a point. Willis is mentioned once in the text on page 28 of this 52 page paper - Willis et al 2007 re Argo ie: "Even this well-planned program had early instrumental problems causing data biases (Willis et al., 2007), but it was possible to identify and eliminate problematic data." Willis is a co-author with Lyman and he is indirectly mentioned in the 5 pages of references at the end of the paper. I said a 'couple' - so you have 2 points. There is no mention of any of Dr Willis' recent 'prelim' OHC analysis and quoted by Dr Pielke. You know Chris, I have been raving on about +0.9W/sq.m net forcings from Dr Trenberth's Aug09 paper based on Hansen's 2005 estimate etc - for a long time. In the 'missing heat' discussions, Climategate - the predication of the AGW position is that 'its there but we can't measure it adequately'. We know its about 0.9W/sq.m but we can only measure about 0.5-0.6W/sq.m is a theme of Dr Trenberth's papers. This very long paper by Hansen is a game changer. He accepts that von Schukmann's measurement of the global energy imbalance is about 0.5W/sq.m, holds fast to the theoretical CO2 GHG forcing, and then proceeds to explain the reduced positive balance - chiefly by picking Aerosols as the main culprit. He argues that aerosols have a forcing of -1.6W/sq.m (negative), when prior models used around -0.4-1.1W/sq.m. Quote (pp45): "We also must quantify the causes of changes of Earth's energy imbalance. The two dominant causes are changes of greenhouse gases, which are measured very precisely, and changes of atmospheric aerosols. It is remarkable and untenable that the second largest forcing that drives global climate change remains unmeasured. We refer to the direct and indirect effects of human-made aerosols. We have inferred indirectly, from the planet's energy imbalance and global temperature change, that aerosols are probably causing a forcing of about ‒1.6 W/m2 in 2010. Our estimated uncertainty, necessarily partly subjective, is ± 0.3 W/m2, thus a range of aerosol forcing from ‒1.3 to ‒1.9 W/m2." endquote Well, I should have applied for a job with Prof Hansen, because I have been banging away with a similar argument for some time - highlighting the wide error bars on the IPCC AR4 estimate of Aerosol forcing and also the unknown amounts being added by rapid industrialization by developing countries. There are several other bafflements in this paper (eg. the flatline von Schukmann OHC figure 2005-10) - but the jaw dropper for me is that Hansen has killed the 'missing heat' hypothesis and accepted that the OHC measurement **is** the imbalance and fitted the known unknown forcings to that observation. If Dr Willis OHC analysis turns out to be 0.25W/sq.m and overrides von Schukmann - then another revision down of the warming imbalance will be necessary - and more bafflements could follow. -
Ken Lambert at 23:42 PM on 14 May 2011Lindzen Illusion #5: Internal Variability
Sphaerica #80 #81 The resolution is poor, but if you look at Fig 22(f) of Hansen's paper, the Pinitubo (1991) 'rebound' forcing could does not scale to than +0.1-0.2W/sq.m, and it has all dissipated by 2000. Prior to that has negligible effect to the net energy uptake of the planet, because the net area under the spike and rebound roughly cancel out. To add a negligible 'decline' in the already exhausted 'Pinitubo rebound effect' to the Solar minimum for the decade 2000-2010 is just a furphy. There are several other more important things in this paper which I shal; touch on in my response to Chris #83 -
Ken Lambert at 23:19 PM on 14 May 2011Who Ya Gonna Call???
kdkd #9 If you have not already seen this latest Hansen paper, check it out here: http://arxiv.org/ftp/arxiv/papers/1105/1105.1140.pdf ( -Snip- ).Response:[DB] Off-topic ideological inflammatory snipped.
-
drrocket at 23:19 PM on 14 May 2011CO2 has a short residence time
KR, 5/14/11, 14:50 PM [sic], CO2 residence In the quotation you attribute to me, you dropped the source, falsely making the quotation appear to be my words. Or, did you not realize that you were criticizing a quotation from IPCC? Then in your last ¶, you reinforce the misimpression. You should have written, It's just that the sinks don't match up to the sources,drrocketIPCC. Otherwise, we are in substantial agreement – so far.Moderator Response: [Dikran Marsupial] You appear to have misread KRs post, AFAICS he was not attributing anything to you, but directing the statement to you. -
RickG at 22:28 PM on 14 May 2011Who Ya Gonna Call???
kdkd, Many people misunderstand what a scientific theory or scientific law is. Laws "describe". Theories "explain". A theory never becomes a law nor are there any proofs in science. -
kdkd at 22:27 PM on 14 May 2011Who Ya Gonna Call???
Ken. Nice spot on the typo. It's a good job I'm not an electrician ;) -
kdkd at 22:27 PM on 14 May 2011Who Ya Gonna Call???
Kevin, I'm familiar with popper, kuhn and feyarbrand, however I have only read kuhn's book from cover to cover. Feyarbrand gets me in trouble relatively often, both with my wife, and my job. But he's also useful :) The point is that if a scientific theory is proven, it's only proven in the sense that a mathematical proposition can be proven. Once you move outside the scope of the propositions, the proof is no longer valid. So really a scientific law is a proposition where there is a strong belief that the premises are valid. However this means that the scope of scientific laws are always extremely valid. For the vast majority of scientific questions, proof, and therefore scientific laws are unattainable as there are too many parameters involved to be able to develop a proposition which is tractable for proof. So yeah, I agree with you. -
Ken Lambert at 22:18 PM on 14 May 2011Who Ya Gonna Call???
Hello kdkd, (i.e. in the case of the law of gravity to weak gravitational fields, ohms law to constant currants). I was a bit of a fan of Sunbeam's law of self-raisins, which of course was falsified by John Cook's observation of the transit of the Venal. -
Kevin C at 22:02 PM on 14 May 2011Who Ya Gonna Call???
kdkd: I think you might want to read some philosophy of science. Start with Popper, father of the scientific method as we now understand it: Karl Popper then go back to Bacon and forward to Kuhn and possibly Feyerabend. The idea that gravity is 'proven', or indeed that any theory can ever be proven is the problem here. The best we can do is repeatedly fail to falsify a theory. A theory which has withstood many severe tests (test which would be likely to falsify it) is considered to be a strong theory, but can still not be said to be proven. Gravity is no exception. Part of the problem is that scientists suffer all the same cognitive biases as normal people. Training and discipline in application of the scientific method help, but are not sufficient. As a result, there have evolved a set of social structures around science (the scientific institutions and journals, peer review, and consensus) which also tend to counteract the problem of the cognitive bias of the individual investigator. (I tend to refer to the social structures and conventions as 'how science is done', to distinguish them from 'the scientific method'. Consensus and peer review are a case in point, and highly relevant to the current discussion. Scientists tend to think highly of their own intelligence, and indeed we get in the habit of thinking we are smarter than other people. So our natural inclination presented with the work of others is to find holes in it to show our own cleverness. This is good, because it helps to weed out the errors which are present in every piece of work due to the cognitive biases of the investigator. But it also means that if, in a field in which there are a reasonable number of testable hypotheses, some sort of consensus is reached, then there can be a fair degree of confidence in that consensus. The comparison to gravity is thus, in scientific terms, completely valid. The real difference between gravity and AGW is that AGW is not 'self-evident' to the man in the street, because the man in the street has not examined the data systematically. We can envisage events which might change that, for example in the case of an early loss of the arctic ice cap.Moderator Response: Just a nit: Popper is not really the father of the scientific method as we know it. He had the best public relations campaign, though, and so is the best known. One good summary is by Martin Gardner. -
kdkd at 21:09 PM on 14 May 2011Who Ya Gonna Call???
Now, here's the right forum where I can get this off my chest :) Gravity is a law, not a theory. Although when it was originally proposed, Newton'proposition was a theory. However, it has subsequently been proven, so while it started life as the theory of gravity, now it's the law of universal gravitation. The reason that has been proven, is because it can be postulated as a set of propositions (parameters), for which the final proposition (conclusion) is self evident. Of course if the propositions that describe a law are found to be invalid, the law is then shown to be false, or that the law is only applicable to a specific situation (i.e. in the case of the law of gravity to weak gravitational fields, ohms law to constant currants). For that reason, scientific laws only tend to apply to very specific situations that probably won't arise in the real world. Gausses' law of competitive exclusion is a classic example of this, and about the only scientific law in the whole science of biology. *phew* I'm glad I offloaded that I feel so much better now. -
trunkmonkey at 20:25 PM on 14 May 2011Models are unreliable
scaddenp 373. Thanks for the Wally link. That is a very impressive paper. The models get the jist of the YD but they don't relicate it's full amplitude. From what little progress I have made in the decade of study you guys have prescribed I've gleaned that models have their own logic when they find a stable sweet spot. You guys know better than anyone that when you do certain things the model gets crazy and runs out of bounds like a kid who's eaten too much candy. So we have this happy model that refuses to reproduce the amplitude of YD by adding a reasonable amount of meltwater. Models have a good track record in these situations. So either the proxy data are wrong, there is anther stable point the model should be initialized at, or another unknown factor is contributing. I still do not understand exactly how CO2 works in the models. I played with the edgcm model but all it will let me do is imput a ppm for CO2. In the idealized model in my mind I would be able to right click on CO2 an pull up its properties. A screen would pop up showing all the relationships for CO2 and the values applied to these relationships. For example the absorbtion of outgoing IR would show a relationship to air temperature at 6 w/m^2 or so and there would be diminishing relationships to soil, ocean and plant sequestration, an exaggerating relation to temperature as it feeds back to increased microbial activity, etc. My suggestion on the control knob is to back off these values to bare bones. Can YD be too fast for CO2 if sucking 380 ppm of it out of the atmosphere today would drop GAT 6 degrees in a year? -
chris at 19:27 PM on 14 May 2011How people are using the Scientific Guide to Global Warming Skepticism
haven't yet congratulated you John on a really dogged effort over the years to rachet up the scope of your contribution to the promotion of clear thinking on climate sience. Truly from little acorns...! -
ScaredAmoeba at 18:04 PM on 14 May 2011How people are using the Scientific Guide to Global Warming Skepticism
John, Thanks for all your hard work and for the scientists who collaborated with the project. However, when I was reading it, I spotted on page number 6:...levels unseen for at last 2 million years[14].
when I looked at the endnote it was a reference to Tripati (2009). I had remembered a figure of 15 million years. Since I don't have a copy, I checked SKS to see whether my memory was playing-up. When I looked at http://www.skepticalscience.com/Hockey-stick-or-hockey-league.html.... a level unseen for at least 15 million years (Tripati 2009).
I believe that something seems to have gone wrong. -
Rob Painting at 17:54 PM on 14 May 2011Who Ya Gonna Call???
I've watched that clip a few times, still difficult not to laugh. Good to see more climate scientists stepping up to the plate. -
Marcus at 17:05 PM on 14 May 2011Lindzen Illusion #7: The Anti-Galileo
CW. You are aware that the Satellite Data (RSS & UAH) doesn't cover the poles, which have been shown to be warming much faster than the rest of the planet. HadCru also suffers from a lack of coverage. GISS is actually the most accurate because it relies on the greatest number of weather stations covering the greatest portion of the globe. -
Marcus at 16:50 PM on 14 May 2011Who Ya Gonna Call???
Its funny how if a Climate Scientist claims the planet is warming, people like Cloa513 tell us that they've been "bought" by some vested interest, rather than telling us the truth. Yet when the likes of Lindzen, Christy, Plimer et al tell us that Global Warming isn't happening, then people like Cloa513 just accept it without any doubt whatsoever, & certainly without daring to question the motives of said group. There's a word for that-*selective* skepticism. -
Bern at 16:40 PM on 14 May 2011Who Ya Gonna Call???
cloa513: thank you for providing a case in point for why we need to listen to actual climate scientists on climate issues... :-) Seriously, if my car is broken (even a ridiculously expensive one!) I'm taking it to a mechanic, and not even thinking about calling a politician, or a talk-back radio host, or a geologist. And while some mechanics may specialise in, say, tuning of fuel injection systems, that doesn't mean they have no idea what a muffler is. They've probably got a much better idea how everything in the car works than you or I do... And, yes, there are good mechanics & there are some bad mechanics. Fortunately, unlike mechanics, there's an easy way to tell who's a good climate scientist - their peer-reviewed work is cited frequently. How many mechanics can you assess by looking at whether other mechanics think they've done a good job? -
cloa513 at 16:22 PM on 14 May 2011Who Ya Gonna Call???
Is this Rediculous Week? Taking your comparison of a calling a mechanic. So you'd call any mechanic to work all parts of your extremely expensive car say the price of the Space Shuttle even he has never fixed a whole one before. He has a vague idea of some of the systems or a general idea of the whole thing. He makes predictions such it will burst into flames which are proved wrong. The long term world weather system or thermohydrodynamic system is not a climate (it is hot/cold/wet/dry at the same time all year round no climate is that at once) so your not expert in that. Noone is an expert in that.Response:[DB] Weather is not climate. Conflating "A" mechanic in general into one capable of fixing an expensive Italian sports car is simply wrong and at the same time a wondrous example of "skeptic's" skepticism. And in the pole position here no less.
-
alan_marshall at 15:52 PM on 14 May 2011How people are using the Scientific Guide to Global Warming Skepticism
John, It is just awesome what you have achieved in the last year. -
Stevo at 15:15 PM on 14 May 2011How people are using the Scientific Guide to Global Warming Skepticism
This is the only resource I've so far found which neatly encapsulates the case for AGW. It is a great guide to the big picture and cites plenty of sources so that one can make investigations in further depth and detail. I won't travel without a copy of it now. -
Bob Lacatena at 14:50 PM on 14 May 2011CO2 has a short residence time
drocket, I don't understand why you can't get this. It's simple. You are confusing yourself. I also don't understand why [ - snip - ] have to debate every single niggling detail of climate science, as if climate scientists can't get the slightest thing right, and it's amazing that they even find their way to work every morning. I mean, debate climate sensitivity or cloud feedbacks or something. Debating this is beneath everyone here. Really, something like this should not be this hard. Go study some and stop wasting everybody's time with utter and complete nonsense. Hint #1: Study basic chemistry, diffusion, and rates of reaction, and then come back. Hint #2: Sometimes an ability to put things into numbers and equations translates into an inability to grasp the basic, underlying concepts. -
Tenney Naumer at 14:49 PM on 14 May 2011How people are using the Scientific Guide to Global Warming Skepticism
This is a wonderful work, John! Kuddos to you!
Prev 1705 1706 1707 1708 1709 1710 1711 1712 1713 1714 1715 1716 1717 1718 1719 1720 Next


