


 Arguments


Recent Comments
Prev 1729 1730 1731 1732 1733 1734 1735 1736 1737 1738 1739 1740 1741 1742 1743 1744 Next
Comments 86801 to 86850:
-
Berényi Péter at 09:51 AM on 2 May 2011CO2 effect is saturated
#162 KR at 07:06 AM on 2 May, 2011 But, quite frankly, we have plenty of data on relative and absolute humidity from other sources over the last 50-70 years Really? Other than balloon radiosonde data? Because on face value those show decreasing specific humidity above the 700 hPa level (between 1973 and 2007). If you have other data, please show us. The conclusion from all these papers? That CO2 is not saturated, and that the last quarter century of satellite data shows increasing effects at the GHG frequencies expected from GHG concentrations and the spectroscopic physics. If you look at the raw brightness temperature data, you can see that average brightness temperature change in the high frequency wing of the main CO2 emission band (wavenumber 710 - 760 cm-1) between 1970 and 1996 is negligible. You can suppose there is a large decrease masked by changes in atmospheric temperature and moisture fields and you can assume those fields behaved just like that, but that is not measurement. If average specific humidity in fact shows a decreasing trend above 700 hPa (as measured), that is inconsistent with masking. If a computational climate model like CRUTEM3 indicates otherwise, it is still not measurement, but a theoretical result contradicted by measurement. If average brightness temperature decreased by 1°C in said band, that would decrease OLR (Outgoing Longwave Radiation) by about 0.2 W/m2. However, raw brightness temperature data show it was less than 1°C (and possibly zero). The low frequency wing was not measured, but that's already outside the main atmospheric window and overlaps with pretty strong H2O absorption lines, so its effect is probably even less pronounced. The question is not whether the CO2 effect is saturated or not, but if it is saturated enough to exclude a strong effect. The same way as in the case when one has to choose between a spherical vs. flat Earth model. Then the differences between a sphere and the geoid are surely negligible. -
werecow at 09:35 AM on 2 May 2011Rescue Climate Data
These data are neatly typed and, with a bit of preprocessing, should be conducive to using automated character recognition! Has anyone considered automating part of this? You could do an OCR scan on the images, use that to fill in the appropriate columns a priori, and then have several volunteers check the results. That should make their lives much easier. You can even make the OCR "trainable" to extend it to other type writer fonts, and possibly enhance it further by using some outlier detection. I have only limited experience with OCR myself, but it looks like this would be a pretty good option here. -
eveningperson at 09:25 AM on 2 May 2011Frauenfeld, Knappenberger, and Michaels 2011: Obsolescence by Design?
@mozart: "It seems the market, distilling all the information available, is not particularly worried." One might think that, after the experiences of the last few years, people would realise that "the market" does not magically distil all available information. In fact the behaviour of "the market" is determined by the prejudices and misconceptions of those individuals acting in it. And, as is only too clear there are powerful, moneyed forces intervening in particular markets to create confusion and misinformation. The clearest thinking on climate change, outside the climate scientists themselves, appears to be in the insurance industry, which stands to lose badly from climate change if it gets the facts wrong. And it takes the science seriously. -
David Horton at 09:08 AM on 2 May 2011Frauenfeld, Knappenberger, and Michaels 2011: Obsolescence by Design?
What kind of "scientists", having written a paper on what they believed was a trend (or lack of trend) to the year 2009, would, on discovering that the year 2010 totally reversed their conclusions, go ahead and publish their original hypothesis anyway? Is there a word for the complete opposite of normal scientific process? -
kdkd at 09:00 AM on 2 May 2011Frauenfeld, Knappenberger, and Michaels 2011: Obsolescence by Design?
BP #16 Yes, that should probably read "Satellites have helped infer an energy imbalance at the top of the Earth's atmosphere". There are many things in the science of measurement that we can not observe directly for a variety of reasons. I assume that you're not suggesting that none of these things exist. -
Berényi Péter at 08:02 AM on 2 May 2011Frauenfeld, Knappenberger, and Michaels 2011: Obsolescence by Design?
"Satellites have measured an energy imbalance at the top of the Earth's atmosphere". This proposition is not true. See e.g. Trenberth 2009: "There is a TOA imbalance of 6.4 W m-2 from CERES data and this is outside of the realm of current estimates of global imbalances that are expected from observed increases in carbon dioxide and other greenhouse gases in the atmosphere". Or Trenberh 2010: "The difference between the incoming and outgoing energy -- the planetary energy imbalance -- at the top of the atmosphere is too small to be measured directly from satellites".Moderator Response: [DB] Your criticism more properly belongs on the thread you reference: Tracking-the-energy-from-global-warming (you will find several of your comments there already). This thread is about FKM's publishing of an obsolete paper. -
Albatross at 07:57 AM on 2 May 2011How climate change deniers led me to set up Skeptical Science website
John C., I very much look forward to reading your book. The psychology of those who deny the reality of AGW and its potentially serious consequences for humanity is fascinating. I will be placing a request for the city's main library to buy a few copies of your book-- close to a million people have access to the library :) -
Albatross at 07:53 AM on 2 May 2011Lindzen Illusion #2: Lindzen vs. Hansen - the Sleek Veneer of the 1980s
RW1, Please stop trolling. -
Daniel Bailey at 07:53 AM on 2 May 2011Video and podcast about confusing the hockey stick with the 'decline'
Careful, Peter, of the little "yippers" or their leader, the "Grand Poohbah Yipper" might send you a terse email. It IS their MO...anyway, loved the vid & the not-pulling-of-punches. The denialarati won't like it, of course; most are unlikely to even click on the link, however. I'll listen to Dan's piece tonight. The Yooper -
muoncounter at 07:33 AM on 2 May 2011Lindzen Illusion #2: Lindzen vs. Hansen - the Sleek Veneer of the 1980s
d82 #45: "trend is up, and natural variability is out." It's also relevant that the temperature anomaly curve is strongly concave up. That behavior is impossible to duplicate with low sensitivity to CO2, as some claim, usually without benefit of any evidence such as these graphs. -
dana1981 at 07:27 AM on 2 May 2011Video and podcast about confusing the hockey stick with the 'decline'
Great job by Peter Sinclair. A very thorough and clear summation of the 'hide the decline' confusion. No sleight meant to Dan, I haven't listened to his show yet :-) -
KR at 07:06 AM on 2 May 2011CO2 effect is saturated
Berényi - Thank you, that does clarify matters. - You were not insinuating data manipulation by Anderson, but rather accusing Harries of overprocessing their data and reaching unwarranted conclusions. Which by implication is also an accusation against Griggs 2004 and Chen 2007, as their results agree with Harries. - Secondly, the Anderson data was indeed inappropriate to compare directly to Harries, as you did earlier. Finally, I will note that Anderson has stated that he cannot make conclusions about moisture from the data points. I don't have a copy of Harries readily available, I don't know what they wrote on that subject. But, quite frankly, we have plenty of data on relative and absolute humidity from other sources over the last 50-70 years, and adjust accordingly. The conclusion from all these papers? That CO2 is not saturated, and that the last quarter century of satellite data shows increasing effects at the GHG frequencies expected from GHG concentrations and the spectroscopic physics. -
d82 at 06:33 AM on 2 May 2011Lindzen Illusion #2: Lindzen vs. Hansen - the Sleek Veneer of the 1980s
RW1@42, There is more than UAH data to look at. See the NOAA webpage of the tropospheric data up to 2010. Taking the decadal averages of these data since 1958 (including the balloon data) and comparing them with the decadal averages of the combined Land-Ocean data and the predictions of the NASA/GISS group of Hansen et al. in 1981, 1988 (solution B) and the 2007 update (red square for the 2010's) gives the following picture:
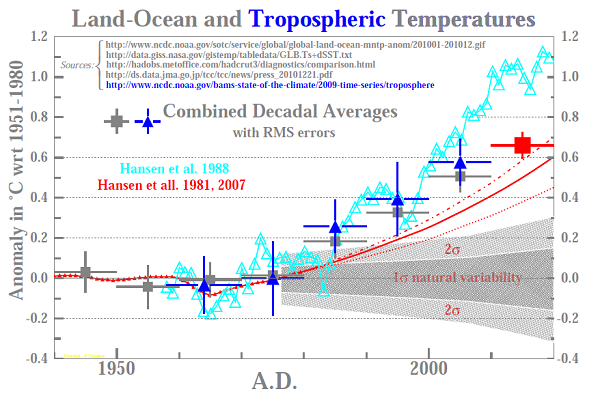 The trend is up, and natural variability is out. For more details click here.
-
RW1 at 06:28 AM on 2 May 2011Lindzen Illusion #2: Lindzen vs. Hansen - the Sleek Veneer of the 1980s
The point is the amount global average temperature can fluctuate from year to year is greater than the whole of the 30 year trend. This means the trend is well within the range of natural variability and not statistically significant. Furthermore, the 0.3 to 0.4 trend is barely even outside the margin of error. Talk about trying to make Mt. Everest out of a mole hill. No wonder Lindzen has trouble taking any of this kind of stuff seriously.Moderator Response:No, you are incorrect. You need to learn the basics of statistical trend analysis.
[dana1981] Indeed, it's hard to take you seriously when you can't seem to learn the difference between signal and noise.
-
muoncounter at 06:15 AM on 2 May 2011Waste heat vs greenhouse warming
RSVP#416: "the equation you provide for voltage " I did not provide; that is the definition of electrical potential. The difference in potential between two points is what is commonly referred to as 'voltage.' "a large temperature change can be relatively meaningless if it has to do with heating of small masses." Your exercise in high school algebra proves your thesis incorrect. There is no visible deltaT due to waste heat, for large mass: In case you did not read the caption, the first IR photo was taken 5.2 miles away from the power plant. The mass of the ground in that image is not small. Low deltaT with large mass requires q to be small: waste heat is insignificant. On the other hand, there is a very visible deltaT over a small patch of ground (low mass) under the car. But the small amount of heat energy does not warm a large mass. Once again, proving KR's point. -
JMurphy at 05:59 AM on 2 May 2011Frauenfeld, Knappenberger, and Michaels 2011: Obsolescence by Design?
Good to see the so-called skeptics content to rely on out-of-date data (and happy to confirm each other or, at least, not criticise each other, in that reliance), just so they can prove a point to each other, congratulate each other, have another paper they can wilfully misuse and, generally, continue on their pseudo-scientific path. Plus ça change... -
Rob Honeycutt at 05:54 AM on 2 May 2011Frauenfeld, Knappenberger, and Michaels 2011: Obsolescence by Design?
johnd... Don't you think that just one reviewer, especially one for whom Greenland temperature records is his area of expertise, saying that the entire conclusion of the paper would have to be changed based on the latest data would be cause for any rational editor to request a rewrite of the paper? This sounds suspiciously like another breakdown in the editorial process, a la Soon and Baliunas style. -
JMurphy at 05:53 AM on 2 May 2011Lindzen Illusion #2: Lindzen vs. Hansen - the Sleek Veneer of the 1980s
UAH trend is 0.14C per decade, and yet someone can claim that the trend has been "wiped out in one year" ! Does that mean that a cold week in mid-Summer means that Summer is then over ? Or is it better to look at long-term trends rather than rely on two cherry-picked data points ? It is easy to see the difference between those who want to know the true picture and those who don't. -
RSVP at 05:31 AM on 2 May 2011Waste heat vs greenhouse warming
muoncounter 415 Interestingly, the equation you provide for voltage resembles the heat formula q = mC deltaT, which when turned around demonstrates how voltage can be likened to temperature such that deltaT = q/mC. As you can see, for a given energy q, the change in temperature is directly related to specific heat and mass. So the detection of a large temperature change can be relatively meaningless if it has to do with heating of small masses. -
mspelto at 05:07 AM on 2 May 2011Frauenfeld, Knappenberger, and Michaels 2011: Obsolescence by Design?
Tenney it worked yesterday, but no luck now. The paper is also at Tedesco et al (2011). Of interest is also the increased intensity of melt, which goes beyond mere extent. A paper in review van den Broeke et al (2011) on "The seasonal cycle and interannual variability of surface energy balance and melt in the ablation zone of the west Greenland ice sheet", focuses on this in Figure 4. Note the exceptional 10 day periods of melt that the authors are concerned will become more widespread. This paper also highlights the extent of the ongoing fieldwork that is shedding light on Greenland melt that the paper in question here does not, there is no new data or insights offered. Also note the draft paper by Mernild et al (2011) , scroll down to Feb. 4, referenced herein responded to 4 separate reviews (including mine), in 15 comments before publication. -
RW1 at 05:00 AM on 2 May 2011Lindzen Illusion #2: Lindzen vs. Hansen - the Sleek Veneer of the 1980s
 The global temperature is already back to what it was over 30 years ago in 1980. Virtually the entire trend was wiped out in one year. This is fundamentally the problem with this. Without the two large El Ninos, there wouldn't even be a much of warming trend at all. Even a 0.3 C warming is ant crumbs - you couldn't even feel that on your skin.
Moderator Response: [DB] Fixed text. BTW, the Lower troposphere isn't necessarily the best temp record (or even UAH among satellite records, either); GISS LOTI probably is best overall. Anyway, UAH LT since 1979:
The global temperature is already back to what it was over 30 years ago in 1980. Virtually the entire trend was wiped out in one year. This is fundamentally the problem with this. Without the two large El Ninos, there wouldn't even be a much of warming trend at all. Even a 0.3 C warming is ant crumbs - you couldn't even feel that on your skin.
Moderator Response: [DB] Fixed text. BTW, the Lower troposphere isn't necessarily the best temp record (or even UAH among satellite records, either); GISS LOTI probably is best overall. Anyway, UAH LT since 1979: GISS LOTI:
 Yup, no problem.
 -
johnd at 04:10 AM on 2 May 2011Frauenfeld, Knappenberger, and Michaels 2011: Obsolescence by Design?
johnd at 04:06 AM, to clarify, the "he" in "that he would then be unaware" is of course Dr.Box. -
johnd at 04:06 AM on 2 May 2011Frauenfeld, Knappenberger, and Michaels 2011: Obsolescence by Design?
How many people were asked to review the paper and what were the considerations of the other reviewers? This should be known before passing judgment. I take it that by declining the invitation to re-review the paper, that he would then be unaware of any changes the authors may have made, creating a situation that his initial review may not be still relevant, thus excluding himself from the process. The publishers generally would be the only ones able to evaluate and balance the worth of each reviewer, obviously having to risk someone getting their nose out of joint if there happened to be divergent views. -
Tenney Naumer at 03:42 AM on 2 May 2011Frauenfeld, Knappenberger, and Michaels 2011: Obsolescence by Design?
WheelsOC, those faux "think" tanks have no credibility at all. -
WheelsOC at 03:35 AM on 2 May 2011Frauenfeld, Knappenberger, and Michaels 2011: Obsolescence by Design?
About halfway through the explanation of the paper, I wondered if "Michaels" wasn't in fact Pat Michaels. Clicking the link to read the abstract confirmed it. For what it's worth, Knappenberger also collaborates with Michaels on their think-tank's climate contrarian blog, World Climate Report. Both of them also find their way into the "experts" listings of other right-wing think-tanks like the George C. Marshall Institute (along with Frauenfeld). Writing a paper like this and refusing to update it in the face of timely and relevant data at the behest of reviewers should remind us to question the credibility of such organizations, who rely so heavily on experts like these to sway public policy. -
newcrusader at 03:35 AM on 2 May 2011Frauenfeld, Knappenberger, and Michaels 2011: Obsolescence by Design?
“… the fundamental issue is linearity versus non-linearity. Hansen argues that amplifying feedbacks make ice-sheet disintegration necessarily highly non-linear. In a non-linear problem, the most relevant number for projecting sea level rise is the doubling time for the rate of mass loss. Hansen suggested that a 10-year doubling time was plausible, pointing out that such a doubling time from a base of 1 mm per year ice sheet contribution to sea level in the decade 2005-2015 would lead to a cumulative 5-metre sea-level rise by 2095. “ Hansen repeats his view, first published in 2007 but widely ignored, that a 5-metre sea-level rise is possible. In fact, recent research by Blancon et al published in Nature in 2009, examining the paleoclimate record, shows sea-level rises of 3 metres in 50 years due to the rapid melting of ice sheets 123,000 years ago in the Eemian, when the energy imbalance in the climate system was less than that to which we are now subjecting the planet. -
Tenney Naumer at 03:27 AM on 2 May 2011Frauenfeld, Knappenberger, and Michaels 2011: Obsolescence by Design?
Excellent post! However, both links to the Tedesco paper are not working.Moderator Response: [muoncounter] That was a pre-publication version. Try the final pdf. -
muoncounter at 03:16 AM on 2 May 2011Frauenfeld, Knappenberger, and Michaels 2011: Obsolescence by Design?
Can you imagine: Insurance companies leading the way on climate change concern? From Will climate change alter liability risks? On one issue the experts are in agreement: Anthropogenic climate change will have an impact on the environment, society, and the economy. A subject that has not yet received much attention, however, is: How will climate change alter the field of liability insurance? Coming soon to a theater near you: Clash of the Titans 3 - Oil industry vs Insurance industry! -
JMurphy at 03:11 AM on 2 May 2011Frauenfeld, Knappenberger, and Michaels 2011: Obsolescence by Design?
mozart wrote : "What is indisputable is there is a gradual warming since 1820. The cause is in dispute." Really ? Would you care to define "gradual" and give what you believe the cause to be - with proof, of course. mozart wrote : "But it's odd that the "rising sea levels" have not had any effect on ocean front property prices. It seems the market, distilling all the information available, is not particularly worried." What's odd is that you can bring up the housing market as an example of...well, are you trying to use it to disprove sea-level rise or what ? As for "ocean front property prices", are you referring to them all, or just some in particular - I believe there may be some in Japan going cheap. Do you have any figures ? Ultimately, though, could it be true that property prices operate in a bubble which has little firm basis in the real world ? Surely that would lead to record foreclosures... -
Tom Dayton at 03:01 AM on 2 May 2011Frauenfeld, Knappenberger, and Michaels 2011: Obsolescence by Design?
mozart, companies that insure ocean front property are in fact very worried. -
Bob Lacatena at 02:58 AM on 2 May 2011How climate change deniers led me to set up Skeptical Science website
46, Everyone, Ken said:Do you seriously think that 'scientists' who have spent careers...
Once again, he denigrates scientists, first through the simple act of putting the word in quotes, implying that they aren't actual scientists. Then he maligns them by implying that they'd wish ill on their fellow man just to maintain adherence to current climate theory. He then follows by implying that an understanding of current climate science is a "belief," as if it's an optional choice of faith, rather than a reasoned understanding of the science. This is probably the crux of Ken's problem, and why he gets so much wrong. His efforts to do so are clearly handicapped by his own preset desire to arrive at a chosen result. He even admits to this when he says:it might not be there..
He doesn't know. It's just a possibility, and one that he'll wager on because he hasn't considered the rather deep and detailed science which reasons that it should be there and almost certainly is... it will be shocking if it's not. But for him, it's only a short step to go from "it might not be there" to closing his eyes and insisting that it isn't there, even though all of the evidence says that it is. It's climate change denial in a well wrapped package, with a nice, shiny bow. The net result is that his own position is founded on a combination of ignoring some of the evidence in order to reach a conclusion which matches his chosen belief... then he attributes that same approach to everyone else, including all of the dedicated, educated, and hard working climate scientists, and the people who have taken the time to review and understand all of the science and all of the evidence. -
mozart at 02:45 AM on 2 May 2011Frauenfeld, Knappenberger, and Michaels 2011: Obsolescence by Design?
What is indisputable is there is a gradual warming since 1820. The cause is in dispute. But it's odd that the "rising sea levels" have not had any effect on ocean front property prices. It seems the market, distilling all the information available, is not particularly worried.Response:[DB] "What is indisputable is there is a gradual warming since 1820."
Actually, while the first part of your "warming since 1820" may have been gradual, in reality the warming since about 1980 is nearly unprecedented in the paleo record.
"The cause is in dispute."
Not by those who have taken the time to educate themselves on the science.
"But it's odd that the "rising sea levels" have not had any effect on ocean front property prices."
Just because birds fly towards warmer climes in winter doesn't mean the price of tea in China has anything to do with the Yankees chances of winning the World Series. There, that made as much sense as your statement and was as nearly on-topic.
"It seems the market, distilling all the information available, is not particularly worried."
IBID.
I must congratulate you, sir. You have served up a textbook example of the spin used by "skeptics" to sow the seeds of doubt and cause confusion:
- First you align with the poster by agreeing that there is warming going on, but minimalize it with your "gradual" sobriquet.
- Second you sow the seeds of doubt by stating, completely without foundation or cited reference, words that are diammetrically in opposition to the state of the science.
- Third you then grab the horns of the topic of the thread and with a mighty effort attempt to steer the thread completely off-topic.
- You sum your opus with a combination of off-topic dissembling and "it's not bad" marginalization.
Well-done.
-
Bob Lacatena at 02:39 AM on 2 May 2011A Flanner in the Works for Snow and Ice
145, Ken, You dodged the question. You said:The above 4.14 - 5.69E20 number is still roughly half the NET 9.17E20 Joules/year you are claiming from Flanner.
Flanner covers the entire northern hemisphere, while your numbers are limited to the Arctic Circle. That is clearly the discrepancy, and until you fill in the gap, I'm not quite sure what your point is. -
arch stanton at 02:13 AM on 2 May 2011Frauenfeld, Knappenberger, and Michaels 2011: Obsolescence by Design?
What’s with AGU? Are they sacrificing JGR in the interest of a lively debate? Are certain editor(s) simply willing to sacrifice standards in order to appear sympathetic to “contrarians” and therefore refute claims of bias? Something else? -
Rob Honeycutt at 02:06 AM on 2 May 2011Frauenfeld, Knappenberger, and Michaels 2011: Obsolescence by Design?
What concerns me is that FKM2011 actually got published without being updated per Dr Box's comments. I mean if a reviewer clearly states that the conclusion of the paper can't be supported based on up-to-date data that should be the point where the editors go back to the authors and say, "Update it, please." What's going on at JGR that this didn't happen? On Dr Box's site he notes that they are already preparing a review. I'm sure it will be scathing. You can tell Dr Box is not happy about this paper getting through. -
jorget at 01:29 AM on 2 May 2011CO2 is plant food? If only it were so simple
I suspect that increased average or maximum temperatures caused by increased atmospheric CO2 content will probably negate any positive effect of CO2 discussed here. I know from experience (200km NW from Sydney, Australia) that during summer heatwaves, when maximum daily temperatures exceed 40C, my vegetables simply stop growing regardless of how much water I can supply. This year our mandarins, a winter crop, started to ripen about three weeks earlier this year. Consequently,they became attacked by Queensland fruit fly (Bactrocera tryoni}, which is a major summer pest here. I can also observe changes in the local rainfall patterns during the last two decades. For example, we are no longer getting major rain events associated with southern cold fronts. Most of our rain now comes from the tropics. These effects may be far more important for plant growth then CO2. -
Albatross at 01:20 AM on 2 May 2011How climate change deniers led me to set up Skeptical Science website
Re #46, Yet another post filled with rhetoric and hyperbole, and references to religion. Enough already. I could be wrong, but i do not think that the "skeptic"/contrarian in question has actually spoken to the material contained in John's post yet. In fact, their very first post was off-topic. -
Eamon at 00:47 AM on 2 May 2011Medieval project gone wrong
Another failing of that site is that it often fails to recognise that the term "Before Present", in Paeloclimatatic Science, means "Before 1950". Hence they often, either wilfully or foolishly, make very flawed comparisons. -
Bernard J. at 00:10 AM on 2 May 2011CO2 is plant food? If only it were so simple
I'll put up my hand in support of Spaerica's comment at #40 and Stephen Baines' at #47, about precipitation. David B intimates that water availability is more than just precipitation, but I would note explicitly that the related aspect of evapo-transpiration is relevant in this regard too. Even with non-drought conditions, increases in evapo-transpiration rates loom as a big problem for agriculture in the future. -
Ken Lambert at 00:10 AM on 2 May 2011A Flanner in the Works for Snow and Ice
Sp #144 Well tell us the area of the Earth's surface you are considering. We can go from 4.4% inside the Artic circle to 50% for the NH if you like. -
Bernard J. at 00:07 AM on 2 May 2011CO2 is plant food? If only it were so simple
One of the reasons I often grew impatient with my erstwhile molecular biology (and other biomedical sciences) colleagues was that they frequently displayed a dismaying lack of understanding of ecological, evolutionary, and even thermodynamic limitations to biochemical variation in organisms. Humanityrules at #24 demonstrates exactly this sort of unsophisticated starry-eyed ignorance of the limitations imposed by broader biological issues. Fortunately, Marcus at #38 restored my faith in my molly-bolly brethren by pointing out to HR that there's no such thing as a free lunch. It would be a hijacking of the thread to detail the many ways in which tinkering with evolutionarily-refined characters faces the reality of biological, chemical, and thermodynamic feedings-back, but for folk such as HR I recommend careful consideration of a short piece by Mills and Bonne. Ian Forrester at #45 also makes a salient point by asking for evidence that humans are actually efficent at increasing the efficiency of biochemical processes by tweaking the genetic blueprints of targetted organisms. I await the answer to this with keen interest... For bonus points I would be interested in some clear consideration of how agriculture will function in a world with higher atmospheric CO2, when the oil that fuels the energetic and fertiliser-feedstock requirements for the industry becomes ever more scarce. -
Ken Lambert at 23:59 PM on 1 May 2011How climate change deniers led me to set up Skeptical Science website
Thank you JohnD - a thoughtful and telling comment. Skywatcher - A nice try but implausible. Do you seriously think that 'scientists' who have spent careers proposing the theory of AGW mainly via CO2GHG mechanisms would cheer, laud and celebrate if they were proven wrong? Your belief in the better angels of human nature is enviable but unrealistic. In my tender youth a Dr Paul Ehrlich was holding the planet in thrall to his apocalyptic predictions of mass starvation by the end of the 1980's, and a host of other Club of Rome disasters. Most of the students of the era believed his predictions and screamed for radical action. Does anybody remember him now? I saw him interviewed not long ago, and even though events proved his predictions absurd and plain wrong, he still clung to a defence - the disaster was delayed. And for JMurphy and Sphaerica: As said previously - this can go two ways. Dr Trenberth goes for 'its there but we can't adequately measure it', and I am going for the 'if it ain't measured it might not be there', if and until the measurements say more. If you go for 'its there but we can't adequately measure it', then a quantity of 'belief' is required to make up the balance. That quantity of belief is the difference between what we can measure and what we think is there. Rather than counting angels on the heads of pins, we can put some numbers of the quantity of belief. Proposed Warming imbalance : 0.9W/sq.m Measured Warming imbalance : 0.1 - 0.6W/sq.m Quantity of Belief: 0.3 - 0.8W/sq.m When there is belief required - doubt is the logical companion. -
Bernard J. at 23:58 PM on 1 May 2011CO2 is plant food? If only it were so simple
Excellent summary. Well done. Keeping in mind some of caveats raised in David B's post at #48, something that is often not touched upon in discussions of this nature is the question "so, do the plants themselves actually want all of this extra carbon dioxide?". One very neat way to answer it is demonstrated by studies that examined the responses of plant stomata density to increasing artmospheric CO2. In Ginkgo biloba*, a tree that has an almost 300 million year history on Earth, it has been demonstrated that stomatal density has decreased by almost 30% since 1924. This would seem to indicate that this species is eschewing at least a large portion of the extra CO2 in order to improve the efficiency of water regulation, and of other thermodynamic costs. It appears that for Ginkgos at least, the response to "more plant food" is to say "thanks, but I'll cash that in for something else, if you please". Ginkgos apparently know of Leibig's law of the Minimum, where global warming deniers do not. [* I mention ginkgos, because their stomatal patterns serve as another proxy for CO2 concentration over geological time...] -
Rob Painting at 23:56 PM on 1 May 2011What was it like the last time CO2 levels were this high?
BP @ 62 No. This tells us our climate is sensitive to the formation of the Isthmus of Panama and the associated changes in ocean circulation. No, this tells us the Earth's climate is sensitive to perturbation full stop. CO2, ocean circulation, global vegetation (talking the arrival of flowering plants here), global orography (mountain chains) all have had significant impact on the climate. And there was no ocean acidification during the Pliocene. -
muoncounter at 23:28 PM on 1 May 2011Waste heat vs greenhouse warming
RSVP#414: "you are unlikely to "see" waste heat with IR cameras." Except when you do. And voltage = Joules/Coulomb, energy per unit charge, which is an energy density. -
Bob Lacatena at 21:43 PM on 1 May 2011Models are unreliable
353, trunkmonkey, See here and here for info on models. In particular, last section of the first link is titled "Can I use a climate model myself?". -
Bob Lacatena at 21:39 PM on 1 May 2011What was it like the last time CO2 levels were this high?
62, BP, You comment seemingly came out of nowhere. Is it from another thread? What exactly is your point? -
Berényi Péter at 21:25 PM on 1 May 2011Models are unreliable
#354 CBDunkerson at 19:22 PM on 1 May, 2011 we are instead currently seeing accumulation of heat in both hemispheres No, we are currently not seeing anything like that. Rate of heat accumulation in the upper 700 m of oceans in 2003-2010 (when it is measured properly by ARGO) is 5.5±6.5×10²⁰ J/year. That is, it's flat. Even if we go with the upper bound (12×1020 J/year), it takes 900 years to warm up this layer by 1°C, which is a warming rate of 0.11°C/century. However, it is entirely possible that the upper ocean is actually losing heat. Note that rate of change in surface temperatures in general can't be far removed from rate of upper ocean heating, as heat capacity of oceans is three orders of magnitude higher than that of the atmosphere. We also have (rather low quality) data for 1955-2010. If we take it on face value and believe the error bars provided by Levitus et al. are correct, average rate of heat accumulation in the upper ocean during this 56 year period is 25.3±0.5×10²⁰ J/year. At this rate it takes at least 450 years to heat it up by 1°C, which is 0.22°C/century. It is much smaller than the alleged late 20th century warming rate of the surface, so that could only be a transient phenomenon mostly due to redistribution of heat in the climate system (and also failure in properly taking into account local warming close to land based measurement sites due to land use changes - a.k.a. UHI). -
Berényi Péter at 20:57 PM on 1 May 2011What was it like the last time CO2 levels were this high?
#63 Tom Curtis at 19:39 PM on 1 May, 2011 so your theory is that the Arctic froze over because the warm current from the Gulf of Mexico to the Barents Sea was strengthened? Well it's so obvious when you think about it. It is not my theory, it is the standard one. When the Isthmus of Panama is removed, tropical high salinity surface waters can escape directly from the Atlantic to the Pacific. The remaining branch of the warm current does not have sufficient salinity to go down to the bottom before it reaches the Arctic Ocean (as it does today), so it just goes around and heats the entire region up. Also, the additional warm surface water entering the Pacific via the Panama Strait maintains near-permanent El Niño conditions there. -
Tom Curtis at 19:39 PM on 1 May 2011What was it like the last time CO2 levels were this high?
Berényi Péter @62, so your theory is that the Arctic froze over because the warm current from the Gulf of Mexico to the Barents Sea was strengthened? Well it's so obvious when you think about it.
Prev 1729 1730 1731 1732 1733 1734 1735 1736 1737 1738 1739 1740 1741 1742 1743 1744 Next


