


 Arguments


Recent Comments
Prev 1739 1740 1741 1742 1743 1744 1745 1746 1747 1748 1749 1750 1751 1752 1753 1754 Next
Comments 87301 to 87350:
-
Camburn at 06:07 AM on 11 May 2011Lindzen Illusion #6: Importance of Greenhouse Gases
As to what a slab atmosphere is I will refer you to this: http://www.gps.caltech.edu/classes/ese148a/lecture8.pdf -
David Horton at 05:56 AM on 11 May 2011Upcoming 'Climate Change Denial' book launches in Sydney and Canberra
John, will try to make the Canberra launch. Well done. -
dana1981 at 05:56 AM on 11 May 2011Lindzen Illusion #6: Importance of Greenhouse Gases
akbetts - interesting, thanks for the info. At least as late as 1996 Lindzen was still arguing that climate models exaggerated the water vapor feedback, as discussed in Lindzen Illusion #4. -
Bob Lacatena at 05:55 AM on 11 May 2011Lindzen Illusion #6: Importance of Greenhouse Gases
23, Camburn,That is the definition of a slab atmosphere in entirety.
This is wrong. If you believe it is correct, please provide a citation. See my comment at 20 to understand why certain parameters are held constant.He used AR4 GISS E and and fixed the climate.
No. He presumably ran the model to arrive at a representative state at equilibrium, then held that state constant while computing the radiative fluxes of the various components. He did not "restrain" the model by parameters it was "subjected to." There is a huge difference. You misunderstand what was done. -
Camburn at 05:46 AM on 11 May 2011Lindzen Illusion #6: Importance of Greenhouse Gases
Robert: What you are quoting is a partial slab. When Schmidt stated that the climate paramiters were fixed....that is the definition of a slab atmosphere in entirety. He used AR4 GISS E and fixed the climate. I don't understand the questions that have been raised as I stated what Schmidt stated about the model used. The model was restrained by the paramiters it was subjected to. Kinda like one slice of a CT scan isn't it? -
chuckbot at 05:28 AM on 11 May 2011Monckton Myth #16: Bizarro World Sea Level
I'm still kind of reeling. http://cheezburger.com/View/4725366272 -
RobertS at 05:28 AM on 11 May 2011Lindzen Illusion #6: Importance of Greenhouse Gases
Camburn @17, How does that quote indicate a slab atmosphere? "Slab" is typically taken to mean a single isothermal layer with uniform absorptivities over the LW and SW spectrums. GISS ModelE certainly isn't that. Radiative forcing by definition is the change in radiative flux at the TOA considered whilst keeping the climate "fixed" (after stratospheric equilibration). -
akbetts at 05:20 AM on 11 May 2011Lindzen Illusion #6: Importance of Greenhouse Gases
The October 7, 1991 testimony to the Senate Hearing before the Committee on Commerce, Science, and Transportation, United States Senate on "Global Change Research: Water Vapor and the Climate System" gives an informative perspective on the scientific perception of water vapor and cloud feedback issues in 1991. I have posted a full transcript of this hearing (which is otherwise unavailable on the web) at http://alanbetts.com/workspace/uploads/us-senate-roleofcloudsinclimate-7-1283380998.pdf This hearing, chaired by Senator Al Gore; including prepared statements by: Albert Arking, Alan K. Betts, Robert Cess, Robert Charlson, Michael Hall, Richard S. Lindzen, V. Ramanathan, William B. Rossow, Shelby Tilford, Col. Robert Townsend and Kevin Trenberth as well as the lengthy discussion that followed, which clarified several issues. This hearing is an interesting snapshot of scientific opinion on the climate change issue in 1991. Speakers were invited to present a range of opinions. I was invited to present a counter argument to the negative feedback mechanism (upper tropospheric drying by deep convective clouds in the tropics) proposed by Lindzen at that time. My prepared statement ("The Role of Clouds in Climate Change") is P33-37; Lindzen's is P14-20. The general discussion starts on P50. The discussion of Lindzen's hypothesis is mostly P64-76. Lindzen formally withdrew his hypothesis during the discussion (on P68 - this was news to Al Gore). However I don't think this retraction was well-publicized; and Lindzen has continued to suggest other mechanisms for low climate sensitivity - which are discussed elsewhere on this site.Response:[DB] Hot-linked URL.
-
Bob Lacatena at 05:18 AM on 11 May 2011Lindzen Illusion #6: Importance of Greenhouse Gases
18, Camburn,...by holding the climate fixed, this is the definition of a slab atmosphere.
No, by holding the climate fixed, they do not need to worry about the interaction of absorption and emission changing those properties, which change the absorption/emission, and so on, requiring a huge number of recursive calculations. Reducing degrees of freedom within a problem in order to simplify calculations (i.e to make them remotely doable) is a pretty standard practice in most fields, and one that does not equate to a "slab" atmosphere. -
Bob Lacatena at 05:15 AM on 11 May 2011Lindzen Illusion #6: Importance of Greenhouse Gases
17, Camburn, How does that quote in any way imply that the model uses a "slab" atmosphere? From Schmidt et al [2006] describing modelE:The standard vertical resolution has 20 layers and a model top at 0.1 hPa (Fig. 1). Compared to pre- vious 12-layer versions (i.e., Hansen et al. 2002), the 20-layer code has 2 extra layers near the surface, 2 more in the lower stratosphere, and 4 extra layers above 10 hPa. We also describe a 23-layer version that better resolves the stratosphere and has a model top near the mesopause (0.002 hPa; Rind et al. 1999; Shindell et al. 1999).
-
Camburn at 04:55 AM on 11 May 2011Lindzen Illusion #6: Importance of Greenhouse Gases
Tom Curtis@11: Also, I don't know what you mean as a sound bite as it is clear that by holding the climate fixed, this is the definition of a slab atmosphere. -
Camburn at 04:02 AM on 11 May 2011Lindzen Illusion #6: Importance of Greenhouse Gases
Tom Curtis @11: Ref 3. Modeling Experiements: (14). WE use the IPCC AR4 version of GISS ModelE to calculate the instanteous changes in radiative fluxes to changes in indivueal LW absorbers, while holding the climate (spatial and temporal distributinos of temperature, surface properties, etc) fixed. This is a slab atmosphere. Thank you. -
chris at 03:58 AM on 11 May 2011Frauenfeld, Knappenberger, and Michaels 2011: Obsolescence by Design?
Tom, in response to your suggestion that the 4 station+NAO analysis might be poor in covering global Greenland melt, FKM would point you to their methods section in which they describe the optimisation of their model by comparison with the empirical (satellite-derived) data from 1979-2009. They say:”Our Greenland melt reconstruction therefore focuses on the relationship between summer average temperatures from the available four coastal locations in southern Greenland and our standardized melt index. We determined that during 1979–2009, a combined (simple average) temperature for JJA (4-Temp) correlates well with annual total melt extent. Using other spatial or temporal combinations of the temperature data and melt extent does not produce stronger or more robust relationships." ....and later on: ..."We find that these two variables explain 65% of the year-to-year variance and 81% of the trend in total melt extent from 1979 to 2009 (Table 1).”
However the year-on-year comparison of modelled and empirical melt (FKM2011, Figure 3; reproduced below), shows that the model fails to accommodate some fairly strong and identifiable features of forced variability. Figure 3. Residual ice melt extent index (observed minus model fitted values) for our 4‐Temp and NAO model (solid circles) and for the model using run‐off (open circles) [Hanna et al., 2008].
It's clear, especially, that NH or global temperature variability that is represented in empirical melt data is not captured in the model; e.g.:
- the cold years 1985/1986 that have very cool temperature anomalies in the global record
- the cooling post-Pinatubo (the large 1992 departure of the model from empirical data)
- the 1998-El-Nino
-the truly enormous 2000 (negative), 2002 (positive) and 2003 (negative) departures between the empirical and modelled data.
- all melts between 2004-2007 inclusive are underestimated in the model. (not sure why they don't show 2008, 2009 empirical/model comparisons).
What does this mean
1. It supports your assessment of the potential flaws of assessing Greenland melt using 4 station +NAO data. In fact FKM2011 agree with you:
Figure 3. Residual ice melt extent index (observed minus model fitted values) for our 4‐Temp and NAO model (solid circles) and for the model using run‐off (open circles) [Hanna et al., 2008].
It's clear, especially, that NH or global temperature variability that is represented in empirical melt data is not captured in the model; e.g.:
- the cold years 1985/1986 that have very cool temperature anomalies in the global record
- the cooling post-Pinatubo (the large 1992 departure of the model from empirical data)
- the 1998-El-Nino
-the truly enormous 2000 (negative), 2002 (positive) and 2003 (negative) departures between the empirical and modelled data.
- all melts between 2004-2007 inclusive are underestimated in the model. (not sure why they don't show 2008, 2009 empirical/model comparisons).
What does this mean
1. It supports your assessment of the potential flaws of assessing Greenland melt using 4 station +NAO data. In fact FKM2011 agree with you:
” Overall, the residuals are very similar, but the 4 years with the greatest residuals using our model (1998, 2000, 2002, and 2003) are all reduced by more than half in the run‐off model (the effects of the inclusion of precipitation in the run‐off model are small). This result suggests that broader spatial patterns of temperature across Greenland that are not well captured by our southern coastal temperature composite can account for a proportion of the variance in annual ice melt extent not captured by our two‐variable model.”
2. It's not a fundamental flaw in the paper. After all you're allowed to publish a comparison of empirical melt index with reconstructed melt using a model, and it doesn’t have to be perfect. 3. However, it reinforces the essential meaningless of the discussion of statistical significance in differences in the empirical 2007 (and 2010) melt data and early-mid 20th century modelled melt. In my opinion the referees should have insisted that statements about stat. signif. be removed at the very least from the abstract. The following statement is particularly naff, considering the massive uncertainty in the model for the 18th century data:” However, there are 20 years during the reconstructed period (1784–1978) for which the 2007 ice extent value falls within the 95% confidence bounds and it thus cannot be considered to be statistically different. These years fall within 1786–1789 and 1923–1961.”
The mess that inappropriate statements of statistical significance in differences between apples and oranges leads to can be seen in the interminable analysis of statistical significance of this data elsewhere which, however interesting from a stats point of view, effectively stalls the discussion of the more meaningful questions we should be addressing; e.g. has Greenland likely entered a period of unprecedented melt, and what is the prognosis going forward? Those questions require consideration of all of the relevant data, in this case the evidence for enhanced glacial retreat now compared to then (as in mspelto’s analyses), the evidence that Arctic temperatures are greater (and likely to continue to rise) now than during the period of apparently high melt mid-20th century, and so on. e.g. while a statistician would argue (and does!), that the likelihood that 2007 (or 2010) melt index is larger than any during the 1920-1960 period, is actually quite small based simply on the numbers and their variances, a knowledgeable scientist together with a statistician would probably come to a conclusion more like: "The melt indices for 2007 and 2010 are each larger than any previous value in the historical reconstruction. Although the large uncertainty in the reconstruction data allows for the possibility that mid 20th century Greenland melt might have been as large or greater than contemporary melt years, the evidence that (i) Arctic temperatures have surpassed those of the mid-20th century, and (ii) glacier recession was less pronounced then compared to the contemporary period, does not support this interpretation." (P.S: only first part of this post addressed to Tom; parts 2. and 3. are me extemporizing...) -
dana1981 at 03:43 AM on 11 May 2011Lindzen Illusion #5: Internal Variability
KR -"I would really love to see a true skeptic argument against GHG driven global warming - one based on real-world data, with some theory behind it."
We'll present Lindzen's alternative to AGW in Lindzen Illusion #7, coming in a few days. I can't say it's based on real-world data though, as the post will show. -
KR at 03:20 AM on 11 May 2011Lindzen Illusion #5: Internal Variability
Albatross - Tamino has outdone himself this time. Simple enough that anyone can understand the data treatment, clear enough that even in dim light, under the worst conditions, after several stiff drinks, that it's still evident what's going on. Many skeptic arguments these days seem to consist of cherry picking and graphic presentation sins, primarily concerning the Ocean Heat Content (which is both one of the most important values and considered the easiest to disagree with). Personally I find this disappointing - same old same old. I would really love to see a true skeptic argument against GHG driven global warming - one based on real-world data, with some theory behind it. But these days I'm not holding my breath waiting. -
Albatross at 01:55 AM on 11 May 2011Lindzen Illusion #5: Internal Variability
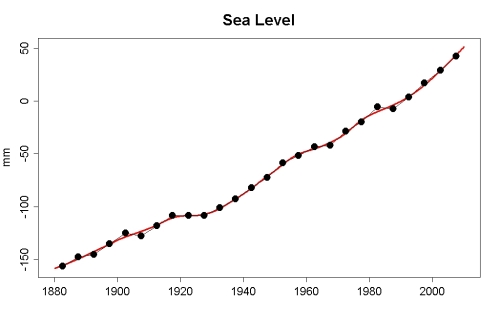
Tamino, has really outdone himself this time, totally eviscerating the BS (bad science) that the 'skeptics' are so fond of using to deceive. So simply, yet utterly devastating... All data below are 5-year averages to filter out most of the noise. Red line is the Lowess smooth of the original data. GISTEMP global surface air temperature anomalies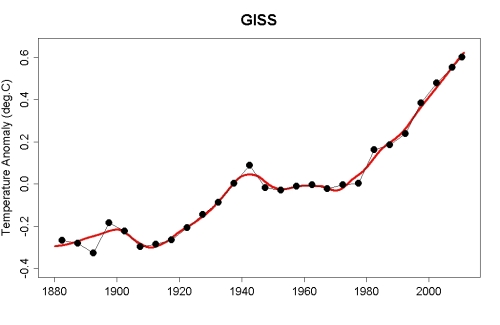 Global sea level rise
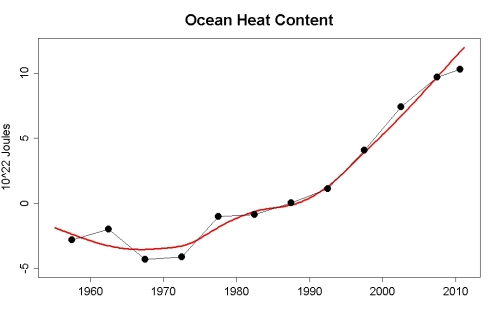
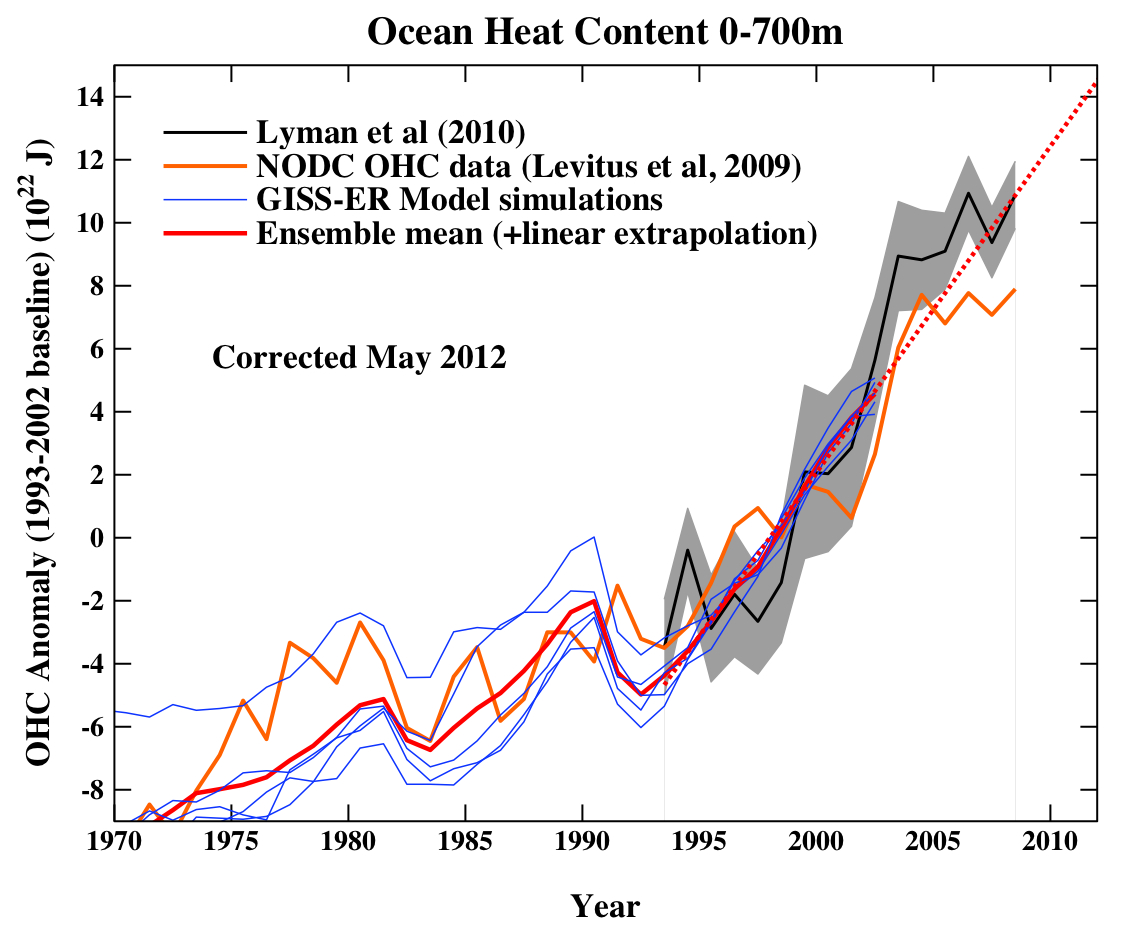
 0-700 m Oceanic Heat Content
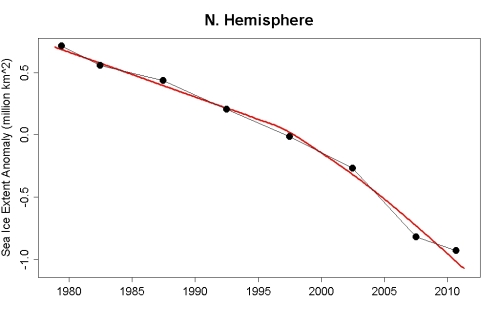
 (Minimum?) Arctic sea-ice extent anomaly
 Atmospheric CO2
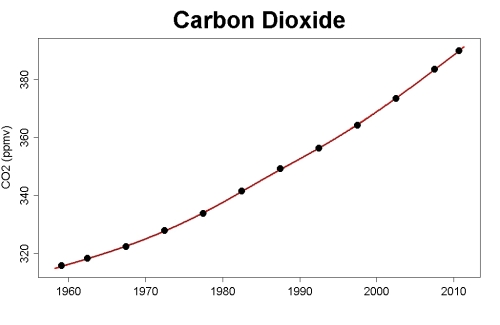 These are datasets that the 'skeptics' and deniers routinely try and manipulate, distort, cherry-pick and misrepresent in order to deceive and trick.
-
Albatross at 01:38 AM on 11 May 2011Lindzen Illusion #5: Internal Variability
Some thoughts on issues surrounding the Argo data by some eminent scientists-- caution, findings may upset "skeptics", contrarians and deniers of AGW. From Hansen et al. (2011), link provided below: "An alternative potentially accurate approach to measure Earth's energy imbalance is via changes in the ocean heat content, as has been argued for decades (Hansen et al., 1997) and as is now feasible with Argo data (Roemmich and Gilson, 2009; Von Schuckmann and Le Traon, 2011). This approach also has sampling and instrument calibration problems, but it has a fundamental advantage: it is based on absolute measurements of ocean temperature. As a result, the accuracy improves as the record length increases, and it is the average energy imbalance over years and decades that is of greatest interest. The error estimated by von Schuckmann and Le Traon (2011) for ocean heat uptake in the upper 2000 m of the ocean, ± 0.1 W/m2 for the ocean area or ± 0.07 W/m2 for the planetary energy imbalance, does not include an estimate for any remaining systematic calibration errors that may exist. At least some such errors are likely to exist, so continuing efforts to test the data and improve calibrations are needed. The Argo program needs to be continued and expanded to achieve further improvement and minimization of error." Also, "A verdict is provided by the ocean heat uptake found by von Schuckmann and Le Traon (2011), 0.42 W/m2 for 2005-2010, averaged over the planet. Adding the small terms for heat uptake in the deeper ocean, warming of the ground and atmosphere, and melting of ice, the net planetary energy imbalance exceeded +0.5 W/m2 during the solar minimum. This dominance of positive climate forcing during the solar minimum, and the consistency of the planet's energy imbalance with expectations based on estimated human-made climate forcing, together constitute a smoking gun, a fundamental verification that human-made climate forcing is the dominant forcing driving global climate change. Positive net forcing even during solar minimum assures that global warming will be continuing on decadal time scales." Go here for the Hansen et al. (2011) paper. Go here for the von Shuckmann and Le Traon (2011) paper. This is clearly yet another no win for Lindzen and Spencer. Shameful then that Lindzen insists on knowingly misleading the public, politicians and policy makers on the science. -
CBDunkerson at 01:35 AM on 11 May 2011Lindzen Illusion #5: Internal Variability
Even setting aside the ridiculous cherry picking involved in 'data since 2003'... that time period is clearly irrelevant when examining claims that the sharp increase in global air temperatures over the 20th century was caused by 'internal variability'. Heck, it isn't even a valid argument for a claim that 'atmospheric warming since 2003 has been caused by internal variability'... because both do still show warming. Warming at a slower rate than recent decades, but still warming... from both sources. Ergo, any 'internal variability' which is going on is getting overwhelmed by an external forcing. -
Tracking the energy from global warming
Tom @ 129, If the function goes below zero then the area added is negative. The key to Berenyi's analysis then is the choice of his baseline to calibrate the TOA measurements and convert them into absolute values rather than anomalies. He explained it in @109, though the justification wasn't very rigorous. -
dana1981 at 01:31 AM on 11 May 2011Lindzen Illusion #5: Internal Variability
Arkadiusz - variability is noise and trend is signal. You're arguing a strawman. Nobody disputes that internal variability accounts for much of the temperature variability. Indeed, I specifically discussed this in the article (see Figure 4)."Dana1981 - once again, your analysis is absolutely too poor in the reference"
The feeling is mutual. -
Berényi Péter at 01:24 AM on 11 May 2011Tracking the energy from global warming
#129 Tom Curtis at 23:42 PM on 10 May, 2011 if a curve has a positive slope (ie, it increases in value with increasing x), then for equal segments on the x axis, the definite integral must increase with increasing x. Conversely, with a negative slope the definite integral must decrease with increasing x. That's not so. The only thing that follows is if a curve has a positive slope, the definite integral is a convex function (for negative slope it is concave). Convex or concave functions can have either positive or negative slopes, or their slope may change sign (at most once). -
Byron Smith at 00:20 AM on 11 May 2011Upcoming 'Climate Change Denial' book launches in Sydney and Canberra
That's awesome to get Carr and Hewson behind this project. -
KR at 23:58 PM on 10 May 2011Lindzen Illusion #5: Internal Variability
Ken Lambert - I'm well aware of the data sources; ARGO started deployment around 2000, and XBT and other measurements preceded that. I'm always saddened by claims that "imperfect data" means "no data at all" - that's tantamount to claiming that without perfect knowledge we know nothing at all, which is a fallacy. XBT data has some serious calibration issues and requirements to extract meaningful data, and ongoing reanalysis of the data and collection methods have continually improved it. Nothing is perfect, but it's certainly not invalid data as you claim. It provides a great deal of data for determining a statistically relevant trend line. On the other hand, given the variation seen in even the ARGO data (+/-2*10^22 joules over 3 years or so) a 5-6 year average is not statistically significant. To wit: "the fallacy of incomplete evidence is the act of pointing to individual cases or data that seem to confirm a particular position, while ignoring a significant portion of related cases or data that may contradict that position" - classic cherry picking. -
Bob Lacatena at 23:57 PM on 10 May 2011Lindzen Illusion #6: Importance of Greenhouse Gases
14, Arkadiusz Semczyszak at 23:18 PM on 10 May, 2011 Lindzen's opinion is nothing close to what you quoted from Schmidt et al 2010. His opinion is that CO2 will be completely canceled by negative feedbacks from clouds. The difference between his stance, and Schmidt's objective comment, is vast. While Schmidt's comment is "certainly true," as you say... Lindzen's actual position is flimsy at best, and is in no way comparable to, or supported by, Schmidt's statement. -
Bob Lacatena at 23:53 PM on 10 May 2011Lindzen Illusion #6: Importance of Greenhouse Gases
13, NickWare, Where did you get your 9W/m2 number from (for CO2)? Just a cursory look shows that it's not a reasonable number. If a doubling will add 3.5 W/m2, we can estimate that if we were to halve CO2 down to 140 ppm, then the contribution would drop from 9 W/m2 to 5.5 W/m2. Another halving to 70 ppm would drop the CO2 contribution from 5.5 W/m2 to 2.0 W/m2. But at that point you can't even halve CO2 again, because the contribution goes negative. In theory, we should be able to halve CO2 about eight times (log2280 = 8.129). That would give us 8 * 3.5 = 28 W/m2... which is pretty close to the 30 W/m2 attributed by Schmidt et al 2010. Of course, that's probably not strictly correct (I imagine things must get complicated when levels of CO2 are fairly low)... but certainly 9 W/m2 at 280 ppm seems way off. Also, 241 W/m2 is the inbound/outbound component of the system. The radiative component which warms the planet above 255˚K is 155 W/m2 (per Schmidt 2010) which is added to that 241 W/m2. That is the component which must be divided among water vapor, clouds and CO2. -
Tom Curtis at 23:42 PM on 10 May 2011Tracking the energy from global warming
Berényi Péter @121:"Tom, you don't know what integral means, do you? Study it please and come back later."
I am no mathematician, at calculus tests the limits of my ability, but here goes ... The integral of a function is the area under the curve of that function. Given this, if a curve has a positive slope (ie, it increases in value with increasing x), then for equal segments on the x axis, the definite integral must increase with increasing x. Conversely, with a negative slope the definite integral must decrease with increasing x. As seen above, the graph of the deseasonalized net TOA anomaly has a positive trend from 2000 to 2008, and a negative trend from 2008 to 2009. Therefore the integral must increase on average over the period 2000 to 2008, and decrease from 2008 to 2009. You show the reverse. Of course, we don't need these mathematical meanderings to know that you have the sign wrong. All we need to notice is that you have mapped an increasing power coming in, to a decreasing energy received. According to you, receiving more Joules per second in 2008 than in 2000 in the climate system receiving fewer Joules per year in the year 2008 than it did in 2000. -
logicman at 23:40 PM on 10 May 2011Upcoming 'Climate Change Denial' book launches in Sydney and Canberra
#3 - Rob But what went ye out to see? A man clothed in soft raiment? :) -
Ken Lambert at 23:25 PM on 10 May 2011Lindzen Illusion #5: Internal Variability
KR#66 The bit you have failed to mention is the source of the OHC data. Before 2001-03 it was XBT and other measurements. After 2003 Argo was the main source. Argo is not perfect, but the spatial and numerical distribution of 3500 floats alone must give far greater accuracy to OHC measurement. Therefore the last 5-6 years is the most accurate meaurement - and before that - the measurement far less accurate - probably pretty useless in fact. So to claim that using the most accurate recent part of the the OHC record is 'cherry picking' - is simply wrong. Anyone who understands the first law can also make the leap to the critical point that any warming imbalance must show up somewhere in the Earth system as heat energy - over 90% stored in the oceans. OHC increase is a direct measure of TOA imbalance. Accurate measurement of OHC will make or break the AGW case. -
Arkadiusz Semczyszak at 23:18 PM on 10 May 2011Lindzen Illusion #6: Importance of Greenhouse Gases
For Lindzen opinions best fits the sentence with Schmidt et al., 2010.: “For instance, one cannot simply take the attribution to CO2 of the total greenhouse effect (20% of 33°C) and project that onto a 2 × CO2 scenario. That would exaggerate the no‐feedback impact of the extra CO2 while ignoring the role of feedbacks that might change the water vapor and clouds.” Oh yes, this is certainly true ... -
KR at 22:53 PM on 10 May 2011Lindzen Illusion #5: Internal Variability
Arkadiusz - "Ocean after 2003 - has stopped - at a fast rate - to collect energy." Tamino has some interesting things to say about 2003 and OHC, namely that using that date is cherry-picking. See the residual variation around the OHC trend line: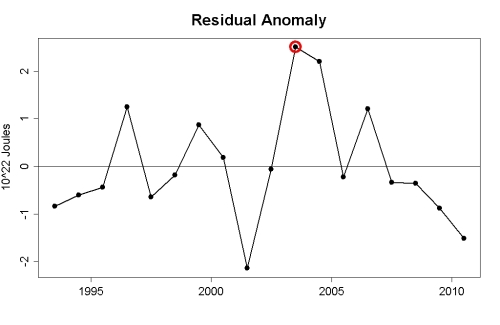 Why not pick 2002, which lies on the trend line, providing a more honest short term trend? Or 2001, which I could choose to "show" a short term (statistically completely insignificant, like trends since 2003) warming? But no, all skeptics arguing this seem to choose 2003, with the highest residual and hence least representative single sample possible. That is a distortion of the evidence.
5-6 years is far too short a time for statistically significant analysis - cherry-picking high residuals in the short term variation is a meaningless argument.
Why not pick 2002, which lies on the trend line, providing a more honest short term trend? Or 2001, which I could choose to "show" a short term (statistically completely insignificant, like trends since 2003) warming? But no, all skeptics arguing this seem to choose 2003, with the highest residual and hence least representative single sample possible. That is a distortion of the evidence.
5-6 years is far too short a time for statistically significant analysis - cherry-picking high residuals in the short term variation is a meaningless argument.
-
Rob Painting at 22:52 PM on 10 May 2011Upcoming 'Climate Change Denial' book launches in Sydney and Canberra
Can we expect a dapper set of new attire at the launches? -
NickWare at 22:50 PM on 10 May 2011Lindzen Illusion #6: Importance of Greenhouse Gases
I am baffled by the claim that "Schmidt et al. estimate the global mean longwave radiative flux from CO2 at approximately 30 Watts per square meter (W/m2), clouds at 40 W/m2, and water vapor at 80 W/m2". To what concentration of CO2 does this refer? For the past 20 years I've thought that we have about 240W/m2 to power the climate: H2O in its various forms contributing about 180W/m2 and 280ppm CO2 about 9W/m2. Going up to 560ppm should contribute an extra 3.5W/m2. The temperature of the Earth's surface is around 285K, so to a crude first approximation the temperature rise involving a doubling of the natural CO2 level will be 3.5 x 285 / 240 = 4.2C which is about what the IPCC claim. 30W/m2?? What is going on? -
Ken Lambert at 22:50 PM on 10 May 2011Lindzen Illusion #3 and Christy Crock #5: Opposing Climate Solutions
scaddenp #106 The shaky isles are certainly nicer than the Tibetan Plateau, but the wind is probably as prime. Relevant quotation from your reference: "Because of NZ’s exceptional wind resource, wind farms in New Zealand operate at a capacity factor of around 40%, which is almost twice the global average." Which puts the global average at about 20%. I said 12 - 25%, which is in the ballpark. The 12% relates to recent experience in Victoria - which is not prime wind territory. -
Arkadiusz Semczyszak at 22:36 PM on 10 May 2011Lindzen Illusion #6: Importance of Greenhouse Gases
@Citizen99 “... the amount of water vapor is a function ONLY of the temperature ...” “... There is no "natural" source of water vapor that can be suggested as an alternative source of the last century's warming, because there is an ample inventory of liquid water, just waiting for some OTHER forcing to send it up into the atmosphere. ...” Water vapor, however, is - in comparison with the CO2 - differently "placed" in the atmosphere. And it is influenced by very different factors - such as circulation: the atmosphere-ocean. Temperature determines the amount of water vapor in the atmosphere - I agree - but the same amount of water vapor in the atmosphere - depending on the relative humidity - that cause other RF. A very simple model for the water vapour feedback on climate change, Ingram, 2010.: „... the heat radiated by the climate system is a function primarily of relative humidity, not temperature.” Its effect on a real accumulation of heat - in the climate system - can be so much greater than that resulting from the comparison the direct RF water vapor - of direct RF CO2. Water vapor - in fact-so it can be more important than the result of simple calculations. “... atmospheric carbon dioxide therefore qualifies as the principal control knob that governs the temperature of Earth.” ... but only with water vapor. Its direct impact - doubling - to max 1.1-1.2 degrees C. And we do not know exactly “how it works” water vapor. To quote again Ingram, 2010.:: “A substantial positive feedback [on increase CO2] on climate change is then to be expected, and an approximate doubling is well established numerically. However, a physical explanation for the size of this effect is conspicuously lacking.” And widely Lindzen's views - precisely - are shown (I think) here. -
Bob Lacatena at 22:23 PM on 10 May 2011Lindzen Illusion #5: Internal Variability
63, Arkadiusz Semczyszak at 20:25 PM on 10 May, 2011Suddenly the sun and volcanoes are important?
This is an unnecessarily caustic statement. No, they're not "suddenly" important, nor were they ever unimportant. They're part of the system. They aren't driving current climate change, but they are important factors (and I'm sure you know this, and the comment was foolish of you to make).Once again I remind the conclusions of the paper:Climate change and solar variability: What's new under the Sun?, Bard and Frank, 2006...
Bard 2006 was full of non-information and non-comments and non-conclusions. The paper is not worth citing for anything, because it proved absolutely nothing. The conclusion is a collection of but-what-ifs:Unfortunately, precise data are limited to the satellite era... Conflicting views exist... ...may contribute to answering... Solar records are intrinsically incomplete for periods prior to the past three decades... It appears that solar fluctuations were involved... The currently available reconstructions of geomagnetic field intensity and cosmogenic nuclide production are still not sufficiently precise to extract a meaningful solar component... ...we await more reliable and longer records...
The paper proves and says nothing. Citing a paper that says "look, it still might be the sun" (I'm paraphrasing, of course) is hardly a substantive argument. Rather than dismantle all of your references, I think I should point out that being able to compile a gish-gallop of citations of papers does not constitute a valid argument. There are any number of "skeptical" papers, or skeptical sounding comments in real science, that you could draw from to "prove" that Trenberth is actually an alien from the Betelgeuse star system, and is bent on transforming the earth to make it habitable for colonization by his species. The fact is that current climate science has pretty much proven that solar variations have comparatively little to do with current warming, while greenhouse gases do. Your position is pretty well summed up by this comment of yours:Here I disagree with this sentence: ” This warming is largely attributable to greenhouse-gas forcing.”
The point being the you disagree, and you can find lots of words published by people who share your opinion... but have little in the way of facts or substantive arguments to support that position. Come back with a paper that actually proves something. Find a paper that says something other than "it might be" or "it could be" or "we don't know." And yet, at the same time, you are able to completely ignore the vast body of scientific evidence that points towards the effects of greenhouse gases. This is hardly a scientific approach. In your own words:There is no place for his dishonesty.
On that point, at least, we agree. Also, please refrain from the use of all caps, especially in conjunction with a bold font. It's offensive. The words carry the content and do not need to be shouted. -
CBDunkerson at 22:16 PM on 10 May 2011Lindzen Illusion #5: Internal Variability
It is interesting that the 'internal variability' argument has now shifted to the deep ocean... the last remaining large area of the Earth for which we do not have significant data. Purkey & Johnson 2010 shows warming even there, but it is the first real effort at analyzing temperature trends for water that deep and only covered a small portion of the deep ocean for a limited time frame. In short, all available evidence indicates that the deep oceans are warming too, but that evidence is limited enough that Lindzen can apparently still hold out hope that it is wrong. Yet what plausible explanation would there be for a massive transfer of heat from the ocean depths to waters closer to the surface and the atmosphere over the course of the past century? Lindzen doesn't even attempt to provide one. Further, if the atmospheric warming were being caused by heat transfer from the deep oceans it would not show the greater warming at night than during the day which has been observed. Ditto stratospheric cooling. So we have a hypothesis contradicted by data from multiple lines of evidence and not supported by any data at all... yet still they cling to it. -
Arkadiusz Semczyszak at 20:25 PM on 10 May 2011Lindzen Illusion #5: Internal Variability
@KR. (and evidence of what writes johnny) “The energy accumulation in atmosphere, surface, and primarily ocean over the last 150 years or so is large and sustained ...” Ocean after 2003 - has stopped - at a fast rate - to collect energy. Change 1993-2003 is “a swept” - circa 90% growth this year 1993-2003 - the period of phase change (cold - hot) in the AMO + course ENSO (most of the energy is absorbed by the ocean in the tropics ). Hansen, Sato and Kharecha, ( Earth's Energy Imbalance and Implications, 2011.) explained it this way: “Aerosol climate forcing today is inferred to be ‒1.6 ± 0.3 W/m2, implying substantial aerosol indirect climate forcing via cloud changes. Continued failure to quantify the specific origins of this large forcing is untenable, as knowledge of changing aerosol effects is needed to understand future climate change. A recent decrease in ocean heat uptake was caused by a delayed rebound effect from Mount Pinatubo aerosols and a deep prolonged solar minimum.” Suddenly the sun and volcanoes are important? However, this is probably just the heat stable phase of the AMO and ENSO - internal variability ... Once again I remind the conclusions of the paper:Climate change and solar variability: What's new under the Sun?, Bard and Frank, 2006.: “Overall, the role of solar activity in climate changes — such as the Quaternary glaciations or the present global warming — remains unproven and most probably represents a second-order effect.” Cyclic variation and solar forcing of Holocene climate in the Alaskan subarctic, Hu et al., 2003.: “Our results imply that SMALL variations in solar irradiance induced pronounced cyclic changes in northern high-latitude environments. They also provide evidence that centennial-scale shifts in the Holocene climate were similar between the subpolar regions of the North Atlantic and North Pacific, possibly because of Sun-ocean-climate linkages.” Response of Norwegian Sea temperature to solar forcing since 1000 A.D., Sejrup,2010.: “The observed ocean temperature response is larger than expected based on simple thermodynamic considerations, indicating that there is dynamical response of the high‐latitude ocean to the Sun. [...]” “dynamical ...” - modulation of “internal variability”? I agree that external factors were most important in the last 500 years. Influence of human and natural forcing on European seasonal temperatures, Hegerl et al., 2011.: “In particular, we find that external forcing contributes significantly ( p <5 % ) to the reconstructed long-term variability of winter and spring temperatures and that it is responsible for a best guess of 75 % of the observed winter warming since the late seventeenth century. Summer temperatures show detectable ( p <5 % ) interdecadal variations in response to external forcing before 1900 only.” Here I disagree with this sentence: ” This warming is largely attributable to greenhouse-gas forcing.” In this paper is the conclusion that the volcanoes warm up - like a fingerprint - as A. GHGs - make the winters are warmer: “Finally, throughout the record we detect highly significant summer cooling and significant winter warming following volcanic eruptions. [!!!]” External forcing as a metronome for Atlantic multidecadal variability, Otterå et al., 2010.: “We find that volcanoes play a particularly important part in the phasing of the multidecadal variability through their direct influence on tropical sea-surface temperatures, on the leading mode of northern-hemisphere atmosphere circulation and on the Atlantic thermohaline circulation.” And the Sun (with a lag - "a second-order effect") affects the volcanic activity About possible influence of solar activity upon seismic and volcanic activities: long-term forecast, Khain & Khalilov, 2008. - see Pic. 5 and Pic. 6 (influence “a second-order effect”) - strict correlation. Volcanoes affect the ozone. And ozone has been discussed on this website a few days ago: "The ozone hole is not even mentioned in the summary for policymakers issued with the last IPCC report," noted Lorenzo M. Polvani, Professor of Applied Mathematics and of Earth and Environmental Sciences, Senior Research Scientist at the Lamont-Doherty Earth Observatory, and co-author of the paper. "We show in this study that it has large and far-reaching impacts. The ozone hole is a big player in the climate system!" "It's really amazing that the ozone hole, located so high up in the atmosphere over Antarctica, can have an impact all the way to the tropics and affect rainfall there - it's just like a domino effect," said Sarah Kang, Postdoctoral Research Scientist in Columbia Engineering's Department of Applied Physics and Applied Mathematics and lead author of the paper.” Testing solar forcing of pervasive Holocene climate cycles, Turney et al., 2005. : “The cycles, however, ARE NOT COHERENT WITH CHANGES IN SOLAR ACTIVITY (both being on the same absolute timescale), indicating that Holocene North Atlantic climate variability at the millennial and centennial scale IS NOT DRIVEN BY A LINEAR RESPONSE to changes in solar activity.” Gray et al., 2010. once again: “In discussion of solar forcing and global change, it is important to note that the climate system has a chaotic element, so the climate response to solar (and OTHER FORCINGS) can be attributed partly to forced variability and partly to INTERNAL VARIABILITY.” In addition: Solar forcing of the terrestrial atmosphere, Dudok de Wit & Watermann, 2009.: “... the main mechanisms by which the Sun affects the Earth are not the most immediate ones in terms of energetic criteria.” “- feedback mechanisms are not sufficiently well understood and positive feedback may be much stronger than expected ...” “According to the IPCC, over the last century, this impact has most likely been small as compared to anthropogenic effects. There are several important working fronts as far as the Sun–Earth connection is concerned. Most GCM whose development started in the lower atmosphere still largely ignore the upper part of the atmosphere on which solar variability has the largest impact.” Internal variability. According to Lindzen - internal variability is decisive - mainly through regional influence - globally decisive. The role of any external force (not just GHG) emissions - is - according to him - a very small minority, initiating change. I do not agree with him (The Sun is very important -"second-order effect"), but I think he does have "strong arguments" - in support of his claim. There is no place for his dishonesty. Dana1981 - once again, your analysis is absolutely too poor in the reference ... -
Arkadiusz Semczyszak at 20:16 PM on 10 May 2011Lindzen Illusion #5: Internal Variability
@Dana1981 - Even if you're right, "mercilessly" simplifies. A significant component of unforced multidecadal variability in the recent acceleration of global warming. DelSole, Tippett and Shukla, 2010. There is a sentence: “While the IMP can contribute significantly to trends for periods of 30 yr or shorter, it cannot account for the 0.8°C warming that has been observed in the twentieth-century spatially averaged SST.” ... but nevertheless (also): “The warming and cooling of the IMP matches that of the Atlantic multidecadal oscillation and is of sufficient amplitude to explain the acceleration in warming during 1977–2008 as compared to 1946–77 ...” In the past, even as big a change as the passage MCA - LIA may be caused by - “by INTERNAL VARIABILITY” Medieval Climate Anomaly to Little Ice Age transition as simulated by current climate models, González-Rouco et al., 2011.: “Therefore, under both high and low TSI change scenarios, it is possible that the MCA–LIA reconstructed anomalies would have been largely influenced by INTERNAL VARIABILITY. [...]” INTERNAL VARIABILITY is not only a redistribution of energy absorbed by the ocean, it is also a change in ocean circulation or strengthening - weakening - AMOC, ENSO, local circulation. It has an effect on the accumulation of energy by the ocean - change of place accumulation - the increase (and by changing the quantity of GHGs - water vapor, methane, CO2 - and the clouds - the spatial resolution). Today we see that part of the ocean, energy is lost - the obvious influence of ocean circulation. ... And for those circulations influences INTERNAL VARIABILITY. Solar Influences on Climate, Gray et al., 2010. : “... anthropogenic forcings are needed to explain the observations after about 1975. It should be noted that this is true globally as well as in many, but not all, regions, indicating that internal variability is larger in some regions than in others and also is larger than in the global means.” ... Top Of the Atmosphere (TOA): Estimations of climate sensitivity based on top-of-atmosphere radiation imbalance, Lin et al., 2009. . : “Currently, there is a lack of high accuracy measurements of TOA radiation imbalance.” “The range of feedback coefficient is determined by climate system memory. The longer the memory, the stronger the positive feedback. The estimated time constant of the climate is large (70-120 years) mainly owing to the deep ocean heat transport, implying that the system may be not in an equilibrium state under the external forcing during the industrial era.” “Furthermore, the climate feedbacks should include not only short-term (including instantaneous) responses but also longer time scale (or historical) responses because the climate generally has certain memories, which are omitted in these energy balance models.” “The range of feedback coefficient is determined by climate system memory. The longer the memory, the stronger the positive feedback. The estimated time constant of the climate is large (70 ~120 years) mainly owing to the deep ocean heat transport, implying that the system may be not in an equilibrium state under the external forcing during the industrial era.” @ adelady 1. The sun's been a bit cooler the last few years. And so what? The sun has always acted with considerable delay (probably many, many times I will have to resemble). Sub-Milankovitch solar forcing of past climates: Mid and late Holocene perspectives, Helama et al., 2010.: “Thus, the warmer and cooler paleotemperatures during the Medieval Climate Anomaly and Little Ice Age were better explained by solar variations on a millennial rather than bimillennial scale. The observed variations may have occurred in association with internal climate amplification [...] (likely, thermohaline circulation and El Niño–Southern Oscillation activity). THE NEAR-CENTENNIAL DELAY in climate in responding to sunspots indicates that the Sun's influence on climate arising from the current episode of high sunspot numbers may not yet have manifested itself fully in climate trends.” “... 70 ~120 years ...”, “... NEAR-CENTENNIAL DELAY ...” - After that time the climate will respond to the fact that: “The sun's been a bit cooler the last few years ...”, NO EARLIER !!! -
y-not at 18:46 PM on 10 May 2011Upcoming 'Climate Change Denial' book launches in Sydney and Canberra
The Vatican is suddenly calling for action on Climate Change, maybe Tony Abbott will hear that call. -
renemor at 18:41 PM on 10 May 2011Upcoming 'Climate Change Denial' book launches in Sydney and Canberra
Well, I already obtained it in Belgium, and read it eagerly ! I will keep recommending your book , which is encouraging in showing that denial may be managed by reason and faith in life. Thank you for this wide-encompassing treatment of the subject. It also encourages me in going to several of your references frequently cited in book. -
Tom Curtis at 18:01 PM on 10 May 2011Lindzen Illusion #6: Importance of Greenhouse Gases
Camburn @8, the model used by Schmidt et al is a Global Circulation Model configurable to twenty or twenty three atmospheric layers. Describing it as showing "what may happen in the atmosphere given slab role" is a gross distortion, and one for which you had no basis in claiming it. Just because a sound bite makes you comfortable in dismissing the science is no reason for you to utter it; and should you do so, our opinion of you will be revised down accordingly. -
Citizen99 at 14:43 PM on 10 May 2011Lindzen Illusion #6: Importance of Greenhouse Gases
It is pointless to discuss what percentage of the greenhouse effect is caused by CO2 relative to water vapor, because the simple fact is that the amount of water vapor is a function ONLY of the temperature, and of course the temperature is sensitive to the amount of water vapor. It is a recursive relationship. There is no "natural" source of water vapor that can be suggested as an alternative source of the last century's warming, because there is an ample inventory of liquid water, just waiting for some OTHER forcing to send it up into the atmosphere. That would be CO2 and CH4 from fossil fuel combustion. This argument of Lindzen's is a red herring, which as a physicist he knows very well. Only non-condensible IR-absorbing gases such as CO2 and CH4 can force the temperature upward, resulting in a higher vapor pressure of water and thus more water vapor, which amplifies the effect. -
scaddenp at 14:04 PM on 10 May 2011Lindzen Illusion #3 and Christy Crock #5: Opposing Climate Solutions
"Which studies are these? From the top of the Tibetan Plateau? The experience in Victoria is as low as 12.5% availability. " Whereas a trial one in our Capital is available 95% and overall I think our wind capacity is 41% (90-95% availability). And no, I don't think we are the Tibetan Plateau. Reference -
dana1981 at 13:47 PM on 10 May 2011Lindzen Illusion #6: Importance of Greenhouse Gases
Agnostic - no, we haven't invited Lindzen to respond. Camburn - we're not talking about climate sensitivity here. Try Lindzen Illusion #4. -
Ken Lambert at 13:38 PM on 10 May 2011Lindzen Illusion #3 and Christy Crock #5: Opposing Climate Solutions
"Seriously Ken, if you're not even going to *try* & be honest, then there is absolutely no point in even having a discussion with you." Accusations of dishonesty are explicitly against the comments policy. Are you exempt from this policy Marcus? Who is against Geothermal?, Tide of Wave generators? Many of these things work - just too expensively to be a viable economic alternative. Tell us their cost and we will tell you if they are starters of not. Elsewhere I have identified Geothermal as a 24/7 alternative base load source. Coupled with things like solar cooling and a pentane cycle - Geothermal is a contender. Trial plants are underway. Problems of scaling up, capacity and distance from loads have to be addressed to get decent cost projections. "Even in your example, that still represents an almost 300% mark-up. So either someone is gouging, or the costs of long-distance transmission & distribution are significantly higher than people such as yourself want to admit." Please tell us what price you will **buy** your 'renewables'. "Second of all, you keep citing low availability for wind power, when every official study shows a capacity factor of around 30% to 40%." Which studies are these? From the top of the Tibetan Plateau? The experience in Victoria is as low as 12.5% availability. -
Albatross at 13:30 PM on 10 May 2011Tracking the energy from global warming
KR and scaddenp, No worries. Yes, Hansen et al. (2011) is quite the paper, fantastic overview of the science. The von Shuckmann and La Traon paper is also impressive-- decimates Douglass and Knox's extremely poor effort.Response:[DB] BTW, Tamino has a real nice post on 5-year trends; tangential to this discussion.
-
scaddenp at 11:22 AM on 10 May 2011Tracking the energy from global warming
The Schuckmann and La Traon paper referenced is also pretty pertinent though note that it is also in press. -
Marcus at 11:06 AM on 10 May 2011Lindzen Illusion #3 and Christy Crock #5: Opposing Climate Solutions
Seriously Ken, if you're not even going to *try* & be honest, then there is absolutely no point in even having a discussion with you. First up, the ability to store energy-technology which is already available & relatively cheap-will actually improve the number of kw-h of electricity that renewable power can generate over its lifetime. Yes it will increase the capital cost, but the life-cycle cost will either be the same or possibly even lower. Second of all, you keep citing low availability for wind power, when every official study shows a capacity factor of around 30% to 40%. With storage, that capacity factor can be almost doubled. I've also pointed out that back-up does *not* have to come from coal or natural gas. Bio-gas is generated as a by-product of our everyday lives & could be easily burned to produce electricity in those rare instances when either solar or wind are not available. Also, why do you continue to ignore energy sources like tidal streams & geo-thermal, which are in no way hostage to the vagaries of weather systems, or to fluctuating fuel prices? Lastly, whether you choose to accept it or not, retail electricity costs in my area are close to 30c/kw-h. Maybe as a business user you get a discount, but you're really comparing apples & oranges. Either way, it still represents a massive mark up, given that generation costs are only 6c/kw-h. Even in your example, that still represents an almost 300% mark-up. So either someone is gouging, or the costs of long-distance transmission & distribution are significantly higher than people such as yourself want to admit. So my ultimate point is that, no matter how much you choose to ignore it, we can substitute a large proportion of our current coal-fired electricity use with renewable energy, especially if coupled with energy efficiency measures. -
Camburn at 10:59 AM on 10 May 2011Lindzen Illusion #6: Importance of Greenhouse Gases
Schmidt etal: [34] We conclude that, given the uncertainties, that water vapor is responsible for just over half, clouds around a quarter and CO2 about a fifth of the present‐day total greenhouse effect. Given that the attribution is closer to 20% than 2%, it might make more intuitive sense that changes in CO2 could be important for climate change. Nonetheless, climate sensitivity can only be properly assessed from examining changes in climate, not from the mean climatology alone [Annan and Hargreaves, 2006]. What this paper shows is what may happen in the atmosphere given the slab role. What it does not show is what the actual contributions of h20 vapor, clouds etc will have. This is a stab at sensitivity using a poor model to boot. -
Michael Hauber at 10:48 AM on 10 May 2011Why 450 ppm is not a safe target
I do not agree with picking a number such as 450ppm and declaring <450 is safe and >450 is dangerous. I do agree with Hansen that 350 is much more like a reasonable 'safe' number, but rather than consider that we are already in 'dangerous' territory, and risk some people concluding 'OMG we are ruined', I would prefer a more gradual approach, and consider that above 350 is 'risky' rather than 'dangerous'. By this I expect that for levels of warming up to about 2 degrees things will probably turn out quite ok. There will be some problems, but also some benefits, and nothing that we can't solve. But it is still not safe as we don't know for sure what can happen and there is always the chance something will go unexpectedly wrong and blow up bi time in our face (abrupt climate change, severe weather, methane clathrates etc) Like cigarettes. A few cigarettes probably won't kill you. But its just not safe and you want to reduce the number of cigarettes as much as possible as soon as possible. And trying to find a dangerous level foor Co2 is like stating that smoking more than 10k in a lifetime is dangerous, and getting all depressed because you've already smoked 12k so why bother quitting.... (and of course not like cigarrets because Co2 has benefits and is absolutely required for life in small amounts)
Prev 1739 1740 1741 1742 1743 1744 1745 1746 1747 1748 1749 1750 1751 1752 1753 1754 Next


