


 Arguments


Recent Comments
Prev 1764 1765 1766 1767 1768 1769 1770 1771 1772 1773 1774 1775 1776 1777 1778 1779 Next
Comments 88551 to 88600:
-
Gilles at 03:23 AM on 15 April 2011How I lived through a carbon tax and survived to tell the tale
it would really be that simple if the carbon tax were much more than the natural rise of prices - what i'm arguing is that it is not true, and so that there is no reasonable situation where the natural rise would be inefficient to curtail demand, whereas a carbon tax would be efficient - and the demand side is totally unaware of where the money is going, in a tax or in FF producer's pocket. There may be a difference for the producers, but the amount of the tax would be nevertheless negligible with respect to the price rise necessary to make non conventional profitable. Is it really that difficult ? -
Dr. Jay Cadbury, phd. at 03:21 AM on 15 April 2011Christy Crock #3: Internal Variability
"As we will see here, this statement is simply false. Natural variability cannot account for the large and rapid warming we've observed over the past century, and particularly the past 40 years." Natural variability can easily account for recent warming because it has been much warmer in the past. I would also argue the warming we have seen is small and has not been rapid. Could someone please provide the change in GAT from 1850-present?Response:[DB] You can find answers to your questions by looking at the Skeptics arguments by Taxonomy. These specifically might be of use:
It warmed just as fast in 1860-1880 and 1910-1940
Data source for GAT (land is shown but you can re-run with both; data only since 1880):
-
Gilles at 03:16 AM on 15 April 2011Christy Crock #3: Internal Variability
sorry I mixed up with the other topics on Trenberth's sentence :) -
Gilles at 03:12 AM on 15 April 2011Christy Crock #3: Internal Variability
DM :concerning " If all of the model runs agree on the long term hindcast, that is reasonable grounds to think it is probably forcings," - It's slightly OT in my sense, but it is an important point. It is not because all models agree together that they're proved to be true, especially if they share systematic errors or weaknesses. Taking again solar models, they all agree that an 11 -years activity cycle doesn't exist ! but in this respect, they're just all wrong. Now as you say, models can be disproved. In that sense, observation that surface oceans are *not* warming for 6 years disproves "something" (hence the reaction of Dr Trenberth) : it disproves the idea that there is a 0.9 W/m2 imbalance that is stored in upper layers of oceans. So actually it's kind of good news to be able to make this observation, because we can try to improve the model. Now I'm simply reminding that an open possibility is that the missing heat is stored in deep ocean, and another open possibility is that the 0.9 W/m2 is wrong - which wouldn't be possible if we had an independent , reliable measurement of TSI and TOA budget, showing that this 0.9 W/m2 is certain. My impression is that by reading the OP, one could have the impression that the second possibility is excluded because we would know for sure that the 0.9 W/m2 imbalance exists - however, as Dr Trenberth himself reminds us, this is not the case - we don't have any reliable , independent measurement of this 0.9 W/m2 imbalance. Chris G. #43 : you simply misunderstood what I'm saying - read again carefully, I'm just trying to remind carefully what we know and what we don't know for sure. -
Dikran Marsupial at 02:41 AM on 15 April 2011Christy Crock #3: Internal Variability
Chris G@43 That may not be what Gilles intends to convey, but it seems a reasonable interpretation of what he actually writes on most of the threads to which he has contributed. Second language issue perhaps? -
Chris G at 02:39 AM on 15 April 2011Christy Crock #3: Internal Variability
I think I can summarize the arguments used by Gille: We do not know everything; therefore, we know nothing. A is true, but the premise that A->B is false. -
logicman at 02:38 AM on 15 April 2011Arctic Ice March 2011
#234 - Gilles Jumping the gun a bit, aren't you? My error was nothing to do with natural variability. It was an error of observation leading to an error in the application of knowledge of materials science to that specific chunk of ice in Nares Strait. -
Dikran Marsupial at 02:33 AM on 15 April 2011Monckton Myth #16: Bizarro World Sea Level
BP@56 Read the caption, it says "The values of NOAA’s 159 tide gauge stations indicate that they range from uplifted areas to subsiding areas". In other words the only justification they have for asserting that the uplifted areas are uplifted and the subsiding areas are subsiding are the tide gauge readings! LOL! So how would you explain that you get a different story if you select tide gauges that are in geologically stable regions (and hence neither uplifted nor subsiding Click on the figure for the details. Using those tide gauges where you can rule out uplift or subsidence, you get an rate of rise very similar to the satelite data, and much higher than the SPPI figure.
Yes, I know the figure is from Wikipedia, but the data is from PSMSL, the same as Moncktons, and Wikipedia is certainly no less reliable a source than SPPI.
BTW, I also found an answer to Daniel Maris's query about the tide guages on jetties that might be subsiding. Well funnily enough the scientists know that and measure any subsidence with reference to a reference point on land. See here for details. Note the say that post glacial rebound etc. makes things a bit more difficult; however the selection of tideguages in the diagram I gave controls for that, whereas the one used by Monckton obviously doesn't.
I'll investigate the PSMSL data for myself when I have a moment to resolve the remaining questions; but given that Monckton has arbitrarily decided that gauges in regions with a value over some arbitrary threshold must be subsiding based on no other evidence, I think I'll view his opinion with some skepticism.
Click on the figure for the details. Using those tide gauges where you can rule out uplift or subsidence, you get an rate of rise very similar to the satelite data, and much higher than the SPPI figure.
Yes, I know the figure is from Wikipedia, but the data is from PSMSL, the same as Moncktons, and Wikipedia is certainly no less reliable a source than SPPI.
BTW, I also found an answer to Daniel Maris's query about the tide guages on jetties that might be subsiding. Well funnily enough the scientists know that and measure any subsidence with reference to a reference point on land. See here for details. Note the say that post glacial rebound etc. makes things a bit more difficult; however the selection of tideguages in the diagram I gave controls for that, whereas the one used by Monckton obviously doesn't.
I'll investigate the PSMSL data for myself when I have a moment to resolve the remaining questions; but given that Monckton has arbitrarily decided that gauges in regions with a value over some arbitrary threshold must be subsiding based on no other evidence, I think I'll view his opinion with some skepticism.
-
Berényi Péter at 01:54 AM on 15 April 2011Monckton Myth #16: Bizarro World Sea Level
"It boggles the mind that Monckton and the "S"PPI think they can convince people that sea level has dropped since 1950 based on nothing more than their own unsubstantiated claims and blatantly doctored graphs which are completely contradicted by the actual observational data." That's because you have omitted the explanation. The claim can be checked using PSMSL data.
-
Dan Moutal at 01:50 AM on 15 April 2011How I lived through a carbon tax and survived to tell the tale
The summary of the summary: A carbon tax makes the dirtiest fuels the most expensive. This encourages the use of cleaner fuels and allows the free market to find and develop substitutes for the dirty fuels. It really is that simple. -
Phila at 01:49 AM on 15 April 2011Christy Crock #3: Internal Variability
I suspect that if the models supported Gilles' preconceived notions, he'd have absolutely no problem with them. Or rather, no need to invent problems with them. -
Dan Moutal at 01:47 AM on 15 April 2011How I lived through a carbon tax and survived to tell the tale
Bottom line. Left to BAU eventually prices will get high enough to lower demand and slow down emissions. With oil I admit you have half a point. The era of cheap oil is over and transportation technology is beginning to move away from FF use. Obviously there is still a long way to go but there is progress on this front. Emissions due to oil will still likely go up as demand continues to increase, but if gas prices continue on their upwards trajectory we can expect demands to begin to slow as well. Will that happen fast enough? That remains to be seen. My guess is no, hence only half a point. But as mentioned before oil is only part of the problem. Coal is responsible for more emissions than oil and there is still a whole lot of it left. It will remain artificially cheap thanks to the fact that the most significant costs associated with the burning of coal are externalized. A whole lot of coal needs to be burned before prices rise enough to make a dent in demand. A carbon tax prevents people from switching from mildly dirty fuels like oil to very dirty fuels like coal. -
Albatross at 01:27 AM on 15 April 2011More wind, bigger waves, changing marine ecosystems
BP @5, You may have a point. But having a closer look at the trends for 1991-2008 form the paper, I could only find one very small area in the tropics (east of Indonesia) with a obvious decrease in wind speed. I wonder if the Young et al. data could be used to track tropical storms and tropical cyclones and to generate an ACE time series? -
pbjamm at 01:17 AM on 15 April 2011Monckton Myth #16: Bizarro World Sea Level
daniel maris@47 "Presumably you could sum things up..." "I've never claimed to be able to take part in a peer review of papers in this subject area." "What do I make of the chart? Well I said I am not competent to make sense of it..." Yet you apparently feel confident enough to reject the informed opinions of those who do read the peer reviewed papers (a group I also am not a part of). I am sure DM could sum up the evidence against the Morner photo, but why would you believe him? -
Alexandre at 01:07 AM on 15 April 2011Christy Crock #3: Internal Variability
re cloa513 I think I've read this somewhere: "Skeptics vigorously criticise any evidence that supports man-made global warming and yet uncritically embrace any argument, op-ed piece, blog or study that refutes global warming." -
Albatross at 01:05 AM on 15 April 2011Christy Crock #3: Internal Variability
Arkadiusz @33, Thanks, climate scientists know very well that there exists such a thing as natural or internal climate variability. But you are missing the point in your post. The papers that you cite speak to a period earlier in the Holocene before anthropogenic GHG forcing. Christy was specifically referring to "recent" warming when anthropogenic forcing has played a notable/significant role in modulating global temperature trends. So I am afraid that your papers are irrelevant to this discussion. Additionally,The NIPCC is not a credible source of scientific information. It is propaganda and nothing more than a elaborate misinformation document. -
Dan Moutal at 01:02 AM on 15 April 2011How I lived through a carbon tax and survived to tell the tale
@ Gilles "you didn't explain why the demand would keep increasing!" Seriously? Lets see, we have a growing population, and an emerging middle class places like in China and India. That pretty much guarantees that demand for energy is only going to go up. Hence the need to make the dirty energy more expensive than the clean stuff. Otherwise we should expect more CO2 emissions as people shift from oil, to dirtier (but eventually cheaper) sources of FF. -
Berényi Péter at 00:59 AM on 15 April 2011More wind, bigger waves, changing marine ecosystems
Hey, any idea why high latitude storminess is increasing while it's decreasing in the tropics?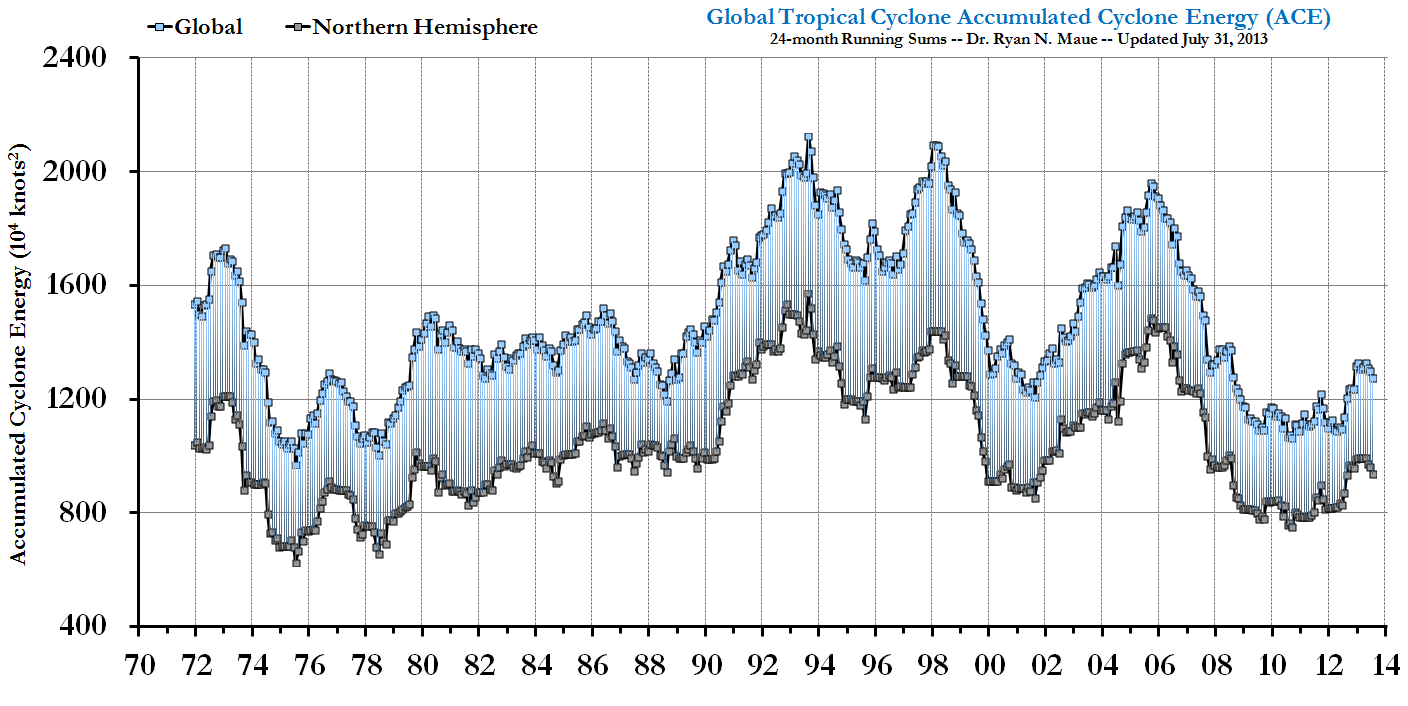
-
mspelto at 00:58 AM on 15 April 2011Zebras? In Greenland? Really?
Back to Jakobshavn. Neven has posted some 2011 spring fjord observations. This is the real value of having more sharp eyes perusing the images, asking questions, making observations. -
Albatross at 00:51 AM on 15 April 2011Christy Crock #3: Internal Variability
Cloa513, Great, first david rose, and now a Australian talk show. Your link is irrelevant to the topic at hand. Also, he contradicts Christy, saying that recent changes are small-- Christy suggests that the changes (from a natural climate variability) are quite large quite large-- almost 0.9 C. Dana I see a Lindzen crock in your future-- Lindzen repeats his favourite trick, and the interview was made on 6 April 2011 . -
michael sweet at 00:46 AM on 15 April 2011Monckton Myth #16: Bizarro World Sea Level
Daniel, Since Global sea level rise has been fairly small so far rocky places like England are not underwater yet. I have visited Funafuti, the capital of Tuvalu. There the sea level has risen about 20 cm in the last 40 years. Since the highest location in the country is only 4.5 meters, and the bulk of the country is 1-2 meters they are very concerned. King tides regularly flood large sections of Funafuti today where it was dry 40 years ago. Will you provide a new home for the people who live in Tuvalu when their country is gone? You have to pick a low place to see the effects today, in the future the sea level is expected to rise faster and it will affect England too. Current forecasts call for 1-2 meters of sea level rise by 2100. London planners say tehy can hold back the Thames up to 2 meters. After that London will flood. Do you care what London looks like in 100 years? -
cloa513 at 00:43 AM on 15 April 2011Christy Crock #3: Internal Variability
http://www.2gb.com/index2.php?option=com_newsmanager&task=view&id=8613 World renowned scientist not in favour of reducing carbon emmissionsModerator Response: This comment has nothing to do with the topic of this thread or the discussion at hand. Note per the Comment Policy, off-topic posts are not permitted. Please use the search dialog in the upper left to find the appropriate thread for your comment. Future off-topic comments will be deleted. -
Albatross at 00:40 AM on 15 April 2011Christy Crock #3: Internal Variability
All, Please note. Christy attributed all the observed recent warming to natural variability. All of it-- even Pat Michaels does not go that far. The scientific literature does not support Christy's unsubstantiated assertion, in fact it is a demonstrably false statement as shown in this post. It is unbelievable that people here would defend Christy misleading congress. And that was not the only demonstrably false statement that he made to congress as shown here at SkS.....there is more to come. Dana have more papers that demonstrate that Christy is wrong in his beliefs on this, including some from Zorita. -
Albatross at 00:35 AM on 15 April 2011Christy Crock #3: Internal Variability
HR @10, I would take everything Davis rose writes on climate with a pinch of salt, even the stuff he places in quotation marks. Do you honestly believe that a reputable scientists and modeller like Tsonis does not understand the difference between modelling weather and modelling climate as the article alleges he believes? And since when did it become fashionable to cite the Daily Mail as a reliable source of scientific information? It has not, at least in the realm of real and reliable and reputable science. And for the record, I have vehemently defended the distortion of Latif's remarks (made in late 2009) made by the media. You are trying to detract from the words that Tsonis published at RealClimate on this matter. it is not going to work. -
2nd law of thermodynamics contradicts greenhouse theory
Fred> The most fundamental point is that you cannot consider the out and back long wave energy transfers in isolation. Tom @ 995 demonstrated the entropy calculations including surface radiation, back radiation, and radiation to space. Entropy was indeed reduced, therefore the 2nd law is not violated. Do you have some actual math to match your bare assertions? -
Albatross at 00:23 AM on 15 April 2011Monckton Myth #16: Bizarro World Sea Level
Daniel, "But you choose not to. Instead you send me off to read hundreds of pages of scientific analysis." How dare they? What a truly awful thing to do! (/sarc). You remind me of a third year university student you complained that I had given them a reading assignment that required them to visit the library. I kid you not. There is no shame in not having read a bunch of papers, there is shame in refusing to be a true 'skeptic' and making the effort to look at the science with an objective and open mind. Deenis @49 make some good points. The WUWT crowd are charlatans the sooner you realize that the sooner you will begin to learn some proper science and begin to understand the true gravity of this situation down the road. -
cloa513 at 00:22 AM on 15 April 2011Christy Crock #3: Internal Variability
Yet according to IPCC models that tiny addition from volcanoes (Kroatoa particularly) should have caused a massive temperature change- the temperature change is barely noticeable. -
cloa513 at 00:20 AM on 15 April 2011Christy Crock #3: Internal Variability
Impossible to post on most other threads. e.g. models are unreliable thread does not accept posts.Moderator Response: The climate models thread absolutely accepts posts, as does every thread on this site. If you would like to discuss climate model reliability in general, you are encouraged to take your discussion there. -
logicman at 00:00 AM on 15 April 2011Monckton Myth #16: Bizarro World Sea Level
Morner's trick: Taken from the WUWT page recommended by daniel. Can you spot the trick, boys and girls? Note also the use of a stock rhetorical trick: "X was done by unspecified members of group Y". "The Reichstag was burned down by Jews." Pace Godwin and the SkS moderators.
-
Arkadiusz Semczyszak at 23:52 PM on 14 April 2011Solar Hockey Stick
Sorry , my fault, A few citations, which recently I put on this site: Sub-Milankovitch solar forcing of past climates: Mid and late Holocene perspectives, Helama et al., 2010.: “The observed variations may have occurred in association with internal climate amplification (likely, thermohaline circulation and El Niño–Southern Oscillation activity). THE NEAR-CENTENNIAL DELAY in climate in responding to sunspots indicates that the Sun's influence on climate arising from the current episode of high sunspot numbers may not yet have manifested itself fully in climate trends. Testing solar forcing of pervasive Holocene climate cycles, Turney et al., 2005. : “The cycles, however, are not coherent with changes in solar activity (both being on the same absolute timescale), indicating that Holocene North Atlantic climate variability at the millennial and centennial scale is not driven by a linear response to changes in solar activity.” Cyclic variation and solar forcing of Holocene climate in the Alaskan subarctic, Hu et al., 2003.: “Our results imply that small variations in solar irradiance induced pronounced cyclic changes in northern high-latitude environments. They also provide evidence that centennial-scale shifts in the Holocene climate were similar between the subpolar regions of the North Atlantic and North Pacific, possibly because of Sun-ocean-climate linkages.” Response of Norwegian Sea temperature to solar forcing since 1000 A.D., Sejrup,2010.: “The correlations are synchronous to within the timescale uncertainties of the ocean and solar proxy records, which vary among the records and in time with a range of about 5–30 years. The observed ocean temperature response is larger than expected based on simple thermodynamic considerations, indicating that there is dynamical response of the high‐latitude ocean to the Sun.” Swingedouwet al., 2010. lag TSI - temperature - 40-50 years - regional NH. The influence of the de Vries (∼200-year) solar cycle on climate variations: Results from the Central Asian Mountains and their global link, Raspopov et al. 2006.: “An appreciable delay in the climate response to the solar signal can occur (up to 150 years). In addition, the sign of the climate response can differ from the solar signal sign. The climate response to long-term solar activity variations (from 10s to 1000s years) manifests itself in different climatic parameters, such as temperature, precipitation and atmospheric and oceanic circulation.” Mid- to Late Holocene climate change: an overview Wanner et al., 2008: „On decadal to multi-century timescales, a worldwide coincidence between solar irradiance minima, tropical volcanic eruptions and decadal to multi-century scale cooling events was not found..” Medieval Climate Anomaly to Little Ice Age transition as simulated by current climate models, González-Rouco et al., 2011.: “Therefore, under both high and low TSI change scenarios, it is possible that the MCA–LIA reconstructed anomalies would have been largely influenced by internal variability. ” Climate change and solar variability: What's new under the sun?, Bard and Frank, 2006.: “Overall, the role of solar activity in climate changes — such as the Quaternary glaciations or the present global warming — remains unproven and most probably represents a second-order effect.” -
Monckton Myth #16: Bizarro World Sea Level
Dikran Marsupial, Moderators - Many of the hyperlinks in this post don't work as formatted; they all have www.skepticalscience.com appended at the beginning.Moderator Response: [Dikran Marsupial] Many thanks, I have fixed them now. -
Daniel Bailey at 23:49 PM on 14 April 2011It's not bad
It's only a negative if you want your beer cold: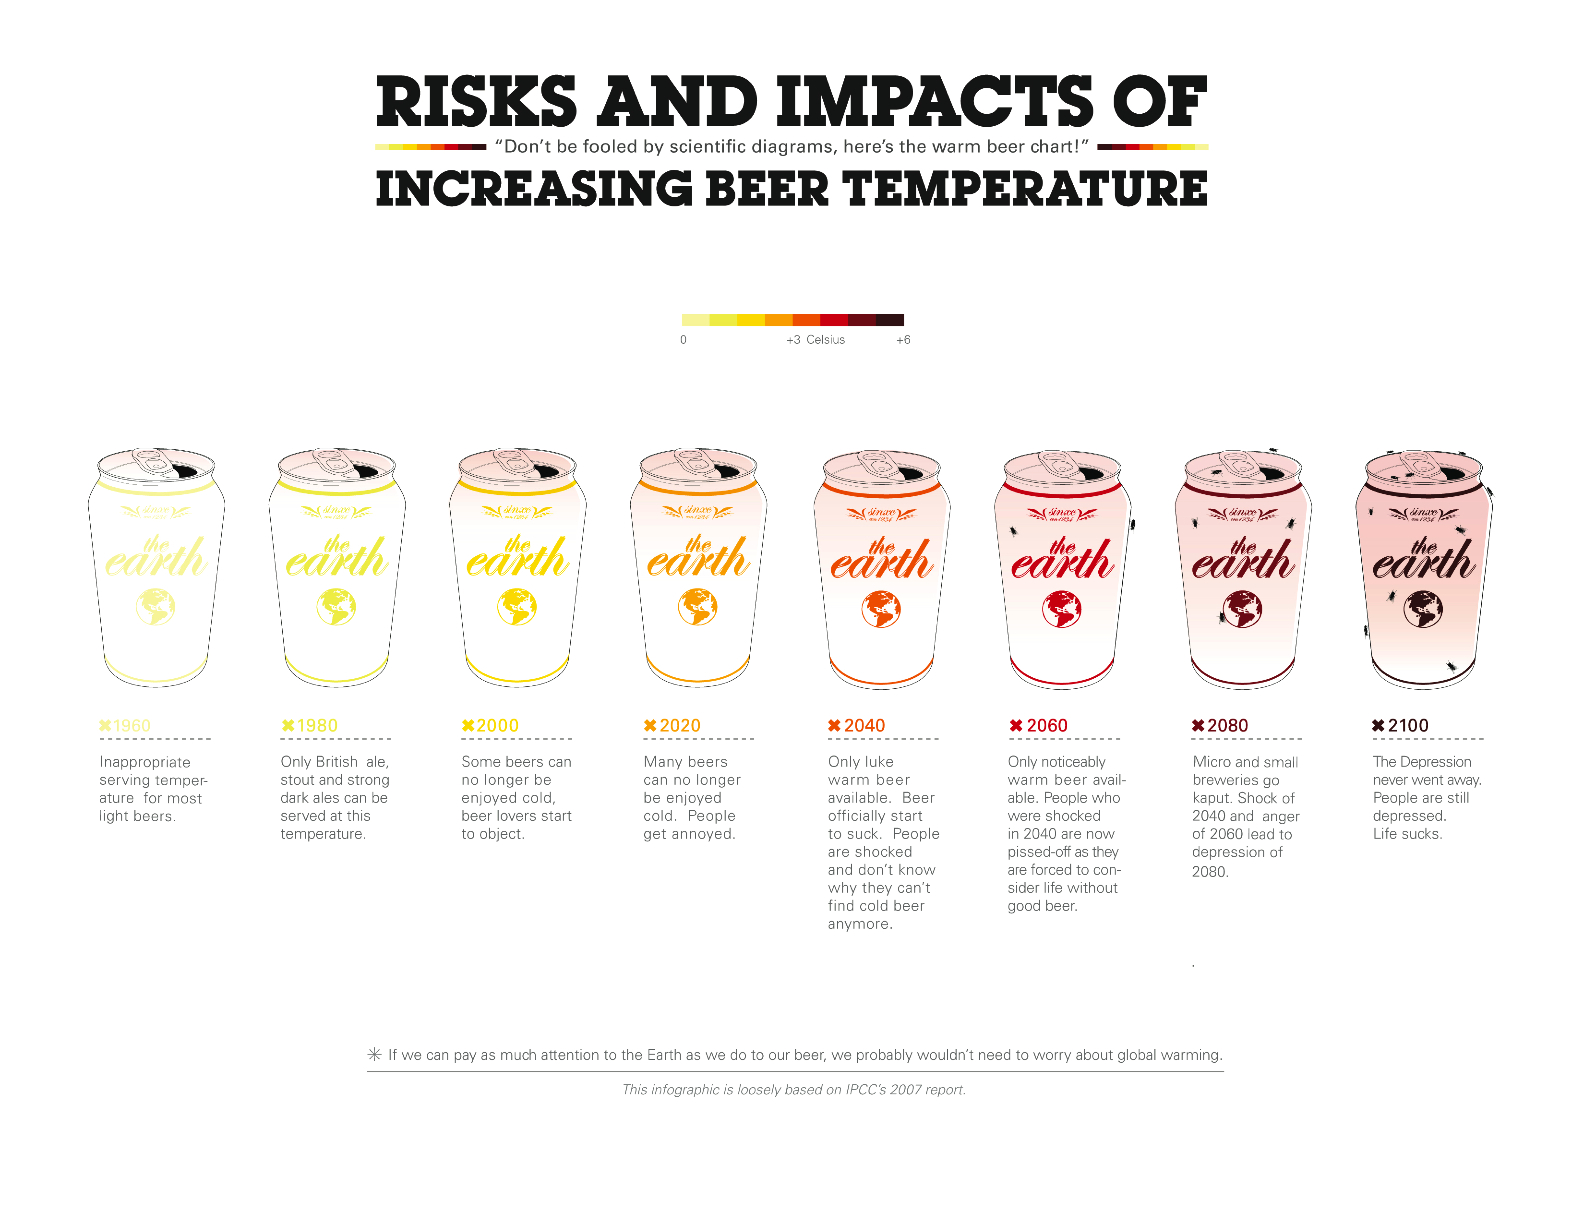 Climatologists: "We drink beer because we care"
The Yooper
Climatologists: "We drink beer because we care"
The Yooper
-
poptart at 23:44 PM on 14 April 2011Monckton Myth #16: Bizarro World Sea Level
I believe Lord Monckton is a "peer". Therefore, anything he peruses is "peer reviewed".With that in mind, I bet we can get poptech's list up to 1000! -
Alec Cowan at 23:44 PM on 14 April 2011The e-mail 'scandal' travesty in misquoting Trenberth on
@Ken Lambert #110 Interesting, but no. There are a lot of problems in that argumentation -and in your conclusion-, for instance the down-dwelling being restricted by BP's ukase to polar iceshelves borders. The matter here is quitting the fallacy of the 0-700m layer being "the oceans" and repeating the same analysis for 0-300m layer, 0-500m layer and 0-1000m layer. You also can present the 0-700m layer analysis by sublayers of 100m. Once that done -and it has being done- just observe if all layers follow a similar trend or there are a lot of heat relocations -to avoid the term "transfer"-. The technique of the bullsphere 2.0 has been so far a lidocaine one: just pounding on the outer layer for 2004-2008, trying to keep the previous +10 years in shadows and 75% of the ocean dark as it is, and then, once the anaesthetic effect is obtained, add some wishful thinking disguised as a conclusion, for instance "So not only ..., we might have had little for the 17 years 1993-2010 shown on the charts." Really!? Ah! "we might"! the everlasting use of a modal auxiliary verb as an epistemological resource. -
les at 23:08 PM on 14 April 20112nd law of thermodynamics contradicts greenhouse theory
Fred, congratulations on post No. 1000 - although it may as well be 1000 mod 1. No amount of the written word, nor bean counting, can substitute for some good solid physics. No one has yet given the equations which demonstrates that the introduction of a some particular gas, when placed between two radiating bodies at different temperatures, can cause the 2nd law of thermodynamic to brake down. On the other hand, we have perfectly good illustrative physics models of the target system showing the 2nd law in good shape. Equally we have perfectly good physics models showing how the above arrangement of certain gases can reduce the rate of cooling of body at the lower temperatures. Thus far, the thesis of this blog post holds good. IMHO 1001 posts is more than adequate to establish that! -
Dennis at 23:04 PM on 14 April 2011Monckton Myth #16: Bizarro World Sea Level
"Instead you send me off to read hundreds of pages of scientific analysis." This is how science works, Daniel. Those who choose to present scientific "findings" (such as the WUWT writers) and do not do that have no standing to criticise those who do. Those who do not have the skills or time (and I include myself in this group) to perform such analyses should respect the research of those who have. -
Arkadiusz Semczyszak at 22:59 PM on 14 April 2011Christy Crock #3: Internal Variability
Internal variability ... - let's look into the paper 2010 UKCP09. : „Uncertainties remain in estimates of natural internal climate. Internal variability is difficult to estimate from available observational records since these are influenced by external forcing, and because records are not long enough in the case of instrumental data, or precise enough in the case of proxy reconstructions, to provide complete descriptions of variability on decadal and longer time scales.” Of course you can cite the paper: A Significant Component of Unforced Multidecadal Variability in the Recent Acceleration of Global Warming, DelSole, Tippett and Shukla, 2010. : “While the IMP can contribute significantly to trends for periods of 30 years or less, it cannot account for the 0.8 o C warming trend that has been observed in the twentieth century spatially averaged SST.” However, I would recommend NIPCC comment to this paper: “In considering the latter portion of the record (1946-2008), results indicated that the internal variability component of climate change (the IMP) operated in a cooling mode between 1946 and 1977, but switched to a warming mode thereafter (between 1977 and 2008), suggesting that the IMP is strong enough to overwhelm any anthropogenic signal.” Does the past - the Holocene - we had a strong global changes, that are difficult to explain simply the influence of external factors? Mid-Holocene regional reorganization of climate variability, Wirtz et al. 2009. : “We integrate 130 globally distributed proxy time series to refine the understanding of climate variability during the Holocene.” “Secondly, at most sites, irreversible change occured in the Mid-Holocene. We suggest that altered ocean circulation together with slightly modified coupling intensity between regional climate subsystems around the 5.5 kyr BP event (termination of the African Humid Period) were responsible for the shift.” “It seems likely [comparison n 250, 550, 900 and 1450 yr cycles] that altered ocean circulation together with slightly modified coupling intensity between subsystems (regional interplay of ice, ocean, atmosphere and vegetation) after the 5.5 kyr BP event made these subsystems either more or less prone to oscillations. The discussion of possible mechanisms behind changed climate variability, however, has to be substantiated by future modelling studies.” The same we can said of the MCA - LIA. Medieval Climate Anomaly to Little Ice Age transition as simulated by current climate models, González-Rouco et al., 2011.: “Most models have used relatively high TSI variations from the MCA to the LIA and their pattern of response is typically a uniform warming in the earlier period. In spite of this, there are considerable differences among the simulations that highlight a feasible influence of initial conditions and internal variability. Furthermore, if reduced levels of past TSI are given more credit, as in the MPI-ESM-E1 ensemble, the temperature response for the MCA–LIA is less uniform in sign and visibly more influenced by internal variability. Therefore, under both high and low TSI change scenarios, it is possible that the MCA–LIA reconstructed anomalies would have been largely influenced by INTERNAL VARIABILITY. [...]” -
Alec Cowan at 22:57 PM on 14 April 2011The e-mail 'scandal' travesty in misquoting Trenberth on
@logicman #100 Both, paper and graphic refer to the same ocean layer, not to the whole oceans. As an interesting exercise for students, take some typical ocean temperature profile, for instance, this, and estimate how much you have to move it downwards -repeating the same temperature in the surface- to hide 1023J throughly distributed. You will be surprised by the answer. -
Dikran Marsupial at 22:52 PM on 14 April 2011Christy Crock #3: Internal Variability
Giles: I postulated no such thing, it is purely your own invention. A chaotic system can have more than one attractor, nowhere did I suggest that is not the case of the weather (which means that is is possible natural variability could result in long term changes - e.g. snowball Earth). The primary interest though is in the responses to forcings. If all of the model runs agree on the long term hindcast, that is reasonable grounds to think it is probably forcings, if some fall into one cluster and others fall into another, that would suggest more than one "attractor" (not sure that actually happens though), that would be an indication that it was not only forcings. In both cases, we don't know anything for certain, we just know the consequences of what out current knowledge of suggests is plausible, nothing more. As I have repeatedly said, (paleo)climatologists know that perfectly well. You will notice I used a lot of probabilistic qualifiers in that paragraph, there is a good reason for that, which is that any knowledge we gain from any observation is necessarily uncertain. I can't believe you are still going on about proving a hypothesis to be true. This shows a complete lack of understanding of the philosophy of science, an hypothesis regarding objective reality can never be proven, only disproved. This is central to the writings of Karl Popper, which IIRC you claimed you understood. My reasoning is not circular, the models are used to determine the consequences of a set of assumptions, nothing more. Nobody assumes the models are correct (in fact as GEP Box suggests, we know they are not correct, but that doesn't mean they are not useful). -
Ken Lambert at 22:52 PM on 14 April 2011The e-mail 'scandal' travesty in misquoting Trenberth on
Gilles #105 Your numbers are right Gilles. Dr Trenberth's number for a global imbalance of 0.9W/sq.m is 145E20 Joules/year. The only place this heat can be stored (over 90%) is in the oceans. Therefore the rise in OHC must be the integral of the net forcing (the area under the forcing curve) between time T1 and T2. Check out this thread: http://www.skepticalscience.com/news.php?p=2&t=78&&n=202 BP does a pretty good job of explaining why the 'step jump' in OHC in the 2001-3 period is an artefact of the XBT-Argo transition. So not only do we not have an increase in OHC content 2004-present, we might have had little for the 17 years 1993-2010 shown on the charts. -
Alec Cowan at 22:48 PM on 14 April 2011The e-mail 'scandal' travesty in misquoting Trenberth on
@Gilles #105 At last! You're in track now. Just some clarifications: - "this means X what's exactly what I meant here" only means "I'm saying it twice", not that the conclusion is right. - You present part of the body of your argumentation again: one hand there, one leg that way ... - You continue to mix up OHC with the total ocean heat content. If you don't get it yet, you're simply echoing the set of data that seem to fit. It may sound good for uneducated people -and unfortunately the world is full of uneducated people-, but it's obvious that you are taking heat content of a layer for a period and saying "it's cooling" without bothering to explain why the same layer warmed during the previous decade at a rate above the 25 to 90 you quoted and without bothering to explain what happened with that 75% of the oceans outside that layer and ...no, not yet. Keep it going. I suppose that if you make one or two more of your comments you can get it your way: I or another person will explain you what the travesty is without you having to do an effort to understand it. -
muoncounter at 22:43 PM on 14 April 2011The e-mail 'scandal' travesty in misquoting Trenberth on
Gilles#99: "the leveling off since 2004 and perfectly visible - and continuing. " Yes, just as visible as the 'leveling off' was in 1960, 1970, 1984, 1987, 1993, 1997 and 2001. And yet the overall trend from 1970-2010 is persistently up. #102: "Of course natural noise can superimpose to long term trend and give for some time an apparent absence of warming - ... A noise can obviously go in both directions." In this case, it appears the noise is the 'leveling off.' You seem unusually sensitive to this particular noise; so much so that you cannot see the signal? -
Gilles at 22:38 PM on 14 April 2011Christy Crock #3: Internal Variability
" The point of paleoclimate studies is to help us understand past climate. The interest is largely in the forcings, not the variability as the variability is essentially paleoweather not paleoclimate." I think I see your epistemological problem - you *postulate* that the climate cannot change spontaneously over centuries without change of forcings - and you *deduce* that the changes can only be due to forcings. Do you understand that my own point is that we have neither experimental evidence, nor theoretical proof (even with computer simulations) that your first hypothesis is true ? and so that your way of reasoning is totally circular ? -
Dikran Marsupial at 22:36 PM on 14 April 2011Monckton Myth #16: Bizarro World Sea Level
Daniel Maris Yes I have read these papers, but a long time ago now. I read them when I first ran into Morner's work, it is what is called "skepticism" as opposed to "denial", which means not taking things as face value, but checking up on the facts to find out if the assertions are reasonable. You appear not to bother with that. If you think pointing out relevant papers and pointing out errors is "reverse trolling", then I have to tell you "reverse trolling" is an important part of science. Almost all papers have a sections called "references" which gives pointers to other relevant work, and where a paper argues with some existing theory or result, the errors in the previous work are pointed out in the introductory sections. Sure I could just point out some errors in the Maldives issue for you but what good would that do. I gave a detailed analysis of the false claims in the Telegraph article, but what good did that do? Have you agreed that the claims in the Telegraph artcile are false? No. Have you defended them? No. Why should I expect you to respond any differently in this case? The price of having an informed opinion on these matters is the willingness to go to the sources and sift through the facts for yourself. If you can't do that, then take on board what is said by those that do. The fact you still are unwilling to talk about the Telegraph, howevrer suggests that you are a denialist and not actually interested in the truth. Until you comment on what I have written about the Telegraph article and whether you still accept the claims made by Morner in it, I am going to assume that any further posts are just trolling. Sorry if that sounds harsh, but it is your actions that have brought it on yourself. -
Gilles at 22:31 PM on 14 April 2011The e-mail 'scandal' travesty in misquoting Trenberth on
Sorry, DB, but I don't see where I've been incorrect. I'm only answering Alec's remarks directed to me. -
Gilles at 22:21 PM on 14 April 2011The e-mail 'scandal' travesty in misquoting Trenberth on
Alec#104. Again , what are you're arguing? that energy must be conserved? of course it must ! did I deny that ? I said that when Trenberth said that they couldn't explain the lack of warming, he meant that there was a lack of warming, and that he couldn't explain it. Again, it's extremely simple : he said what he meant. Now you're saying : oh but other people have suggested that it could be due to heat storage in the deep ocean - well of course this is a *possible* explanation. But to my knowledge, there isn't precise measurements of the heat content of deep oceans. So it is only one of the possible explanation - another obvious one being that the global imbalance used is wrong. You seem to mix up suggestions with explanations. ( -Snip- )Moderator Response: [DB] Cease with making things personal. You are simply incorrect, yet incapable of admitting so. Most would regard that flaw as a failing. -
daniel maris at 22:17 PM on 14 April 2011Monckton Myth #16: Bizarro World Sea Level
Dikran, I am a little suspicious of your approach - it seems like reverse trolling. Presumably you have read these papers that you recommend I take the time to read, although I have never claimed to be trained in this area. Presumably you could sum things up pretty pithily. Presumably you could say some specific things like "That tree in Morner's photograph is no evidence because..." But you choose not to. Instead you send me off to read hundreds of pages of scientific analysis. My view of the subject is based on (1) Knowing that any effects of sea level rise in the south of the UK (which in any case is sinking) have been manageable (2) As far as I know, no one has been able to point to an island in a stable area (i.e. not an area where the land is sinking or in a delta) that has gone under water in the last 100 years. I'd be interested to hear if anyone claims there is one. (3) Dire consequences in the Maldives and elsewhere are always being predicted but never seem to happen. (4) There are clearly significant numbers of scientists who don't agree with the consensus. (5) The consensus is not the same as the extreme rises forecast by some people here - who are therefore just as guilty as denialists in ignoring scientific evidence. I've never claimed to be able to take part in a peer review of papers in this subject area. But I do think we can see given such statements as the IPCC Chair's claim about glaciers melting that there is a good degree of misinformation floating about. Bill - What do I make of the chart? Well I said I am not competent to make sense of it, but if it's real sea level as opposed to sea level in relation to land level, then I am frankly puzzled by it, since large parts of the ocean appear to be experiencing a reduction in sea level (quite substantial - 4.5 MM Pa). That makes me think there's something wrong with the measurements, or, alternatively, the measurements as a whole are not indicative of the volume of oceanic water. I presume it is the volume (or even better tonnage AND volume) of oceanic water that we are really interested in, rather than anything else.Moderator Response: [DB] Feed a man a fish and he won't be hungry - for a while. Teach a man to fish and he will never be hungry again. So take the coins of your pocket and invest them in your mind so your mind can then line your pockets with gold. Move beyond the mothers milk to real food. Dikran & Bill have given you all you need to answer your questions for yourself. -
David Horton at 22:16 PM on 14 April 2011Christy Crock #3: Internal Variability
Or, and I realise this is just one of those off-the-planet crazy ideas, we could work out the physics of CO2 in the atmosphere, and then relate the observed temperature changes (and all the associated rapid changes in this little biosphere we call home) to that, see if, by come wild chance, they happen to match. Then we could use computer modelling to work out how that might develop in future, just on the crazy off-chance that the physics and observations and knowledge of past climate shifts are correct. And then, if it looked like the planet was going to be in deep doo doo, what with acidifying oceans, increasing droughts and other severe weather events, rising oceans, melting ice caps, species extinctions, failing agriculture, why, then we could convince the world's governments that there needed to be a quick response in reducing CO2 output. Yeah, that should work I think, not as if there are going to be people trying to stop governments responding to the clear and present danger, are there? -
Gilles at 22:16 PM on 14 April 2011The e-mail 'scandal' travesty in misquoting Trenberth on
well Alec, I think I still can do simple arithmetic computation 1 W/m2 * 4 * Pi*(6,4e6)^2*365*86400 = 1,62 E22 J/yr = 162 E20 J/yr. Now the figures given here are : Land: 2 x 10^20 joules per year Arctic sea Ice: 1 x 10^20 joules per year Ice sheets: 1.4 x 10^20 joules per year Total land ice: between 2 to 3 x 10^20 joules per year Ocean: between 20 to 95 x 10^20 joules per year Sun: 16 x 10^20 joules per year (eg - the sun has been cooling from 2004 to 2008) they're all of the order of magnitude of 10^20, meaning a few % of the last result except for the ocean that can reach almost 10^22. We are speaking of one part of the 0.9W/m2 missing -meaning some 10^21 J/yr missing. This means that oceans represent the main part of heat sinks on the Earth, all the other components being negligible. That's exactly what I meant here, at the very first post of this thread : " the atmosphere stores only a tiny amount of energy" and later here " The sentence should have read: "Our measurements of how much energy goes into the atmosphere, land, and melting ice are accurately known, however."" Oh, yes, sure ! I know it accurately. On average , it's zero." Well zero is a little bit rhetorical - I should have said a few percent of the total. The heat storage takes place essentially in the oceans, all the other components are negligible. Again, what is your point ? -
Dikran Marsupial at 22:14 PM on 14 April 2011Christy Crock #3: Internal Variability
Gilles wrote "I don't think so" Well that settles it then! LOL

Prev 1764 1765 1766 1767 1768 1769 1770 1771 1772 1773 1774 1775 1776 1777 1778 1779 Next


