


 Arguments


Recent Comments
Prev 1778 1779 1780 1781 1782 1783 1784 1785 1786 1787 1788 1789 1790 1791 1792 1793 Next
Comments 89251 to 89300:
-
les at 22:58 PM on 18 April 2011More Carbon Dioxide is not necessarily good for plants.
107 David Horton "Time really is up for all this" Maybe we need a new form ofrefereeingmoderation?
-
HumanityRules at 22:55 PM on 18 April 2011Solar Hockey Stick
The issue, as I see it, isn't whether the solar activity variation is high or low over the MWP/LIA period but rather whether that observation fits well with how we understand the 'control knobs' of the climate. There's an interesting series of papers in PAGES Newsletter March 2011. I don't know what PAGES is, suspect this work isn't peer-reviewed but it does appear to be showing work from some important scientists who work on this problem. I was struck by the conclusions in the modelling paper (starting page 7). I'll just reproduce the conclusion in full and leave it to yourself to decide just how much confidence we should have in our present understanding of the science. I think it's worth reading the rest of these papers. "Conclusions The results presented here highlight major discrepancies between millennium simulations and reconstructions. If proxybased reconstructions were considered reliable and changes in radiative forcing factors were responsible for the MCA–LIA reconstructed temperature signal, these results would have implications on our understanding of the MCA–LIA transition. These discrepancies suggest that either the MCA–LIA changes arose from internal variability only, or transient simulations with state-of-the-art AOGCMs fail to correctly reproduce some mechanisms of response to external forcing: for instance, changes in the tropics like the enhancement of the zonal gradient in the tropical Pacific is not well simulated, with implications for related teleconnections elsewhere. Most models have used relatively high TSI variations from the MCA to the LIA and their pattern of response is typically a uniform warming in the earlier period. In spite of this, there are considerable differences among the simulations that highlight a feasible influence of initial conditions and internal variability. Furthermore, if reduced levels of past TSI are given more credit, as in the MPI-ESM-E1 ensemble, the temperature response for the MCA–LIA is less uniform in sign and visibly more influenced by internal variability. Therefore, under both high and low TSI change scenarios, it is possible that the MCA–LIA reconstructed anomalies would have been largely influenced by internal variability." -
Gilles at 22:52 PM on 18 April 2011Christy Crock #3: Internal Variability
0.015°C/yr of course. -
Gilles at 22:51 PM on 18 April 2011Christy Crock #3: Internal Variability
I make no supposition : I just say that the use of computer simulation is not a good criterion to exclude long term variations, since both computation methods *and* initial conditions have been carefully selected with this criterion. Now you use a totally different argument by saying :"The unforced stabilty of the climate seems well established by the paleoclimate record. " because this argument doesn't rely at all on computer simulations but on observations ! so you change the argument and say now " but paleoclimate observations exclude a natural 0.15°C/yr during 50 years". Which is again wrong : paleoclimate data don't exclude this kind of variations. " Can you give an example of a major shift in climate that cannot be attributed to a change in forcing?" "being attributed" being not an objective variable, but kind of a sociologic feature of current science, I can't answer this question. I stick on facts. But a 0.5 °C variation in 50 years wouldn't certainly be called a "major shift in climate" for paleoclimatic data (after all, who in the world is living in a different "climate" from his parents ?) - and yes of course there are plenty of such variations in the past - that cannot clearly be attributed to a change in forcing. -
les at 22:34 PM on 18 April 2011More Carbon Dioxide is not necessarily good for plants.
Got to be said, that FACE stuff is interesting. The plots look log (asymptotic) or, at best, log-linear; not exponential (that's the 'up shot') and compatible with point 6. of the blog post. As has been mentioned, one can expect some improvement when one or another resource becomes more abundant, allowing other resources which are already abundant to be utilized and that will self-limit... in system like that, you'd expect an asymptotic improvement in the absence of any negative influences (increase in premeditation etc.) Good data. -
Alexandre at 22:29 PM on 18 April 2011More Carbon Dioxide is not necessarily good for plants.
David Horton at 22:24 PM on 18 April, 2011 I'm with you. -
Bob Lacatena at 22:28 PM on 18 April 2011Clouds provide negative feedback
RW1,Is it also a coincidence that clouds are made up of H2O and water vapor concentrations drive cloud formation? It is also another coincidence that water vapor is removed from the atmosphere from precipitation that emanates from clouds?
Yes, it is coincidental. That is, both are true, but neither mean anything....what would prevent the temperature from rising significantly higher and higher from even just a few days or few weeks of abnormally warm weather? Yet this never happens...
Yes it does, every time the seasons change. That is, the change in temperature in the temperate zones is greater than could be accounted for by the mere change in hours of insolation and angle of incidence of the sun (and change in albedo from winter snow to bare ground). Humidity also rises, and the GHG effect from this amplifies the temperature. This happens, any you experience it, every spring. But to give your question a more direct answer, you seem to be describing a runaway. As long as the feedback is less than the original forcing, it is positive, but not a runaway. This is the simple case of a convergent versus a divergent series in mathematics.This is probably because the forces...
No. This is an assumption without foundation (as evidenced by the word "probably"). Clouds form or dissipate in a matter of hours. What would be needed to change climate would be a major change in the pattern in which clouds form or dissipate -- where, or when, or how much, by a significant degree, over a long period of time. There is no firm logical reason to think that this would happen (Lindzen argues that it should, but I and most of climate science find his arguments very unconvincing, and observational evidence to date is indecisive, which by itself tells you that it's not a "major" control, or else it would be obvious and unarguable). The fact that you think it could happen easily is in no way evidence that it does happen.But clouds operate on even shorter time scales than CO2, and temperature fluctuations occur on much shorter time scales too.
So if they had a moderating effect they would be a serious damper in the system. But they don't. And if they were, because they operate so quickly, you would see their effect instantly. Which is exactly why clouds cannot be a major factor. On the time scales over which clouds vary, if in fact they were a moderating influence, then the temperature of the earth would never, ever vary by more than a fraction of a degree (or the clouds would quickly step in and stop it). You'd never have ice ages, Medieval Warm Periods, Little Ice Ages, or any notable variations. And yet over the history of the earth the temperature has varied by as much as 10˚C. Anything which operates on that fast a time scale is either the primary control, or it's not a control at all. All evidence points to "not at all." It may be a slightly positive or slightly negative feedback, but it's not a control, and not even a major feedback (compared to H2O, CO2, and albedo). Look here for further information on how we know that climate sensitivity is not low, so any moderating influence of clouds cannot be a major, fast acting factor. Oh, and as an aside, I did forget one control from my previous list:- Aerosols (due to volcanic activity, these can act very, very quickly, but by themselves are normally short lived, but gain "traction" by reducing the planet's albedo long enough to instigate other feedbacks which can be longer lived).
-
David Horton at 22:24 PM on 18 April 2011More Carbon Dioxide is not necessarily good for plants.
Anyone else get the feeling we are just wasting our time answering this kind of stuff? That the responses can keep getting produced, over and over, and back will come the same old nonsense, over and over. Time really is up for all this. Ten years ago we argued because we thought there was a chance of bringing facts to bear, changing minds, influencing people. The last ten years have shown that there are a core of people who will never stop resisting in order to prevent any political and economic action. And feeding off them are the politicians like Abbott, telling people they can be better off because he won't "tax" them to save the planet, fools like Howes demanding no change at all to the present economic structure, and the big corporations demanding the same. All just a game, as if we can decide not to respond to greenhouse gases and then everything will be alright. I am tired of that game. -
RSVP at 22:14 PM on 18 April 2011Waste heat vs greenhouse warming
For the most sea worthy ships, waves may wash on deck. No problem; when built properly, there are amply ways for the water to return to the sea. For this reason, the ship does not sink. Put a small hole in the hull however, and if there is no bailing, eventually the proud vessel will find its davy jones. Our spaceship Earth is no different. All surfaces that pick up heat from the Sun act conversely to radiate the same. While a slight change in CO2 may be changing the atmospheric temperature profile, the net entropy remains unchanged. And while energy cannot be destroyed, the same cannot be said for our lovely Planet. -
Alec Cowan at 22:14 PM on 18 April 2011The e-mail 'scandal' travesty in misquoting Trenberth on
@Ken #134 Call me coy or paint me purple, but firstly you have to substantiate your assertion about Knox & Douglas using other than 0-700m layer in figure 1 and all 4 methods. How come you can quote some conclusion without giving the scope of that conclusion. For God's sake Ken, it's a 2-page paper with almost all mathematics stripped from it!! I'm telling you again, Knox & Douglas use 0-700m layer and refer papers dealing with not always the same layer. You are telling otherwise and you refuse to substantiate it just by reading the paper and copypasting what applicable to identify some piece of information. C'mon! Do you think that by labeling something OHC or Argo that matter is settled? C'mon, Ken! Don't insist with that '*deep ocean*' (what are those **** symbols? some kind of magic spell?) unless you can give direct evidence from the paper or compare its figures with Argo's site or other papers. I think you are worried because Knox & Douglas' goes very roughly on the same way Trenberth did when he talked of the "travesty" and your argumentation backfired. -
CBDunkerson at 22:12 PM on 18 April 2011Muller Misinformation #3: Al Gore and polar bears
chriscanaris: See the IUCN Polar Bear Specialist Group site. As I mentioned before, these are the people who produced the data which the map above is based on. The site also has information about the conditions impacting the various sub-populations. Similar conditions (allowing for continued population growth) exist for the larger neighboring 'Gulf of Boothia' population, but there increased hunting by humans has caused numbers to stabilize. For instance, the lone 'growing' sub-set at M'Clintlock channel consists of a tiny population of approximately 284 bears, and is believed to be growing simply because the population is still recovering from hunting. Until recently that was true of most of the sub-populations... but declining habitat has now reversed the trend in many areas as seen above. M'Clintlock channel has continued to experience significant sea ice coverage and thus hasn't seen population declines yet. I believe the Foxe Basin population status is unknown just because it is a remote region (most of the bears are found on various islands un-inhabited by humans) which has been difficult to study. There are new aerial surveys being conducted to fill out the picture on this group. -
Alexandre at 22:08 PM on 18 April 2011More Carbon Dioxide is not necessarily good for plants.
JMurphy at 18:36 PM on 18 April, 2011 Re PETM BTW, I find the PETM a fine example to contrast natural variance of temps and CO2 with the present anthropic one. There we had a ~5ºC variation in 10 to 20 thousand years, and that was a specially wild and fast variation in Earth's climate, specially if we consider we were not coming out of an Ice Age. It affected so much Earth's ecology that it caused a lot of species to shift in occurrence, adapt or be extinct. Now we're doing it over one order of magnitude faster: 5~6 degrees in one or two centuries (maybe more, if you consider the 200 year span). Species are not free to roam through the continents, as most ecosystems are fragmented by human occupation, even if species could move this fast. And we see people trying to argue how will this be benign to the planet, or that the variance is natural. -
Marcus at 21:49 PM on 18 April 2011More Carbon Dioxide is not necessarily good for plants.
Until these FACE trials are able to mimic *all* the conditions expected to exist in an enriched CO2 world (including more extreme hydrological cycles & increased temperatures), then there is only so much relevant information that can be gleaned from them. What can be gleaned is that, even in ideal conditions, its unlikely that the rather modest long-term biomass increases seen so far will be sufficient to offset losses due to all the other detrimental impacts of global warming. Also, the results of FACE trials-even under ideal conditions-as regards disease & pest infestations, not to mention nutritional value, don't exactly paint a very pretty picture for our future. -
CBDunkerson at 21:48 PM on 18 April 2011CO2 lags temperature
novandilcosid wrote: "It is being claimed that CO2 makes temperatures hotter than they otherwise would be. There does not seem to be support for this in the data presented in the headline post." That CO2 causes higher surface temperatures (aka 'the greenhouse effect') was first proven by John Tyndall more than 150 years ago. Articles explaining how this works and correcting other fundamental errors in your analysis above can be found on this site at; Has the greenhouse effect been falsified? and The greenhouse effect and the 2nd law of thermodynamics -
CBDunkerson at 21:39 PM on 18 April 2011More Carbon Dioxide is not necessarily good for plants.
I love the medication analogy in the article. It is a simple example that most people will easily understand and from there see the obvious fallacy of the 'more CO2 is always good' argument. As to the impact on plants specifically... it is well known (unless one is an evolution denialist also) that all lifeforms evolve to best survive within the environment around them. The longer a particular element of that environment is relatively stable the more time lifeforms will have to evolve to adapt to it. Atmospheric CO2 levels had been constrained to a range between about 180 and 280 ppm for millions of years. Every plant on the planet has therefor been evolving towards the ability to best survive within that CO2 range for millions of years. There is no way that they will all now be able to adapt to radically different CO2 levels within a matter of decades. Some will retain characteristics from higher CO2 periods in the past which will allow them to cope, but others will not. Thus, even without considering global warming's impact on water resources, pests, and other things which will impact plants... the changing atmospheric CO2 level alone will alter (likely already is altering) the growth patterns of plants all over the world. Another analogy: Humans require oxygen to live. However, we have evolved to process oxygen at the levels currently found in the atmosphere. If the partial pressure of atmospheric oxygen increased to four times current, oxygen toxicity would kill every human being on the planet (unless they were in some sort of environmentally controlled space). Given enough time, plants (or humans) could evolve to adapt to radically different levels of essential 'life giving' gases in the Earth's atmosphere. However, we are causing these changes on a scale measured in decades while those kinds of evolutionary changes would require millennia. -
Berényi Péter at 21:23 PM on 18 April 2011More Carbon Dioxide is not necessarily good for plants.
Let's see some real science. Journal of Experimental Botany (2009) 60 (10): 2859-2876. doi: 10.1093/jxb/erp096 First published online: April 28, 2009 Elevated CO2 effects on plant carbon, nitrogen, and water relations: six important lessons from FACE Andrew D. B. Leakey, Elizabeth A. Ainsworth, Carl J. Bernacchi, Alistair Rogers, Stephen P. Long & Donald R. Ort Lessons:- carbon uptake is enhanced by elevated [CO2] despite acclimation of photosynthetic capacity
- photosynthetic nitrogen use efficiency increases at elevated [CO2]
- water use at both leaf and canopy scales declines at elevated [CO2]
- dark respiration is significantly stimulated in soybean leaves grown under elevated [CO2]
- stimulation of carbon uptake by elevated [CO2] in C4 plants is indirect and occurs only in situations of drought
- the [CO2] ‘fertilization’ effect in FACE studies on crop plants is less than expected
-
Marcus at 20:43 PM on 18 April 2011More Carbon Dioxide is not necessarily good for plants.
"maybe the defenses of the particular species they studied are weakened by more CO2 - but they don't give the final result on the total yield (do the damages made by beetles offset the increased yield or not ?)" Gilles, that's because its only an article *about* the study, not the full study itself. I doubt the study would have gotten published *unless* they included full results &-judging from what they say in the article-the results don't tell a great story for the yield effects of beetle infestations on soybean plants grown in enriched CO2 conditions. Also, consider the increased cost of pest management, given the increased life-cycle & breeding times of beetles under enriched CO2 conditions-costs which will definitely be passed onto consumers. Seriously, your ability to ignore data that doesn't fit your agenda is quite astounding. -
les at 20:43 PM on 18 April 2011More Carbon Dioxide is not necessarily good for plants.
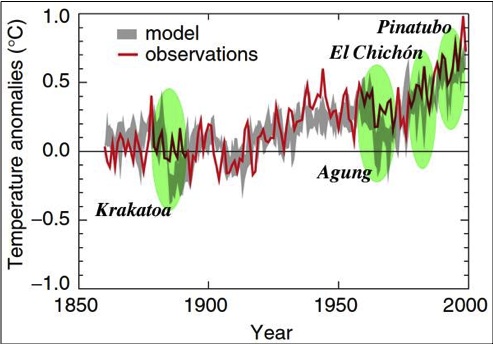
97 - Berényi Péter "It means the curve up to the point where I've clipped it can be checked using actual data, beyond that it is pure fantasy." It would, of course, be important to see the source research behind the graph... but I doubt that the lines up to 'now' are composed of data sets which have been gathered between 1860 and now, from the whole world... How was the graph composed? You know, Science is about understanding the evidence presented, not making unverifiable claims about the meaning of the bit of a graph that happens to take your fancy. -
LukeW at 20:39 PM on 18 April 2011More Carbon Dioxide is not necessarily good for plants.
"And you want those La Ninas to get stronger?" YES PLEASE !! Would make us billions ! (with some collateral damage too but life wasn't meant to be easy) You would like another 20 year drought cycle instead ...? La Nina = recovery, replenished dams, refilled aquifers, breeding cycles, Murray Darling flowing, fish migration and spawning, new seed stores, bird breeding - it's great stuff. Villabolo - I believe in climate change - but we need precision in the arguments - and a robust few of historic climate variation. (1) ENSO - first (2) IPO - second (3) climate change a long way back at 3rd - but eventually could become the main game albeit an unpredictable one (with winners and losers) Albatross: La Ninas and IPO among others El Nino-like mean state Remember I was only speculating about winners and losers. But US agriculture becoming an AGW winner would be ironic wouldn't it?Moderator Response: [mc] fixed link text. Please provide context for links. Link-only comments are not usually helpful and may be deleted. -
Marcus at 20:33 PM on 18 April 2011More Carbon Dioxide is not necessarily good for plants.
Oh &, John D, I think you forgot to mention this part of the story: "Fungal biomass of Fusarium pseudograminerarum significantly increased in wheat grown under eCO2. In absence of high levels of varietal resistance, crown rot will result in a reduction in yield (and quality) in future climates, particularly in drier years". Sort of puts a dint in your theory that CO2 magically improves yields under *all* circumstances. -
novandilcosid at 20:29 PM on 18 April 2011CO2 lags temperature
1. The Greenhouse theory is not straightforward. Absorption figures for CO2 at STP show that ALL the surface energy emitted in the CO2 band is absorbed within the first 500m of atmosphere, and the majority below 50m (0.5% of the atmosphere). Doubling CO2 has a negligible direct effect: ALL the energy is still absorbed into the atmosphere, just at half the altitude. 2. At the top of the atmosphere, using the same figures, but adjusting line shapes and amplitudes for temperature and pressure, it is clear that the greater portion of the 15-18W/m^2 emitted to space by CO2 is being emitted by the ~10% of the atmosphere lying ABOVE the Tropopause. Rough figures are: from 11-12.5km, 5%; 12.5-15km, 10%; 15-17.5km, 12%, 17.5-20km, 13%;20-25km, 20%; above 25km, 40%. If you increase CO2 concentrations, emissions are from higher levels, and an even higher proportion will be above the tropopause. IE more CO2 has a strong cooling effect. 3. Notwithstanding the above, the claimed feedback effect of CO2 on the ice-core temperatures is very shaky. I looked at the figure and note the long lag in the FALL in CO2 concentration. Why does the CO2 not hold up the temperature fall? Where is the mathematical model and its comparison with the data? At present the data does not seem to support the hypothesis. 4. The data unequivocally shows a lag between temperature and CO2 concentration. It is being claimed that CO2 makes temperatures hotter than they otherwise would be. There does not seem to be support for this in the data presented in the headline post. -
Marcus at 20:27 PM on 18 April 2011More Carbon Dioxide is not necessarily good for plants.
John D, we've been over this before. (1) The results you quote are, from memory, *only* for the most ideal conditions-something you fail to point out. (2) If the results were as positive as you claim, then why are the lead researchers so circumspect about the results? Indeed, the researchers make a specific point of the reduced nitrogen content. They also point out that gains in yield are only short term, due to acclimation. So it seems the only person telling *half* the story-John D-is *you*. You deliberately ignore the half of the story that doesn't fit your agenda. -
Dikran Marsupial at 20:16 PM on 18 April 2011Christy Crock #3: Internal Variability
Gilles@101 There you go again, I am not the one suggesting that the drift is problematic. The need for flux corrections is an indication that there models had inadequacies in exactly the same way that epicycles were and indication that heliocentric and Copernican models have inadequacies. The comparison with planetary motion was a comment on the way that models are developed, I didn't imply in any way that the problems were physically related. It is only your supposition that "large timescale evolutions" actually exist, you have provided precisely zero evidence to support that supposition. The unforced stabilty of the climate seems well established by the paleoclimate record. Can you give an example of a major shift in climate that cannot be attributed to a change in forcing? If not, your argument seems to be as follows: Models with known shortcomings exhibit unforced drift. Therefore the real climate may have unforced drift. Therefore the model projections may be unreliable. That isn't a very convincing argument. Maybe the problem is with your second language issues. In which case, as I suggested you need to spend more time both reading other peoples posts (which you repeatedly appear to misunderstand) and more time writing your posts to explain yourself better (so that others don't misinterpret yours). -
Berényi Péter at 19:55 PM on 18 April 2011More Carbon Dioxide is not necessarily good for plants.
#47 KR at 10:01 AM on 18 April, 2011 That's a fascinating chart, Berényi. Why did you clip it? Because the last time I've checked there was a difference between past and future. The former can be remembered while the latter not. It means the curve up to the point where I've clipped it can be checked using actual data, beyond that it is pure fantasy. You know, science is about theories verified by measurements. Claims that are unverifiable in principle belong to other (admittedly fascinating) realms of the human endeavor.Moderator Response: [DB] Thank you for explaining the dodgy presentation of your graph. -
Chris S at 19:54 PM on 18 April 2011More Carbon Dioxide is not necessarily good for plants.
A must-read paper about the FACE experiments in Journal of Experimental Botany is here: http://jxb.oxfordjournals.org/content/early/2009/04/28/jxb.erp096.full In fact, that issue has several (free access) review papers on climate effects on agriculture that several commentators here would benefit from reading... http://jxb.oxfordjournals.org/content/60/10.toc -
johnd at 19:31 PM on 18 April 2011More Carbon Dioxide is not necessarily good for plants.
Marcus at 12:09 PM, if after being provided with a link providing supporting reading for an argument being made, or an image that when clicked on, takes the reader to the site it originated from, if one is left with the feeling that they have been spoon fed only half the story, it is more likely that they have instead only read the portions that suited their point of view. I'm glad the you mentioned the Horsham FACE trials because it offers the perfect opportunity to compare your "half" of the story directly to the "story" presented in this powerpoint presentation by those who conducted the actual trials you are referring to. Just to summarise, you will find on Page 10 the yield response to elevated CO2. For the Horsham trials they are shown as 2007 +22%, 2008 +25%, 2009 +26%. For the Walpeup trials, 2007 n/a, 2008 +61%, 2009 +49%. On page 11, the grain protein response. For the Horsham trials 2007 -5%, 2008 -4%, 2009 -8%. For Walpeup 2007 n/a, 2008 -11%, 2009 -13%. Now a simple piece of primary school arithmetic should indicate that for a given plant, or a given area, the protein harvested has increased because the increase in yields more than offsets any decrease in protein. This is not something new, every year the very same thing occurs, yield and protein vary inversely. This effect is quantified also on page 11 where the increase in nitrogen uptake is summarised. For Horsham, 2007 n/a, 2008 +24%, 2009 +25%. For Walpeup, 2007 n/a, 2008 +63%, 2009 n/a. If you want the full story, go to the linked presentation and read for yourself then compare what you have claimed in your post with what the scientists who ran the trials have presented. Even your concerns about diseases has been mentioned on page 12. Elevated atmospheric CO2 and wheat production in Australia Anyway all this concern focusing on nitrogen as if it is the main fertiliser is in itself only half the story. Whilst nitrogen is essential it does not have to be made available through artificial fertilisers. It is made available through totally natural processes, but can be opitimised by the use of legumes either to fix nitrogen into the soil through the root systems or as sacrificial crops, and there is plenty of nitrogen freely available. The reality is the use of artificial nitrogen fertilisers is an economic issue. Each year the cost of applying it is weighed against the expected increase in returns, and it is not every grower who will apply it every year. If the full story on fertilisers is to be addressed then the likes of phosphorous, potassium, sulphur etc are the ones to worry about. These are the fertilisers that are sucked out of the soil in large quantities and must be replenished by man if production is to be maintained. -
Gilles at 19:20 PM on 18 April 2011Christy Crock #3: Internal Variability
"Giles@99 If you point is that models used to have drifts because of their limitations, but now they have improved so that they don't, then that is an entirely vacuous point. You have provided no evidence whatsoever that the drift are problematic, just assertion." YOU provide the evidence that they're problematic, since you say they have "improved", and that "It was an indicator of a shortcoming of the models". Darwinian evolution is not a rude word in my mouth - of course scientific theories evolve like species, by try and error. The point here is that the issue to be discussed is precisely the question if large timescale evolutions are reproduced by the models, or not - and precisely the quality of the models has been evaluated following this criterion, an unstable climate being considered as "unphysical" - without precise reason. Again, it's a generic feature of numerical models to be unable to quantify precisely the amount of unforced variability for non linear chaotic systems it's not restricted to climate models - it's generic And so the argument that "variability does not exist because we don't see it in our computations" is practically devoid of any significance. And comparison with planets is irrelevant since we know precisely the constraints they must obey - which is not the case for unforced variability. -
Dikran Marsupial at 18:57 PM on 18 April 2011Christy Crock #3: Internal Variability
Giles@99 If you point is that models used to have drifts because of their limitations, but now they have improved so that they don't, then that is an entirely vacuous point. You have provided no evidence whatsoever that the drift are problematic, just assertion. The models were not randomly evolved to reduce the drift, it is nothing like Darwinian evolution. The drift was eliminated as a consequence improving the physics on which the models are based and their resolution. It was an indicator of a shortcoming of the models, but only one of many that are discussed in the literature. GCMs are physics based models, not statistical ones, the drift was corrected by better physics/resolution, not tuning. Your argument is a bit like saying the laws of planetary motion were the result of Darwinian evolution where Kepler's model eliminated the drifts from the earlier Copernican system, allowing him at the end to say triumphantly "look we don't have a long term drift in the predicted orbits of the planets anymore". Well duh, that is the way science progresses! Old models (heliocentric, Copernican) are replaced by better, more accurate ones (Kepler, relativistic corrections etc.). -
Gilles at 18:54 PM on 18 April 2011More Carbon Dioxide is not necessarily good for plants.
91 : Of course, no, Villabolo. I don't know. And I'm not claiming I do. I don't like to issue assertions I can't substantiate. -
villabolo at 18:49 PM on 18 April 2011More Carbon Dioxide is not necessarily good for plants.
@91 Dikran Marsupial: Sorry about that. I use bold tags in order to contrast my statements with those that I quote. -
Arkadiusz Semczyszak at 18:47 PM on 18 April 2011More Carbon Dioxide is not necessarily good for plants.
It is noteworthy example of this great area of uncertainty: Effect of soil moisture and co2 feedbacks on terrestrial NPP estimates, “Often, despite dramatic leaf level impacts due to climate changes, the natural ecosystem tends to buffer and does not show a dramatic response. Our analysis suggests that the interactions between the biotic and abiotic changes tend to have a compensatory /antagonistic response. This reduces the effect of the variable change on the overall system response. Our results indicate that the effect of soil moisture availability (and drought) is an important modulator of the terrestrial carbon cycle, and its impact for both present day as well as climatological feedback (under doubling of CO2 or ENSO like events) needs to be investigated.” -
Gilles at 18:41 PM on 18 April 2011Christy Crock #3: Internal Variability
DM : you don't understand what I'm saying. I'm not saying that all models present a significative drift. I said that many models have presented such drifts, that this has always been considered as a problem when it happened, so that models have evolved to avoid these drifts. You are saying that "models improved" - I'm just saying that the "improvement" has been quantified by an absence of drifts - and that the goal has been to AVOID them or correct them when they happen. don't you understand that this is quite like a darwinian selection, insuring that models converge towards an absence of drift ? and allowing to say at the end, triumphally : "look, we don't have any long term drift anymore without anthropogenic forcing" ? -
villabolo at 18:37 PM on 18 April 2011More Carbon Dioxide is not necessarily good for plants.
@78 Gilles: "Villabolo "For one who is very much into quantifying things to death," I like very much this one. You're right, beliefs are much easier when we don't care about quantifying. But sorry, I'm an annoying scientist, you know, the kind of those who wanted to know precisely what the orbit of Mars really is - who cares, actually ?" I care Gilles. That's why it's nice to quote people in full context and show the rest of the sentence that has been cut off in mid stream. Please notice the comma left hanging at the end of my sentence you quoted. Just for your information, when one quotes a partial sentence, something known as an ellipsis is placed after the end of that sentence in order to inform the reader that he is not reading the entire sentence. An ellipsis, in case you're wondering, looks like this ... Since I care about the question that followed my amputated sentence let me restate it by quoting my own post. Please notice the ellipsis. "For one who is very much into quantifying things to death, let me ask you, Gilles; what level of CO2 increase can be tolerated by plants until a point is reached that noticeably effects them?... Besides, do you know the levels of CO2 that where used in the experiments which gave the dramatic results? They are likely to be much higher than our current C2 levels." It would have been nice if you had answered my question but that's all right. It's gotten a bit stale. However, we can discuss Mars' orbital mechanics as soon as someone claims it affects Earth's climate.Moderator Response: [Dikran Marsupial] Please can you reduce the use of bold tags, it is equivalent to the all caps "shouting" that is against the comments policy. -
JMurphy at 18:36 PM on 18 April 2011More Carbon Dioxide is not necessarily good for plants.
To add to Bibliovermis's comments on Arkadiusz Semczyszak's link, some information from the paper itself : The PETM is associated with a large negative carbon isotope excursion recorded in carbonate and organic materials, reflecting a massive release of 13C-depleted carbon (4, 5), an ~5°C increase in mean global temperature in ~10,000 to 20,000 years (1), a rapid and transient northward migration of plants in North America (6), and a mammalian turnover in North America and Europe (7). Higher precipitation amounts could have been as important as high CO2. As already stated, it's a long time-period compared to now and higher precipitation may have been just as important. Also, I wonder how easily all those plants are going to migrate (and where to ?), and how we'll feel about a similar "mammalian turnover". -
Arkadiusz Semczyszak at 18:35 PM on 18 April 2011More Carbon Dioxide is not necessarily good for plants.
On this page, is briefly described the global food market.: “Food production more than doubled (an increase of over 160%) from 1961 to 2003. Over this period, production of cereals—the major energy component of human diets—has increased almost two and a half times, beef and sheep production increased by 40%, pork production by nearly 60%, and poultry production doubled.” -
Arkadiusz Semczyszak at 18:33 PM on 18 April 2011More Carbon Dioxide is not necessarily good for plants.
“To explain the observations, the carbon must have been released over at most 500 years.” -
ranyl at 18:32 PM on 18 April 2011More Carbon Dioxide is not necessarily good for plants.
The PETM tropical data above is all from one area in Northern South America and it got wetter and hotter by 3C but not into the critical region above 35c where tropical vegetation starts to becoem heat stressed. Considering that the ITCZ moves north when the NH warms (which it would with a burst of CO2 due to the NH greater land mass) this results are probably predictable and say nothing about the southern regions of Amazon. Also on the land sink it seems everyone seems ot forgetting that our land sink in the last 40 years has be greatly increased by artifical fertilization and the extra reactive nitrogen artifically boosting growth everywhere but also killing biodiversity everywhere so we have to stop using it loads and so by by land sink! -
Gilles at 18:32 PM on 18 April 2011More Carbon Dioxide is not necessarily good for plants.
(closing tag added) Marcus : correlation is not a proof of causation, but absence of correlation (or even negative correlation) is still worse ! and I don't see any hint that the increase of CO2 has made the yield of crops decrease in the world- since it has simply not decreased. I have no idea what beetles like, and maybe the defenses of the particular species they studied are weakened by more CO2 - but they don't give the final result on the total yield (do the damages made by beetles offset the increased yield or not ?), and of course there is nothing like a global estimate at a worldwide scale. Again, adding a set of cherry picked drawbacks doesn't say anything on the final result - with this method you can demonstrate what you want. -
Dikran Marsupial at 18:31 PM on 18 April 2011Christy Crock #3: Internal Variability
Giles@95 Modern GCMs, have not included flux adjustments for a very long time. If you read the Wikipedia article rather than quote mining, you will see that they are talking about the 2001 TAR, which means they are talking about models in use over a decade ago. Things have moved on significantly from there. The really funny thing though, is that if you actually read the page in the report you linked to in message 96, you will find that it says (bear in mind it was published in 2005, so they are talking about models of late 1990 to early 2000 vintage): "Until recently [DM emphasis mine], it has been necessary to used so-called flux adjustments (or "flux corrections", Sausen et al 1987) to prevent drift in the climate of the coupled system that arises from the inadequacies in the component modules and in the simulated fluxes at their interfaces" You do know what "Until recently" means don't you Gilles? Also if you read the rest of that paragraph, you will find that were the flux adjustments were still being used in the early 2000s, the corrections had been getting smaller as the models improved, and that the IPCC had found no systematic bias in the climate variability between models where the flux adjustments were used and where they were not and that both types of models are useful for attribution studies. Your own source suggests that drifts are correctable and do not pose a problem. You have made a fool out of yourself by your quote mining. Next time see if the material is (i) up to date and (ii) actually does support your assertions. -
chek at 18:21 PM on 18 April 2011Muller Misinformation #3: Al Gore and polar bears
Presumably, as it's the latest in political fashions, Muller's remarks were not intended to be taken as "factually accurate". Together with the ( -snip- ) Watts as UHI "hero" compliment, that's two strikes down so far.Moderator Response: [DB] Inflammatory term snipped. -
Bibliovermis at 18:16 PM on 18 April 2011More Carbon Dioxide is not necessarily good for plants.
"Rapid" is in geologic terms, and in the case of the PETM means ~20,000 years. The PETM was the cause of a global mass extinction event. That temperature change over 20,000 years is a viable likelihood in a matter of centuries in an unabated business-as-usual scenario. -
Arkadiusz Semczyszak at 18:14 PM on 18 April 2011Solar Hockey Stick
For Dana1981 - who likes “simple calculations”. The Sun - current solar “hockey stick” - what does this mean for the present warming? We know already - with my comment above (63) and Berenyi Péter (75), that the The sun - to change its activity - it works on the climate of delay - “lag”. Thus, TSI decline after 1985 is no argument that this “is not The sun”. Well, but for example, Lockwood - indeed - cites: “... the current grand maximum has already lasted for an unusually long time ...”. Despite this adds: “However, the popular idea (at least on the Internet and in some parts of the media) that solar changes are some kind of alternative to GHG forcing in explaining the rise in surface temperatures has no credibility with almost all climate scientists.” Why? “In other words, the feedback must essentially double the GHG forcing if they are the cause of the GMAST rise. On the other hand, our best estimate of the first term on the right-hand side of equation (10.1) is 0.23 W m−2 (ΔITS=1.3 W m−2). If the analysis of Scafetta (2009) were correct and 65 per cent of the observed warming were due to solar effects, then the first term on the right-hand side of equation (10.1) plus the feedback would need to supply 0.65×5.15=3.35 W m−2. In this case, the feedback must supply 3.35−0.23=3.12 W m−2, which means that they need to explain an amplification of the solar input by a factor of 13.5.” Full agreement. However, as it was before? The like changes in temperature - as now - most probably, we observed in the Holocene (especially the middle Holocene), the above-defined variability of the Sun. At least once in the Holocene (perhaps several times), comparable to the "... solar input by a factor of 13.5. ... "certainly has been achieved! Connection - allegedly our GHG - and react to changes in the TSI for temperature changes in the Holocene, gives absurd results. professor Shaviv: “According to the IPCC (AR4), the solar irradiance is responsible for a net radiative forcing increase between the Maunder Minimum and today of 0.12 W/m 2 (0.06 to 0.60 at 90% confidence). We know however that the Maunder minimum was about 1°C colder ...”, “This requires a global sensitivity of 1.0/0.12°C/(W/m 2 ). Since doubling the CO 2 is thought to induce a 3.8 W/m 2 change in the radiative forcing, irradiance/climate correlations require a CO 2 doubling temperature of ΔT x2 ~ 31°C !!” Well, unless we accept the data - changes in TSI - from this analysis: Jeffrey A. Glassman, PhD, However, the balance of feedback for a doubling of CO2 would be only slightly positive or even negative. It is true that a simple calculation? Of course, the only alternative is a combination of solar and GHG (as one of the effects of second-order) to explain the change in temperature in the mid-Holocene or MCA / LIA. Frank et al., 2010.: “ ... a 50-year CO2 response lag—such timing is consistent with modelled CO2 response to a temperature step change. [for pre-industrial 1050–1800 period]” The temperature is delayed to the sun - an increase in TSI. Changes p.CO2 delayed against temperature. According to ice cores, however, changes in CO2 in this period were small (c. 10 ppmv). Nevertheless, the effect of Sun + CO2 (+ other "second-order effects") - similar to today! How? Something does “not fit” in these "simple calculations" ... The concentration of CO2 in the atmosphere - especially his change - had to be bigger than it used to show the cores. I would suggest to "throw away" data by ice core CO2 (and those by cores from the bottom of the ocean - as well). I propose to also adopt the proposed by me - many times here - the deep ocean CO2 + higher sensitivity of soil (respiration) on temperature ... I recall the most recent reference is apropos of the latter: Suseela et al., 2010.: “Soil respiration is the largest flux of carbon dioxide to the atmosphere, releasing more [several times - 98 +/- 12 PgC / 8-9 Pg C ] carbon than fossil fuel combustion.” “... even a small warming-induced increase in carbon dioxide emission from soils could act as a positive feedback to climate change.” Karhu et al. 2010.: “Compared to the method used for current global estimates (temperature sensitivity of all SOC equal to that of the total heterotrophic soil respiration), the soils studied will lose 30-45% more carbon in response to climate warming ...” Dorrepaal et al., 2009.: “Climate warming therefore accelerates respiration of the extensive, subsurface carbon reservoirs in peatlands to a much larger extent than was previously thought ...” The steady increase in "strength "of the sun for a long time = constant small increase in temperature = increase in soil respiration + deep ocean - for example by upwelling = 80-90% current rise in CO2 + other effects of second order = continued increase in the temperature ... The stronger the sun is the increase in volcanic activity - a decrease of ozone in the stratosphere - the reduction in marine algae (possibly caused also by warming) - the increase in frequency of El Nino - another feedback causing a natural increase in CO2 ... -
Dikran Marsupial at 18:08 PM on 18 April 2011Christy Crock #3: Internal Variability
Giles@94 Blatant trolling again, if you knew what you were talking about you would know when they needed to correct them. You have no evidence that any of the models actually were corrected, just that there was a suggestion from the organisers of the project that a control run were made for those models where it was thought it might be necessary so that any drift could be corrected if required, and you are presenting it as if that implied that the models actually did exhibit a drift. I was merely applying the same sort of pedantry to your arguments that you have used on virtually every thread to which you have "contributed". Now, if you have a reliable source e.g. a peer-reviewed paper that shows that these drifts are actually a problem, then lets see it. It is time to "Put up, or shut up". -
villabolo at 18:05 PM on 18 April 2011More Carbon Dioxide is not necessarily good for plants.
@65 LukeW: Luke, I didn't have a chnce to respond to all of your points in post #75 but I can't believe I missed this one (!?) "In fact given the IPO change - expect a cracker decade for Australian rainfall ahead - more Las Ninas and stronger ones. Boom time for producers?" ??????????????????????????????????????????????????
Are you aware of what those rains did to Australia recently? Of course, even if it had not downgraded a sizeable portion of the wheat crop to animal feed status, look at the wonders it has done for Australia in general. Like flooding an area the size of Texas.
John Cook would be pleased.
And you want those La Ninas to get stronger?
It looks like it's going to be a boom time for the rowboat industry.
Moderator Response: [Dikran Marsupial] tags fixed (hopefully correctly).
??????????????????????????????????????????????????
Are you aware of what those rains did to Australia recently? Of course, even if it had not downgraded a sizeable portion of the wheat crop to animal feed status, look at the wonders it has done for Australia in general. Like flooding an area the size of Texas.
John Cook would be pleased.
And you want those La Ninas to get stronger?
It looks like it's going to be a boom time for the rowboat industry.
Moderator Response: [Dikran Marsupial] tags fixed (hopefully correctly). -
Gilles at 18:04 PM on 18 April 2011Christy Crock #3: Internal Variability
other example : http://books.google.fr/books?id=52zXIwAUVa8C&pg=PA105&lpg=PA105&dq=drift+climate+simulation&source=bl&ots=TmfA5d7tCl&sig=UwM6f2N-Xd7l-vRw5LPFLUfwK9Q&hl=fr&ei=u-6rTez5G5SChQf8l4DOCQ&sa=X&oi=book_result&ct=result&resnum=3&ved=0CC0Q6AEwAg#v=onepage&q=drift%20climate%20simulation&f=false clearly enough, drift has always been a problem and models have evolved to avoid the drifts meaning that there has been a selection bias leading computer scientist to favor models with low drifts as the "best ones". I don't think you can reasonably deny that.Moderator Response: [muoncounter] Please do not use search text in place of actual citation. -
Gilles at 18:01 PM on 18 April 2011Christy Crock #3: Internal Variability
http://en.wikipedia.org/wiki/Global_climate_model "Many of the non-flux adjusted models suffered from unrealistic climate drift up to about 1°C/century in global mean surface temperature." so my question is : when you use "flux adjusted" models, what do you adjust and how ? -
Gilles at 17:56 PM on 18 April 2011Christy Crock #3: Internal Variability
sorry but what you say is quite unclear : what does "may be corrected" mean ? - when do we need to correct them ? note that a drift cannot be indefinite since it would lead eventually to unreasonable high temperatures - so it can only be a part of a very long oscillation - much longer than the duration of the run. It is a "drift" just because our capabilities of computation do not allow to compute a long enough time to see the oscillation - do you agree with that ? -
Arkadiusz Semczyszak at 17:53 PM on 18 April 2011More Carbon Dioxide is not necessarily good for plants.
Effects of Rapid Global Warming at the Paleocene-Eocene Boundary on Neotropical Vegetation, Jaramillo et al. (28 coauthors !), 2010.: “We observed a rapid and distinct increase in plant diversity and origination rates, with a set of new taxa, mostly angiosperms, added to the existing stock of low-diversity Paleocene flora.“ “The tropical rainforest was able to persist under elevated temperatures and high levels of atmospheric carbon dioxide, in contrast to speculations that tropical ecosystems were severely compromised by heat stress.” So as can see the above post still is just speculation ... -
chris1204 at 17:45 PM on 18 April 2011Muller Misinformation #3: Al Gore and polar bears
Thank you Albatross :-) CBD: And vast areas about which we have inadequate data coupled with three contiguous areas, one growing and two stable. The populations here are not modest. It's important to consider why one area is actually growing not for the purposes of point scoring but to work out if we're doing something right somewhere. More intriguing, why don't we have enough data about Fern Basin given the wealth of data for the rest of Canada? -
Marcus at 17:30 PM on 18 April 2011More Carbon Dioxide is not necessarily good for plants.
So I guess the point is that-*maybe* increased carbohydrate in soybean leaves in making them more attractive to these beetles (the researchers were pretty vague on whether this was, in fact, the case) but the *real* problem is that the plant has a far reduced ability to defend itself from these attacks-meaning that the beetles will be able to breed & feast more effectively. Hardly a *positive* for agriculture.
Prev 1778 1779 1780 1781 1782 1783 1784 1785 1786 1787 1788 1789 1790 1791 1792 1793 Next


