


 Arguments


Recent Comments
Prev 1785 1786 1787 1788 1789 1790 1791 1792 1793 1794 1795 1796 1797 1798 1799 1800 Next
Comments 89601 to 89650:
-
Albatross at 01:29 AM on 8 April 2011Geologist Richard Alley’s ‘Operators Manual’ TV Documentary and Book… A Feast for Viewers and Readers
Earth: The Operator’s Manual is a very exciting project, and I very much look forward to reading the book and watching the series. Here is a challenge to all here. So far I have emailed the ETOM URL to 9 academics across North America (and one in Africa), as well as someone associated with an NGO. A very modest tally, so it should be easy to beat. I also plan on emailing it to members of parliament. Come on SkS readers, let us spread the word. Do I hear a 20? -
Alexandre at 01:21 AM on 8 April 2011Call for beta testers of the latest SkS Firefox Add-on
I'd like to test it too. Please send me one, John.Response: Sent, thanks -
CBDunkerson at 01:17 AM on 8 April 2011Arctic Ice March 2011
Moderator on #172. Right, allow me to rephrase: I made statements about actual Arctic temperature anomalies shown in the Kaufman graph (which showed both actual and proxy values) attached to post #158. In #169 Gilles suggested that this indicated I 'can't really read a figure' and used a new Kaufman graph, showing only proxy values, to 'refute' my numbers. I do not find this argument compelling.Moderator Response: [Dikran Marsupial] Once pointed out, neither did I. However this thread seems in need of more moderation than most [which is why I have had to withdraw from active discussion], and removing some of the heat from the discussion will encourage a more rapid return to scientific issues. So please can we all stick ultra-strictly to the comments policy. -
Bob Lacatena at 01:03 AM on 8 April 2011Arctic Ice March 2011
171, Gilles,could you please show me a post where I said there was no Global warming ?
Please point to any one post of yours in the past year when you have demonstrated complete agreement with some aspect of current climate science....could you please show me a post where I said that "everything" was either random or cyclical ?
Please point to any one post of yours in the past year when you've not taken that position on any issue.winter extent and summer extent are poorly correlated
Irrelevant and a good example of your constant obfuscation. This is exactly my point, that there is no correlation between the two. Winter ice extent recovers close to 100%, but it is an illusion, because the ice is thin so the summer extent depends on winter volume as spring/summer temperatures, not winter extent or winter temperatures. Since the two are entirely separate, of course there's no correlation between the two. I think this is pretty obvious to everyone, so why do you bring it up?just try to correlate the variation of sea ice extent or area and the variation of average temperature of the Earth, and show me the correlation.
Again, science isn't done only by correlation, but by hypothesis, experiment, and confirmation or refutation. The hypothesis is that warming temperatures will reduce summer ice extent through the mechanisms described. Observations show global temperatures increasing and summer ice extent retreating, completely in line with the hypothesis. Look at your own graph in post 158. See how the temperatures spike up? And the ice extent spikes down? That is called a correlation. To get more specific, however, while viewed from a distance global temperatures appear to have risen consistently over the past century, in fact the increase in the past 3 decades has been markedly higher. More importantly, the distribution is not even. Warming at the poles is much greater in the past three decades, particularly in spring. Consider: 1940-1950 spring warming by latitude (note the scale, not the curve alone): 2000-2010 spring warming by latitude (more than double 1940-1950):
 1940-1950 summer warming by latitude (note that the north pole actually demonstrated cooling!):
 2000-2010 summer warming by latitude (note that while warming is less, exactly as expected by GHG theory, it is still positive rather than negative):
 I think that pretty decisively explains why we're seeing retreating extent now and not earlier in the century, despite apparent global warming (but not necessarily significant polar warming) over the entire period.
-
bibasir at 00:58 AM on 8 April 2011Geologist Richard Alley’s ‘Operators Manual’ TV Documentary and Book… A Feast for Viewers and Readers
Someone needs to post a review on Amazon. There is only one review with a short paragraph of denier points. I ordered the book and will post a review after I read it. -
Albatross at 00:56 AM on 8 April 2011Arctic Ice March 2011
RE the melting of sea ice, and claims that it melts from below. It can melt from above and below, and melt ponds are a mechanism by which the surface albedo is lowered, leading to a positive feedback process for melting. From NSIDC: "Sea ice melts during the summer when solar radiation heats the ice surface.....After the snow starts to melt, melt ponds form, and because water has a lower albedo than snow, the surface albedo of sea ice with snow and melt ponds drops to about 0.75 (75% solar radiation reflected). As the melt ponds grow and deepen, the albedo continues to decrease, leading to higher absorption of solar radiation and an increased rate of melting. Energy to melt ice can come from sources besides direct solar energy. Water that is under the ice and that has a temperature above the freezing point causes the bottom surface of the ice to melt. Warm surface waters cause the edges of the ice to melt, particularly in leads and polynyas." [Satellite-derived surface temperature trends for 1981-2003 Source Earth Observatory]
 [from Earth Observatory]
From EO link:
"The maps also show that, in most areas, the date of freeze onset is changing more than the date of melt onset. The scientists say this pattern is consistent with a climate process known as the ice-albedo feedback. Dark ocean water absorbs more sunlight than bright, reflective ice. Even a small change in the start of the melt season exposes the ocean to more incoming sunlight, which warms the water, which melts more ice, and so on. The more solar energy the ocean absorbs during the summer, the longer it takes in the fall for the water to cool down enough to freeze."
Arctic SST anomalies:
[from Earth Observatory]
From EO link:
"The maps also show that, in most areas, the date of freeze onset is changing more than the date of melt onset. The scientists say this pattern is consistent with a climate process known as the ice-albedo feedback. Dark ocean water absorbs more sunlight than bright, reflective ice. Even a small change in the start of the melt season exposes the ocean to more incoming sunlight, which warms the water, which melts more ice, and so on. The more solar energy the ocean absorbs during the summer, the longer it takes in the fall for the water to cool down enough to freeze."
Arctic SST anomalies:
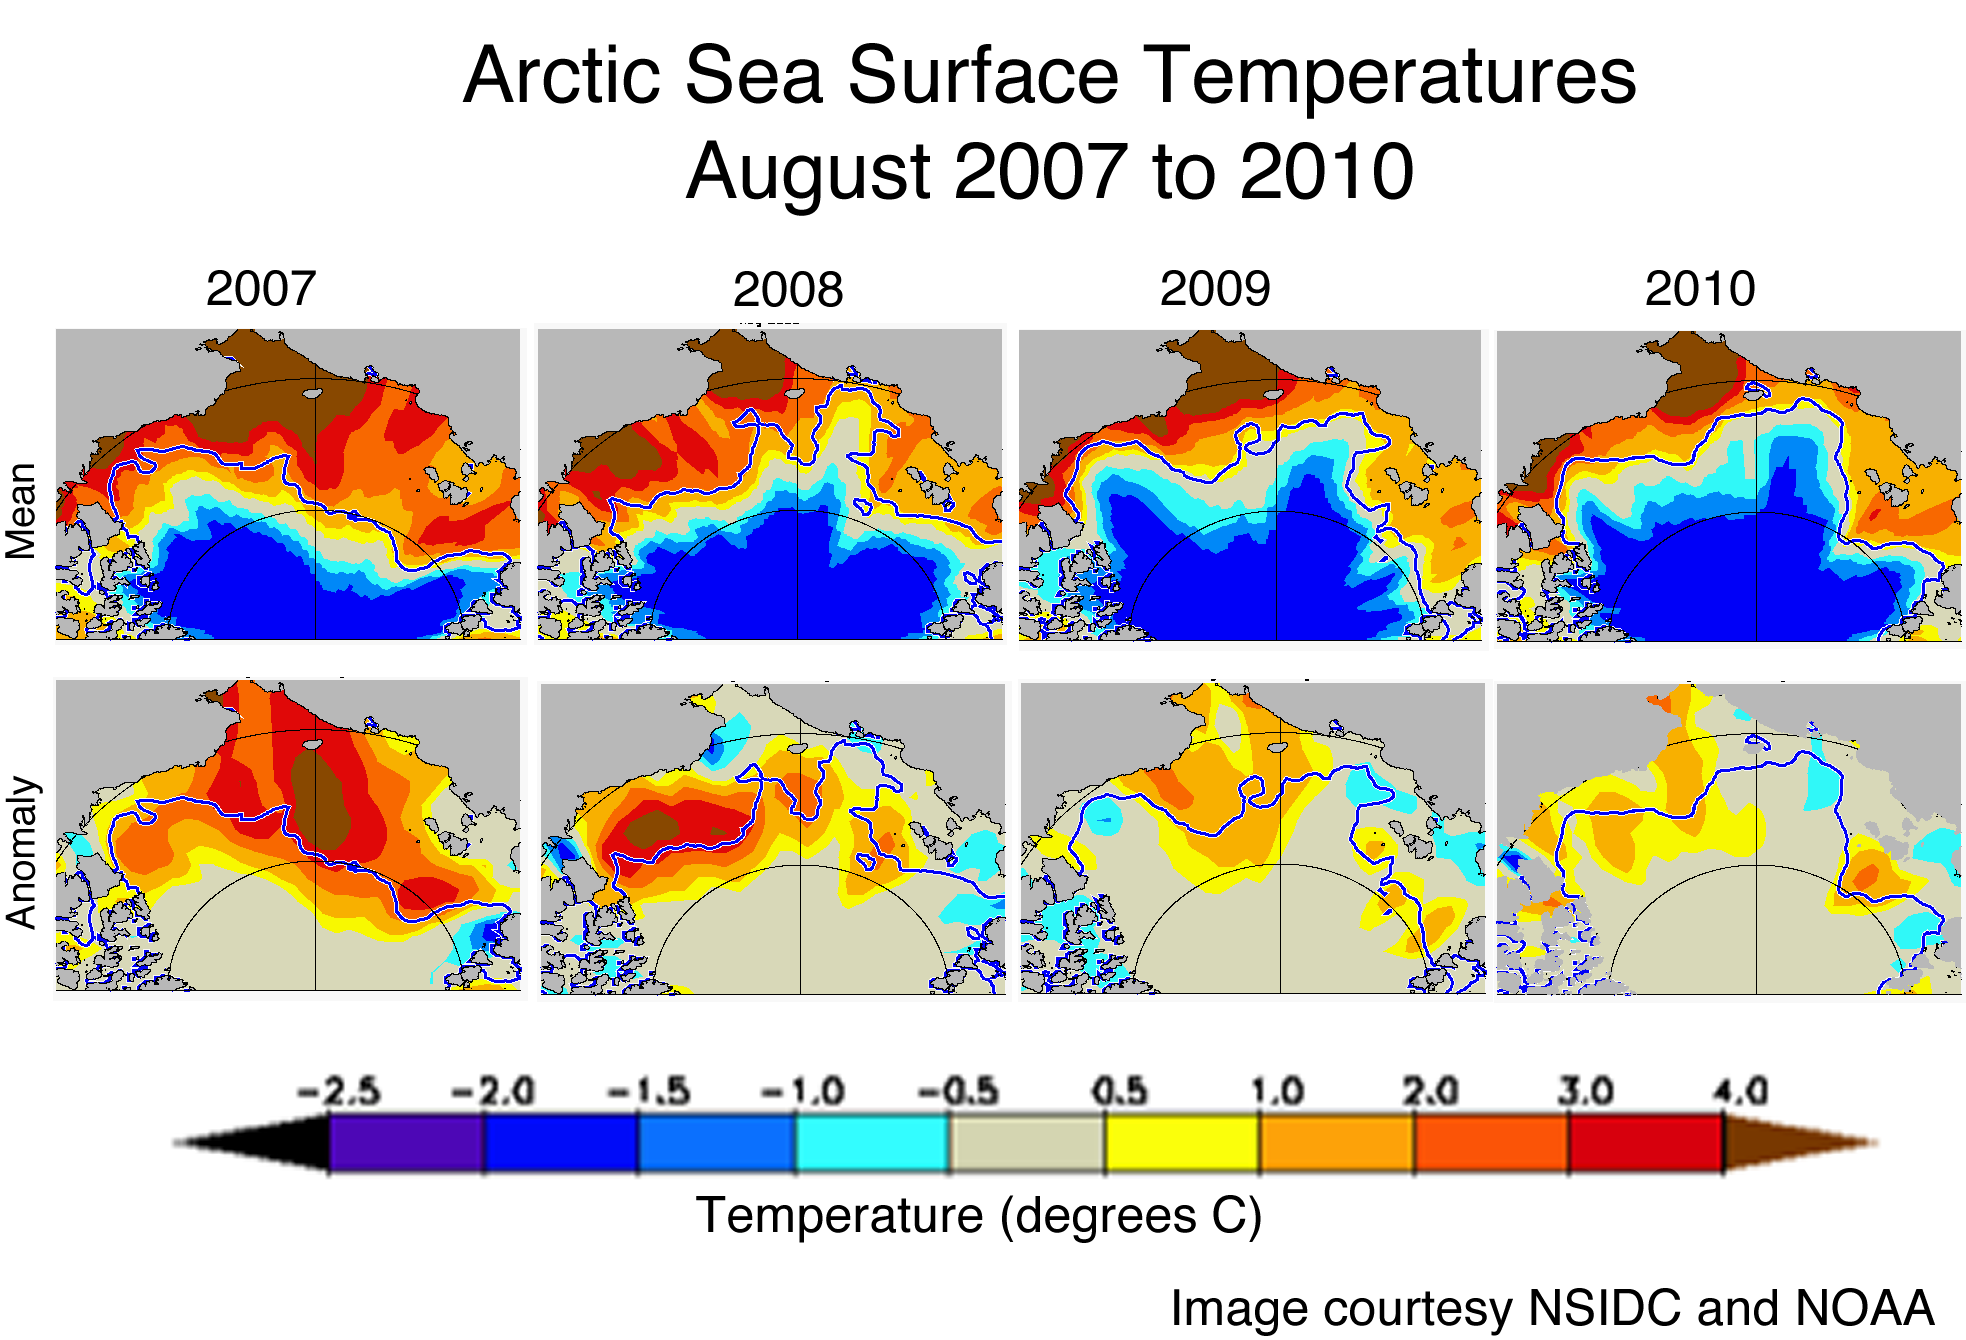 [Source NSIDC]
From above NSIDC link:
"The high sea surrface temperatures resulted largely from the loss of sea ice: dark open water areas absorb more solar radiation than reflective ice. The warmer water in turn helps to melt more sea ice. This positive feedback likely contributed to the ice loss through summer 2010, especially late in the season when surface melt had largely ceased."
[Source NSIDC]
From above NSIDC link:
"The high sea surrface temperatures resulted largely from the loss of sea ice: dark open water areas absorb more solar radiation than reflective ice. The warmer water in turn helps to melt more sea ice. This positive feedback likely contributed to the ice loss through summer 2010, especially late in the season when surface melt had largely ceased."
-
CBDunkerson at 00:44 AM on 8 April 2011Arctic Ice March 2011
Gilles: "Can't you really read a figure ?" I can read the part where the first graph had both proxy and actual temperatures while the second includes only the proxies. [snip] >plonk<Moderator Response: [Dikran Marsupial] Please no accusations of duplicity. It is best to apply Hanlon's razor, in such circumstances. I have edited rather than deleted as the scientific point is a good one (unless Gilles can provide a reason why we should trust a proxy reconstructions over direct observations). -
Daniel Bailey at 00:34 AM on 8 April 2011Geologist Richard Alley’s ‘Operators Manual’ TV Documentary and Book… A Feast for Viewers and Readers
His "Greatest Knob" talk can be found here, for the interested. Off-topic, but inspired, is another talk by the selfsame Alley which shows his genius at communication. The Yooper -
Alexandre at 00:02 AM on 8 April 2011Geologist Richard Alley’s ‘Operators Manual’ TV Documentary and Book… A Feast for Viewers and Readers
I'm an Alley fan since I came across his "Greatest Knob" lecture on the net. He's quite a character, really charismatic. It's the kind of outreach this issue needs. I'll definetly watch it. -
KR at 23:57 PM on 7 April 2011Upcoming book: Climate Change Denial by Haydn Washington and John Cook
h pierce - Replacement fuels are "pie in the sky"? An interesting statement, but I think the facts contradict it. For example: I've been following Swift Enterprises progress in that regard. They are working on a biomass fuel to replace 100LL gasoline for small, prop driven planes in the US and around the world. The fuel appears fully functional as a replacement, economical to produce (competitive pricing), without added leading (required by the 15-60 year old engine designs in many private planes). It's currently undergoing testing towards certification as a legal replacement. It does, apparently, smell like old sweat socks, but that's the only drawback I've heard of yet. This is a good place for such developments - start in a limited market with higher prices (since 100LL is a tiny fraction of production), bootstrap up from there. And Swift isn't the only company in the business. -
Arkadiusz Semczyszak at 23:37 PM on 7 April 2011Has sea level rise accelerated since 1880?
Absolutely no denying the negative impact of raising the sea level, but I would like to post a few remarks. At the beginning of some “Sisyphean” working. @Tom Curtis Be very careful in interpreting the sea level during the Eemian. Another - the greater was the weight of the glaciers in the NH continents during the glaciation preceding the Eemian - another "post-glacial rebound”. In addition: “This may have been due to the fact that a large part of the ice sheet that today covers the western part of Antarctica did not yet exist.” “In the northern hemisphere, insolation was much higher than today during the summer months, and much lower during the winter ones, making seasonal contrasts much more acute.” (ibidem). Are also disputed the average global temperature Eemian - could be a more than 1-2 degrees C - more than - on average - in the twentieth century. Is the current rate of sea level rise - “what’s the big deal?” Looking at the Holocene - we can say: “During this ~5000 year period of high sea level, growth hiatuses in oyster beds and tubeworms and lower elevations of coral microatolls are interpreted to represent short-lived oscillations in sea-level of up to 1 m during two intervals, beginning c. 4800 and 3000 cal yr BP. The rates of sea level rise and fall (1–2 mm yr-1) during these centennial-scale oscillations are comparable with current rates of sea-level rise.” ... and the future (based on an understanding of the past)? - a problem to a separate discussion. I recommend especially the last sentence: ... "that there is much about interpreting the geologic record of sea-level variation that we still do not understand. (...)."Moderator Response: [DB] And I especially like this sentence from earlier in your last linked source: "it could have risen quite quickly, as much as 2 meters per century, says geochemist and lead author Jeffrey Dorale". You assume SLR will be linear while your last linked source shows that it most likely was not. Hansen 2011 speaks to nonlinear destabilization of the ice sheets, with multiple meters of SLR occurring globally as a result. It may not be what you want to read, but the true skeptical mind considers more than just that which supports their position, to avoid confirmation bias. -
Gilles at 23:35 PM on 7 April 2011Arctic Ice March 2011
"Your position (No Global Warming):" could you please show me a post where I said there was no Global warming ? "Everything is either random or cyclical" could you please show me a post where I said that "everything" was either random or cyclical ? "We can't know anything" do you think we know everything ? [Discussion of scientific background snipped] "Ice melts from above due to warmer air Ice melts from below due to warmer water" I admit that ice rarely melts because it's getting colder. "Less ice refreezes over winter, so the depth is less, although the extent is the same" first winter extent and summer extent are poorly correlated. Second all the peripheric ice is one year old, as I said - so the depth doesn't vary much in the outer parts. I will not comment all the other sentences : just try to correlate the variation of sea ice extent or area and the variation of average temperature of the Earth, and show me the correlation. and again, how much of your comments does belong to the category of "ad hominem " comments ?Moderator Response: [DB] Please look up the definition of "ad hominem". [Dikran Marsupial] I have already warned you that discussion of your science background is irrelevant and off-topic, I have snipped it this time, next time I will just delete the post. -
DSL at 23:32 PM on 7 April 2011Human CO2 is a tiny % of CO2 emissions
Aye, Tri1cky--but the thing is that we're not going to be able to do anything about it until we've convinced the people who run the democracies that we are the problem. We are the problem. We're dumping massive CO2 into the atmosphere. Want to solve the problem? Stop dumping massive CO2 into the atmosphere. Or find a way that allows the CO2 to be taken out of the atmosphere at the rate it's being dumped (or slightly greater). There are threads for habitability here, here, and here. -
Bob Lacatena at 23:23 PM on 7 April 2011Arctic Ice March 2011
Gilles,.... could you explain the big difference in the post-1900 behavior of these two curves ?
Yes, because the warming at the poles in the past 30 years has been dramatically greater than during the 1900-1940 period (by GISTEMP, roughly 1.7˚C versus 0.7˚C). Look, this is very simple. Your position (No Global Warming):- Everything is either random or cyclical
- We can't know anything
- You are a scientist
- Ice melts from above due to warmer air
- Ice melts from below due to warmer water
- Less ice refreezes over winter, so the depth is less, although the extent is the same
- Thinner ice melts faster
- Summer ice extent has been dropping at an accelerating rate since the onset of serious global warming
- Temperatures keep rising so each year the ice melts sooner
- Open ocean absorbs more heat than ice, providing a positive feedback (i.e. warming the planet further)
- You are a random/cyclical voice that repeatedly posts tiresome denial talking points at SS and RC, flavoring them with just enough detail and scientific language to give them an air of knowledge and superiority, while simply ignoring anything that anyone says that you can't easily obfuscate, or that exposes your obfuscation for what it is.
- Because you ignore the points you can't obfuscate, but throw together huge diatribes where obfuscation is easy, you pollute entire threads with what appears to be reasonable debate, but is really merely part of your ongoing, unending effort to confuse the people for whom the facts behind any issue are not already painfully clear.
-
Gilles at 23:19 PM on 7 April 2011Arctic Ice March 2011
CBDunkerson : "If you actually measure out the years between 1500 and 2000 I think you'll find that the relevant values are (to the nearest 0.1 C); 1900: -0.2 1950: 0.0 2000: 1.0" It's a pity that we loose so much time on so simple things. ( -Baiting comment snipped- ) I read
1900: -0.4
1950: 0.2
2000: 0.3
so actually 85 % of the 1900-2000 increase occured before 1950, where apparently sea ice hardly varied.
"Also: "And the biological proxies that are essentially summer responsive do show a much clearer increase at the beginning of century than now"
Source?"
uuuh ! Kaufman et al. 2009 !!! just said it.
"It all depends on what the dominant factors driving recent ice decrease have been."
( -Baiting comment snipped- )
Moderator Response: [DB] Kaufman et al 2009 does not say what you think it says nor mean what you say it means. I suggest reading it, not a news story based on it. And please refrain from baiting (no more warnings). To all: Please only reply to the portions of Gilles'comments with substance; we will deal with the rest.
I read
1900: -0.4
1950: 0.2
2000: 0.3
so actually 85 % of the 1900-2000 increase occured before 1950, where apparently sea ice hardly varied.
"Also: "And the biological proxies that are essentially summer responsive do show a much clearer increase at the beginning of century than now"
Source?"
uuuh ! Kaufman et al. 2009 !!! just said it.
"It all depends on what the dominant factors driving recent ice decrease have been."
( -Baiting comment snipped- )
Moderator Response: [DB] Kaufman et al 2009 does not say what you think it says nor mean what you say it means. I suggest reading it, not a news story based on it. And please refrain from baiting (no more warnings). To all: Please only reply to the portions of Gilles'comments with substance; we will deal with the rest. -
gallopingcamel at 23:15 PM on 7 April 2011Geologist Richard Alley’s ‘Operators Manual’ TV Documentary and Book… A Feast for Viewers and Readers
Alley has something that is very useful in academia. He is very good at communicating with the general public. He is also approachable. If you send him an email there is a high probability that you will get a reply. I may not agree with him but I like his style. -
Bob Lacatena at 23:04 PM on 7 April 2011A Flanner in the Works for Snow and Ice
Ken Lambert, "I cannot see how the high latitude areas of the Earth at incidence angles of +23 to -23 degrees could have the same area portion of heat gain as the tropics." Yes, Ken, we know that. We've tried repeatedly to explain it to you and you just can't (won't?) get it. No need to keep going back there.
-
CBDunkerson at 23:02 PM on 7 April 2011Arctic Ice March 2011
Gilles: "The graph from Kaufman et al. 2009 that I reproduced just above obviously contradicts this assertion." Let me guess, this is based on a 'highly scientific' eyeballing of the chart? If you actually measure out the years between 1500 and 2000 I think you'll find that the relevant values are (to the nearest 0.1 C); 1900: -0.2 1950: 0.0 2000: 1.0 So no, that graph does not 'obviously contradict' my statement that the more recent warming has been much greater. Also: "And the biological proxies that are essentially summer responsive do show a much clearer increase at the beginning of century than now" Source? Finally: "Fine : so please can you predict the trend , say, in the 10 next years, and how ?" Actually, I'm of the school of thought that the Arctic ocean will be largely ice free at the annual minimum by then. A decent writeup on this position can be found here. The next three years or so should clear up alot of the remaining uncertainty about where Arctic sea ice is headed. Best case scenario, the volume will level off soon and we can then look forward to a longer slow decline down to largely ice free in September around 2035. On the other hand, if volume continues to drop at anything like the rate it has been then we'll be seeing ice free Septembers by around 2015. It all depends on what the dominant factors driving recent ice decrease have been. To my thinking the data since 2007 suggest that increasing influx of warm water and stronger currents have become the most significant factors, and thus we are likely to see continued declines. If, on the other hand, direct greenhouse warming of the Arctic region is still the dominant driver then we'd see a more gradual decline (though it then becomes difficult to explain the recent sharp drops). -
daniel maris at 22:53 PM on 7 April 2011Has sea level rise accelerated since 1880?
Muoncounter Well from your point of view, my approach is not a problem since I support a swift march to 100% renewable energy use starting now. I think we could do it within 20 years if we had the will. The latest from Israel where they are trialling battery changing statinos for cars suggests the range problem with electric vehicles has been resolved, so we can now look at a more or less complete and all-embracing solution. My reasons for favouring 100% renewables are many and various but do include a precautionary approach to altering carbon levels. But to adopt a precautionary approach is not the same as saying I buy into the reality of AGW yet. My view is that sea level rises would happen sufficiently slowly for humanity to react effectively. No relation to that Maris! -
les at 22:45 PM on 7 April 20112nd law of thermodynamics contradicts greenhouse theory
979 Tom - "What more could we ask for..." I wait, with trepidation, to find out! To me, it all seems so straightforward. Still, just because this discussion has certainly not gone on long enough - nor has it been repeated nearly sufficiently enough times on nearly enough blogs - can I suggest a further place for doubt? It turns out that in many multiverse models it is not clear that conservation of energy holds for the whole universe nor, indeed, for every universe. As such, I'm guessing I admit, it should be possible to have infinitely many universes in which the 2nd law doesn't hold, or possibly doesn't hold only for those gases which don't transmit/radiate/absorb evenly at all wavelengths or something. see, always room for doubt. -
Tom Curtis at 22:42 PM on 7 April 20112nd law of thermodynamics contradicts greenhouse theory
Fred Staples @976, I believe Les has adequately rebutted your comments about SOD.For any spontaneous transaction, anywhere in the known universe, the change in entropy must be positive.
This is incorrect. The Earth is infested with a spontaneous transaction which results in the formation of very low entropy products. It is called life. Of course, if you look at all energy flows involved in life, then the net entropy of the whole system increases, even though that in the living system decreases temporarily. So, only when we account for all energy flows within a boundary can we apply the 2nd law to the system within the boundary, and then it applies only to the entropy of the whole system, not to any arbitrary subpart of the system. As the worked example quoted above shows, when all energy flows are accounted for, the interchange of energy between Earth and atmosphere including back radiation involves a net gain in entropy, and hence no second law violation. And the second law applies only to the whole system, not to any arbitrary subpart - say, the backradiation alone."Now if a quantity of energy deltaQ leaves the atmosphere at a temperature Ta, ..."
Plainly your accounting considers only one energy flow within the system, not all of them. Therefore it is an attempt to apply the second law to an arbitrary subpart of the system rather than to the system as a whole, which is as explained above, a misapplication of the second law. -
MichaelM at 22:34 PM on 7 April 2011Arctic Ice March 2011
Prior to 1940 there seems not to be great deal of variance from: Winter 1 - 15 (Million sq k) Summer 1 - 11 Winter 2 - 15 (4 million k new ice) Summer 2 - 11 ... So 11 million k got to be multi-year ice i.e not "most of the ice in winter is just 6 months old anyway, every year". That we have less multi-year ice now is symptomatic of the problem. Or the above usage of 'most' could be just a language thing. -
Ken Lambert at 22:29 PM on 7 April 2011A Flanner in the Works for Snow and Ice
Tom Curtis #42 "Frankly, the implied dictum that you should only present some relevant information if you can present all relevant information is nonsense. What is more, it not one you adhere to, for if you had, you would not have made an argument based solely on the minimal relevant information of relative surface area of the arctic to the globe." Tom, wilfully leaving out relevant information of which you are aware simply is a distortion of the case to suit a particular bias. I did not rely 'Only on the surface area' of the Arctic to make my points. I quoted the calculations of the leading energy balance scientist in this field - Dr Trenberth. You say that Flanner has calculated that the heat sequestered in the Arctic is something like 9-10E20 Joules/year instead of 1E20 Joules/year from Trenberth's melting Arctic ice. The difference is supposed to be in the ocean. Well - where is your measurement of that? By the way if the imbalance portion is in fact 9-10E20 rather that 1E20 Joules/year then you were only wrong by 15 times rather that 149 times in your claim. I would like to see you out by only 100% rather that 1500% - however we can't have it all. If Dr Trenberth's 145E20 Joules/year net heat gain to the Earth was evenly distributed all over the surface then the Arctic's 4.4% would account for 6.4E20 Joules/year, which is still less than the 9-10E20 Joules/year claimed in Flanner. I cannot see how the high latitude areas of the Earth at incidence angles of +23 to -23 degrees could have the same area portion of heat gain as the tropics. -
Tom Curtis at 22:24 PM on 7 April 20112nd law of thermodynamics contradicts greenhouse theory
Les @977, an excellent read, and profitable for anyone following this debate. I particularly liked propater's comment:"If you take ScienceOfDoom example 3 and reverse it to consider radiation emmited by the atmosphere and absorbed by the earth’s surface, you can see that entropy is lost when the radiation from the atmosphere is absorbed by the hotter surface : Atmosphere: δS1 = -(390-301)/270 = -89 / 270 = -0.33 J/K Surface: δS2 = (390-301)/288 = 89 / 288 = 0.31 J/K This is right, net entropy equals -0.02J/K (as you say, “radiation quality” has increased since that energy will be re-emitted at a shorter wavelength) Entropy is reduced. This looks wrong. And it is! Because in that calculation you forgot one term: the radiation from TOA to space : If we suppose radiation from space to be j* = sigma * T^4 = 5.67*10^-8 * 3^4 = 4.59*10^-6 W/m² Let’s consider the entropy budget for one square meter for a second : Atmosphere: δS1 = -(390-0.00000459)/270 ~= -390/ 270 = -1.44 J/K Space: δS2 = (390-0.00000459)/3 ~= 390/ 3= 130 J/K Net entropy production from TOA-Space exchanges : 128.56 J/K Net entropy production from atmosphere exchange with the earth’s surface and space : 128.56 J/K – 0.02 J/K = 128.54 J/K. When you take all terms into account, no entropy is lost (even though some of it gets moved away.) In fact you see a massive amount of entropy created and, as Nick Stokes points out, it is the place where the entropy production is the largest (Sun-earth ~ 10 J/K.s.m², earth-atmosphere ~ 10^-2 J/Ksm² , atmosphere-outer space ~ 10² J/Ksm² )"
What more could we ask for - an actual worked example proving that back radiation does not violate the 2nd law of thermodynamics. Given this example, and the ease of the mathematics, I think it should be a minimum denier wanting to mount the tired old 2nd law argument that they provide such a worked example of their model of the greenhouse effect. It should make the arguments much shorter and to the point, and provided an easy way to keep score of who is correct, and who is simply full of it. -
Ken Lambert at 22:10 PM on 7 April 2011Skeptical Science in other media
I did not think that being forgiven by supernatural beings had anything to do with the science (or sub-science) of AGW. I must admit that if there were a logic to an object of worship - worshipping the Sun made primitive and scientific sense. After all, from the Sun is where all this troublesome warmth cometh. -
Gilles at 21:59 PM on 7 April 2011Arctic Ice March 2011
Michael : "winter ice used to be 15 million sq k and dropped to 11 in the summer i.e 4 million was new ice." ??? 6 months after being 15 or 10 millions km^2, winter ice becomes summer ice , with an extent between 4 and 5 Mkm^2 - so most of the 10 to 15 Mkm^2 of each year are only 6 months old anyway. -
Gilles at 21:55 PM on 7 April 2011Arctic Ice March 2011
162 : les: I'm flattered that you waited until I didn't recognize a famous sentence before concluding english is not my mother language (I'm French - it's "Gilles" and not "Giles").But CB 164 : "However, they can and have been used to predict the trend of the decline." Fine : so please can you predict the trend , say, in the 10 next years, and how ? "Arctic temperatures have risen much more in the recent warming phase than they did in the earlier part of the century." The graph from Kaufman et al. 2009 that I reproduced just above obviously contradicts this assertion. And the biological proxies that are essentially summer responsive do show a much clearer increase at the beginning of century than now - so how do you explain that tree and lake sediments appeared to feel much more variable warmth in summer, at the beginning of the XXth century than sea ice ? another try ? -
Tom Curtis at 21:53 PM on 7 April 2011Muller Misinformation #1: confusing Mike's trick with hide the decline
Ryan Starr @123, it is a common conceit of deniers that any absurdity they do not adhere to is not promulgated by any denier. By ignoring the claptrap sprouted by their fellow deniers, they not only avoid disagreeing with those deniers, and recieving the blast of invective that normally accompanies such disagreement; but they also get to pretend that the supporters of AGW theory are arguing against a strawman. The pretence is disengenuious, and in fact many deniers do in fact claim that "hide the decline" refers to a fraudulent concealment of a decline in mean global surface temperatures as measured in the instrumental record. As to Starr's claim that Jones and Manne are "hiding the evidence", publishing the evidence, drawing attention to the discreprancy, and then discussing it in several papers, then citing those discussion in all other papers where the data is used is a funny way to hide something. In fact, in most circles that is considered drawing attention to the problem. But not, apparently, in denier circles, when the publishing, discussing, and citing is done by a climate scientists. -
Dikran Marsupial at 21:35 PM on 7 April 20112nd law of thermodynamics contradicts greenhouse theory
Fred@975 It seems to me that the source of the disagreement here is that you view backradiation as a separate theory, rather than as a component part of the "top of the atmosphere" explanation. AFAICS this is incorrect, it is backradiation that causes the surface to warm until equilibrium is re-established following an increase in the height of the emitting layer at the top of the atmosphere. -
les at 21:31 PM on 7 April 20112nd law of thermodynamics contradicts greenhouse theory
976 Staples SoD seems quite comfortable with Entropy. -
CBDunkerson at 21:22 PM on 7 April 2011A Plan for 100% Energy from Wind, Water, and Solar by 2050
Vladimer: "The problem is that almost all of that is hypothetical." If you had actually read the article you might have noticed the part about; "we consider only options that have been demonstrated in at least pilot projects and that can be scaled up as part of a global energy system without further major technology development." Renewable energy technology does not require further development to replace most fossil fuel use. The current state of development is more than sufficient and getting better rapidly. -
Fred Staples at 21:16 PM on 7 April 20112nd law of thermodynamics contradicts greenhouse theory
As I posted my last contribution, I noticed that we are to be favoured by another post from SOD. I debated back radiation theories with someone I believed to be SOD in Eli Rabett’s blog, some time ago. Quoting from memory, SOD based his argument on the conservation of Energy (“where does the energy go”?) He freely admitted that, for him, entropy “never seemed real” and its formula deltaS = DeltaQ/delta T did not make sense (which, since that version is wildly wrong, is not surprising). No-one should comment on AGW (or anything else, in my opinion) without a reasonable grasp of the second law of thermodynamics. For any spontaneous transaction, anywhere in the known universe, the change in entropy must be positive. Now if a quantity of energy deltaQ leaves the atmosphere at a temperature Ta, the change in entropy is -deltaQ/Ta.If it is absorbed by the surface, at a temperature Ts, the change in entropy is +deltaQ/Ts. Now, since Ta is less than Ts (the lapse rate again), the combined change in entropy is negative, which is forbidden. If it happens on the microscopic level (vibrating molecules in a steel bar, heated at one end, or photons from a cold plate to a hot plate), it must be accompanied by a greater transfer in the conventional direction, hot to cold. It cannot be considered or analysed in isolation, which would take us immediately to a search for perpetual motion, as G and T point out at excessive length. By transferring from a hot source to a cold sink, energy becomes heat which can produce work. No net change is possible in the opposite direction without a heat engine. So to answer the question posed in the introduction, have climate scientists made an elementary mistake in explaining AGW? Of course not. Have most of the bloggers, politicians and journalists? Undoubtedly. -
CBDunkerson at 21:13 PM on 7 April 2011Arctic Ice March 2011
Gilles: "is there any clear parameter in the past (such as the value of last minimal, or maximal extent, the amount of < X years old ice, etc..) that would be useful to predict the next minimum, and allow such predictions to be made with a significative success ?" No. None of the factors causing the ongoing trend of Arctic ice decline is consistently greater than short term weather variations. Ergo, no single such factor, nor even a combination of factors, can be used to precisely predict results in individual years. However, they can and have been used to predict the trend of the decline. Also: "do you have a physical explanation of why the arctic sea ice extent doesn't show any significative variation in the 1900-1940 period, when the average global temperature shows a variation similar , although slightly smaller, to the current one ?" Global != Arctic Arctic temperatures have risen much more in the recent warming phase than they did in the earlier part of the century. Further, as others have noted, the existing ice was much thicker in the past and thus the ice-albedo feedback effect was nowhere near as pronounced as it is now. That said, my recollection is that the perfect flat line in a few spots on that graph is due to lack of data for those years. Still, a gradual decline in Summer ice extent (i.e. the period most impacted by warming) can be seen in conjunction with the earlier warming period and a more pronounced decline with the current more pronounced Arctic warming. Finally: "so why the temperature change in the 1900-1950 period has not produced any change in the sea ice extent" As I noted, the Summer data does show a decline in the 1900-1950 period. Ignoring that in favor of the periods where warming would have less impact is essentially a return to the 'conditions have been reset' argument that you claimed you are not making. -
Fred Staples at 20:32 PM on 7 April 20112nd law of thermodynamics contradicts greenhouse theory
In a series of posts, I have tried to demonstrate that “higher is colder” is the only theory of AGW that does not contradict basic thermodynamics. Sadly, it is the only theory that G and T do not address. It is a top-of-atmosphere theory (where CO2 effects are not swamped by water vapour) and it depends on the existence of the lapse rate. The climate models are based on this theory, (which does not mean that it is correct, Tom) and predict mid-troposphere temperatures trends about about 20% higher than surface trends (50% higher in the tropics, where increased evaporation should produce the famous missing hotspot). To test the theory, we can look at the satellite data (from 1979) and, separately, radio-sonde data compiled by the Hadley Centre. At first sight, any debate is settled by the satellite data, which shows trends in the opposite direction to the models (wikipedia - satellite temperature measurements): Mid Troposphere : 0.52 degrees per century Lower Troposphere : 1.4 degrees per century However, the commentators cast doubt on the upper atmosphere results because they are contaminated by readings weighted from the stratosphere, which is said to have cooled (see below). A more straightforward source is the radio-sonde data from the Hadley Centre, which provides data at all levels. The trends over the satellite era, in degrees C per century, are as follows: Lower Troposphere 1.45 kilometers : 1.54 Mid Troposhere 5.56 kilometers : 1.58 Upper Troposphere 9.13 kilometers : 1.27 Lower Stratosphere 11.74 kilometers: -0.28 (not significantly different from zero) Upper Stratosphere 21 kilometers : -8.10 Has the stratosphere cooled? In the upper reaches, unquestionably, but these tenuous regions will not effect satellite readings. The lower stratosphere has not cooled significantly, but the more or less constant temperatures might mask (to some extent) warming in the troposphere as viewed by the satellites. Those whose business it is are working on this. I tested the significance of all the data (the use of second decimal places presumably shows that scientists have a sense of humour), and there is 1 chance in 18 that the trend difference between the lower and upper troposphere arose by chance, (ie from random fluctuations in the data) which is just less than the conventional 5% level. What can we conclude from this data? Warming there has certainly been but the data lends no support to any theory of causation. If I were an AGW enthusiast I would be particularly worried about the lower trend in the upper troposphere. And the satellite data would be conclusive (against “higher is colder”) were it not for the constant (ie not cooling) lower stratosphere temperatures. The data also confirms another piece of conventional sceptical wisdom. Working back from the latest data, we can ask how far we must go to detect a statistically significant period of warming. The answer, for the mid and lower troposphere, is 15 years. For the upper troposphere, 19 years. -
RyanStarr at 20:07 PM on 7 April 2011Tai Chi Temperature Reconstructions
I derived this myself from the ljungqvist2009 data file. I used columns 64 to 71, 8 series. Unfortunately the southern hemisphere isn't represented as well as the north, but can't be ignored it is half of the globe. For each the sigma is calculated and the average of all is taken. Columns names are:
64. Lake Pallcacocha, Ecuador
65. W. Argentina
66. Subtropical Atlantic off W. Africa
67. Makapansgat Valley, S. Africa
68. SE. South Atlantic
69. Mt. Read, W. Tasmania
70. Law Dome, E. Antarctica
71. Dome C, E. Antarctica
Columns names are:
64. Lake Pallcacocha, Ecuador
65. W. Argentina
66. Subtropical Atlantic off W. Africa
67. Makapansgat Valley, S. Africa
68. SE. South Atlantic
69. Mt. Read, W. Tasmania
70. Law Dome, E. Antarctica
71. Dome C, E. Antarctica
-
jatkeison at 19:54 PM on 7 April 2011Call for beta testers of the latest SkS Firefox Add-on
I'll install it on Ubuntu 10.10 and Windows XP Professional... Well, after i get back from the Michael Mann talk tomorrow night! <LOL>Response: Sent and let us know how the talk goes :-) -
MichaelM at 19:44 PM on 7 April 2011Arctic Ice March 2011
I imagine your scientific bona fides are called into question when you say things like "do you realize that most of the ice in winter is just 6 months old anyway" when you yourself provided a graph which showed that winter ice used to be 15 million sq k and dropped to 11 in the summer i.e 4 million was new ice. If the 11 million k multi-year ice was slowly being thinned by gradually increasing temps then there comes a point when it is thin enough to melt in summer allowing the sea to absorb more heat.Moderator Response: [Dikran Marsupial] Gilles' scientific bona fides are off-topic, please let us not feed the troll on that one. -
les at 19:39 PM on 7 April 2011Arctic Ice March 2011
161 Gilles - I understand, at least, that you are not first language English - the phrasing at the end of post 159 is a coining of Senitor Bentsen. You can't be blamed for not spotting that. In fact I [also] have a substantial background not least of all in science and engineering. But, as with all of us here, you cannot really validate that any better than I can or will go through your CV. Your arguments do not stand up to your claims of qualification. You should really strive to fix that.Moderator Response: [Dikran Marsupial] Please, no more discussion of Gilles' science background, it is entirely irrellevant, and frankly just trolling. -
Gilles at 19:19 PM on 7 April 2011Arctic Ice March 2011
les : you're just proving again your lack of perspicacity. I have 130 refereed papers, including 60 in a large scientific collaboration. Either something is wrong with you, or something is wrong with refereed papers - which is a problem for you anyway. If you only "know" scientist, or have only "friends", I do not consider you as a reliable person for judging who is a real scientist or not. 160 adelady : thank you for having the courage of proposing something - but what do you call "vast amounts of very thick ice " ? do you realize that most of the ice in winter is just 6 months old anyway, every year , so can't be "very thick"? so why the temperature change in the 1900-1950 period has not produced any change in the sea ice extent, whereas the largest change has occured only in the last decades - where strangely enough, on the opposite , temperatures haven't increased significantly since 1998 ? you seem all to say "come on, Gilles, it's obvious, the warmer it is, the more ice will melt" - but actually there is no obvious correlation on a year to year basis. I could equally argue that the melting of ice is "obviously" due to the motion of Pluto with the same data ....Moderator Response: [Dikran Marsupial] Your claimed status as a scientist are off-topic unless you identify yourself so that the claim can be verified. Whether your posts have values depends on their intrinsic merit, not the merit of the source. Argument from authority is a logical fallacy, and unimpressive if the authority is unverifiable, so please everybody give it a rest, and limit the discussion to the science itself. The last paragraph is obvious trolling, there is a good physical reason to expect warming to result in ice melting, there is no good physical reason for the motion of Pluto to affect the ice melt, which is why one explanation is very much more plausible than the other. In science this is known as "Occams razor", if two theories explain the observations equally well, we should prefer the more simple. In this case any theory linking Pluto to ice melt is going to be pretty complicated. -
JMurphy at 19:16 PM on 7 April 2011Has sea level rise accelerated since 1880?
daniel maris wrote : "I take a rather simplistic view - I'll be interested when the water starts lapping over some islands. These effects are really very minimal. A few mms over decades? I mean - put a bit more cement on top of your sea wall...abandon that pontoon and build a new one...move your settlement a few feet up the hillside. These are not cataclysmic effects - no more cataclysmic than say a port getting silted up." There's plenty of information out there that shows that maybe there are lots of people who are/should be worried, despite the fact that you don't appear to be, because of the effects of that 'little' rise : 1) The impacts of sea level rise - even in the lower ranges of the current predictions - looks to be severe. Approximately ten percent of the worlds population - 600 million people - live in low lying areas in danger of being flooded. A previously released study led by John Church, shows that even a modest sea level rise of 50 centimeters will result in a major increase in the number of coastal flooding events. "Our study centered on Australia showed that coastal flooding events that today we expect only once every hundred years will happen several times a year by 2100", says John Church. 2) "According to the most recent sea-level-rise science, that's where we're heading," said lead researcher Jeremy L. Weiss, a senior research specialist in the UA's department of geosciences. "Impacts from sea-level rise could be erosion, temporary flooding and permanent inundation." The coastal municipalities the team identified had 40.5 million people living in them, according to the 2000 U.S. Census. Twenty of those cities have more than 300,000 inhabitants. 3) One often-overlooked dimension is elevation. Ten percent of the world's population lives in coastal areas that are less than 10 meters (33 feet) above sea level, reports Balk and her colleagues. Although they only comprise about 2.2 percent of the world's land area, these low-elevation coastal zones (LECZs) are home to 600 million people. In addition, about 360 million people in LECZs live in urban areas which means that more people will be exposed to hazards such as sea-level rise and storm surges—phenomena that are expected to worsen as a result of global warming. The Effects of Rising Sea Levels Although inundation by increases in mean sea level over the 21st century and beyond will be a problem for unprotected low-lying areas, the most devastating impacts are likely to be associated with changes in extreme sea levels resulting from the passage of storms (e.g., Gornitz et al., 2002), especially as more intense tropical and extra-tropical storms are expected (Meehl et al., 2007). Simulations show that future changes are likely to be spatially variable, and a high level of detail can be modelled (see also Box 11.5 in Christensen et al. (2007). IPCC As for your disdain towards silted-up ports, I think you will find that the populations who inhabited ex-ports like Miletus, Ephesus, and Great Yarmouth (and other Kentish ports), among others, would want to argue with you about your definition of "cataclysmic" as it applies to peoples' lives and livelihoods. -
les at 18:59 PM on 7 April 2011Skeptical Science in other media
21 adelady makes some good points. Historically, the rift between religion and science (broadly speaking, lets say skeptical questioning) occurs in two situations. There are often refits: 1/ Between The Church and other sources of authority or 'truth' (be they state, science, other religions etc.) 2/ Between Fundamentalist interpretations of religious dogma and just about every thing else. The first originates, most notably, with the emergence of the Holy Roman Empire. The second is what it is and crops up within many confessional domains - e.g. there are both Christian and Muslim etc. creationists. However beyond the above, there are/have been Christian, Jewish, Muslim, Buddhist, etc. dominant societies and individuals that have strong investigative, scientific, skeptical traditions throughout history to the current day. There just is - empirically speaking - absolutely no evidence that societies with one or several dominant religions, or individuals who are confessional in general terms, cannot or do not do good science... until some political structure or ideology breaks things; And that is not unique to religions either. The dominant politics in the US has elements of both power conflict (1 above) between big industries and the output of scientific investigation; and of fundamentalist thinking (in this case constitutional fundamentalism, typified by Ron Paul etc.) The more negative religious forces are just hangers-on. In short: Being religious is neither a necessarily nor sufficient condition for doing poor science. -
adelady at 18:11 PM on 7 April 2011Human CO2 is a tiny % of CO2 emissions
See the moderators remarks @119. Sea levels 20-25 metres higher sounds like a major impact on habitability of every coastal city I've ever heard of. -
adelady at 18:07 PM on 7 April 2011Arctic Ice March 2011
Gilles ".... could you explain the big difference in the post-1900 behavior of these two curves ?" Off the top of my head? I'd say that looks very much as though starting the warming period with vast amounts of very thick ice is a great stabilising influence on ice extent. So influential in fact that once that particular warming period waned, it was easy for the ice to regain some, maybe not all, of the thickness invisibly lost from beneath to warmer waters. -
tr1ckyOne at 18:03 PM on 7 April 2011Human CO2 is a tiny % of CO2 emissions
I'm not sure if my question is on-topic or not, but shouldn't we be examining what the consequences of temperature increases rather than if it's natural and within error parameters? I'd think that would be more important. How much global warming is going to affect our human existence, what its effect will be on our food chain, weather patterns, water supply...and what we can do to prevent these consequences. So even if global warming is due to natural cycles, shouldn't we do something to prevent it anyways? Can someone post some facts about earth habitability during various global temperature extremes? And what the prospects are for our habitability during these extremes. I think that would be pretty useful. -
adelady at 17:56 PM on 7 April 2011Skeptical Science in other media
nicholas. Convert? Never in a million years. What christians like John Cook and others here can do, and none of us unbelievers can do, is to show other christians that there is no conflict between science and religion. They might say they are two separate things. Or others might say that science is one way to see more of the wonder of the created world (I suspect John might be in this group). I think you're falling for the argument (of very shrill voices) that the YE creationists represent the majority christian viewpoint. They don't. Catholics, Anglicans, Episcopalians all accept the evidence of science as shown in geology, astronomy, biology, archaeology and all the rest. Lots of people who accept science hold irrational beliefs and superstitions. Astrology, feng shui, gaia belief, ancestor worship. Focus on the science. If people want to hang onto their other beliefs at the same time, let them. Getting diverted onto arguments about "you couldn't possibly believe ..... if you accept scientific method" is a waste of breath. -
les at 17:31 PM on 7 April 2011Arctic Ice March 2011
I note that Gilles has shown no evidence of having read the paper linked above which actually shows how to analyse for acceleration... and now we have a copy of Taminos explanation for sea level rise on site - yet he continues to shove one graph up against another and go "look, see"... 156 Gilles "But I can't prove them who I really am." No, but on discussion boards like this people tend to be judged by their deeds and words. And I echo others sentiments; I have worked with scientists, I know scientists, scientists are friend of mine. Gilles, you're no scientist. -
tomh at 16:45 PM on 7 April 2011Call for beta testers of the latest SkS Firefox Add-on
I'll be glad to test it on three configurations: FF4 under Windows XP; FF4 under Mac OS X 10.6 (Intel); TenFourFox under Mac OS X 10.5 on PPC (TenFourFox is a branch of FF4 compiled to run on PPC-based Macs).Response: Sounds like you've got all bases covered. File sent, thanks! -
villabolo at 16:13 PM on 7 April 2011Has sea level rise accelerated since 1880?
@4. daniel maris: "...I take a rather simplistic view - I'll be interested when the water starts lapping over some islands. These effects are really very minimal. A few mms over decades?" Daniel, are you forgetting that there is a time delay before large amounts of ice completely melt for any given temperature? Also, what about the 1 degree Fahrenheit rise that is in "the pipeline" for the next 30 years? That's assuming that we stop all emissions today. Since that won't happen we have to take at least a bare minimum of 450 ppm into account (still unrealistic). -
sgmuller at 15:38 PM on 7 April 2011Has sea level rise accelerated since 1880?
How long does it take for sea level rise in the North Atalntic (from Greenland ice sheet melt) to spread worldwide? I recall a Newscientist article which suggested that it may take up to 30 years for a North Atlantic sea level rise to spread out worldwide. Sorry I don't have references but the author suggested that the world's oceans were analogous to a series of bathtubs linked by small hoses rather than a continuous ocean. Given that the Greenland ice sheet is likely to be a much larger contributor to sea level rise than antarctica ice sheets, this is a significant issue.Moderator Response: [DB] The effects of GIS melt on sea levels is indeed discussed by the New Scientist article on the Stammer JGR paper (discussed here). Effects of a collapse of the WAIS are discussed here. Keep in mind that sea level rise is continuous (globally averaging about 3 mm per year currently, but projected to rise significantly with the expected melt). Hansen 2011 discusses scenarios under which 5 meters of SLR can be expected globally by 2100, due to non-linear ice sheet decomposition. -
Gilles at 15:04 PM on 7 April 2011Arctic Ice March 2011
another related question : do you have a physical explanation of why the arctic sea ice extent doesn't show any significative variation in the 1900-1940 period, when the average global temperature shows a variation similar , although slightly smaller, to the current one ? and when, noticeably , proxies data show the maximal variation ? are boreal trees much more sensitive to some kind of temperatures that sea ice doesn't feel, and reciprocally? on other word, could you explain the big difference in the post-1900 behavior of these two curves ? and this one
 ??
??
Prev 1785 1786 1787 1788 1789 1790 1791 1792 1793 1794 1795 1796 1797 1798 1799 1800 Next


