


 Arguments


Recent Comments
Prev 1793 1794 1795 1796 1797 1798 1799 1800 1801 1802 1803 1804 1805 1806 1807 1808 Next
Comments 90001 to 90050:
-
les at 21:36 PM on 3 April 20112nd law of thermodynamics contradicts greenhouse theory
Ryan 934 Assume No. HTH. -
wingding at 21:02 PM on 3 April 2011Hansen's 1988 prediction was wrong
Another misleading analysis of Hansen's 1988 scenarios this time bob carter and david evans getting it hideously wrong. Note the substitution of tropospheric temperatures when the projections were for surface temperatures. Note the complete disregard of non CO2 greenhouse gases in order to claim scenario A best fits reality. Check the comments. There is a quote mine of Hansen 1988 to support that disregard. Worse of all a complete lack of research. It's like they haven't even bothered reading any analyses of the 1988 scenarios, including in some of hansen's later papers. Like they didn't even use google. There's enough wrong in that article for a skepticalscience correction imo. If you google some of the text in the article you will find it's been copy pasted around over the years. Another bad thing is how none of the commenter seem to know it's wrong. -
michael sweet at 20:36 PM on 3 April 2011It's cooling
I am suprised no-one has mentioned that Harp Seals in the North Atlantic breed on the sea ice in Canada. There was little or no sea ice in this area of Canada this winter. The Harp seals had no where to breed on the ice so some wandered off. The appearance of Harp seals in the USA is more likely due to loss of habitat in Canada, due to the ice melting from AGW, than because they are physic and think it is getting colder.This article from the Humane society of Canada claims that the seals were forced to give birth on shore in 2010 (I could not find a scientific reference for harp seals birthing on shore, there has not been enough time for it to be published). Lack of suitable habitat would account for seals wandering more than usual. -
CBDunkerson at 19:55 PM on 3 April 2011Muller Misinformation #1: confusing Mike's trick with hide the decline
Given Tim's insistence that we should believe his version of events (rather than logic or the evidence of our own senses) 'because Climate Audit says so' I have to wonder if there should be something along the lines of the politician quotations page for major 'skeptic' blogs. That is, collect the most obvious / most egregious disinformation they have put out to show exactly how little credibility they have. Consider that Muller, a physicist, raved about what a "hero" Watts was.. despite Watts promoting complete nonsense like 'the greenhouse effect violates the 2nd law of thermodynamics'. Likewise Muller has been spreading the fictional claim about Gore having been told 'not one polar bear has died due to receding ice' which the 'skeptic' blogs simply made up. I wonder if he'd have made such a mistake if there was an easily available resource to show just what sort of people he was getting in bed with... though I suspect he is starting to get an inkling now. -
CBDunkerson at 19:39 PM on 3 April 2011Soot and global warming
BP, that graph doesn't make a 'clear' case for correlation... let alone causation. Since it is a short term atmospheric particulate effect we'd expect to see close correlation between peaks and valleys if it was impacting Arctic sea ice... similar to the way that volcanic eruptions and ENSO events can easily be identified in the temperature record. Instead, what we see is no correspondence at all. The unusually high (in comparison to the ongoing trend) ice extent of 1996 is matched with the highest soot output to that point... and the next year there was unprecedentedly huge soot output with no corresponding spike in ice decline. Ditto the high soot output in 2004 and 2005. Basically, the chart takes two factors which are changing and scales them such that the start and end points roughly overlap. You could do the same thing with Arctic sea ice and cell phone sales. -
TimTheToolMan at 19:01 PM on 3 April 2011Muller Misinformation #1: confusing Mike's trick with hide the decline
"you have a pattern of making accusations without providing supporting arguments" I have provided the website that contains all the information needed for those who are interested beyond wanting to hear what they want to hear. I cant do more than that because experience has shown me that I will be censored and unable to make a consistent argument.Moderator Response: (DB) Experience should have taught you that commiting repeated violations of the Comments Policy will force moderation. That is science in action: repeating failed behavior with differing expectations of results. -
L.J. Ryan at 18:09 PM on 3 April 20112nd law of thermodynamics contradicts greenhouse theory
les 933 I'm not sure what you are saying/asking...are you referencing your post 925 where you asked: "Where did the rest of the material come from (it is only polite to reference sources, after all)?" Assuming yes, these formula are straightforward applications of GHG physics. I know that sounds obligatory, yet this is a very true answer. It is only this "physics" charade which permits such misapplication of know laws. Do you wish to see the actual equations implicit in within data tables? If so, no problem. Please reply affirmatively and I will post later this evening. -
Berényi Péter at 17:45 PM on 3 April 2011Soot and global warming
Yes. And reduced summer ice cover in the Arctic is clearly caused by Chinese soot. However, in this case the phenomenon can't be used as a proof of high climate sensitivity to atmospheric CO2 concentrations.
-
les at 17:39 PM on 3 April 20112nd law of thermodynamics contradicts greenhouse theory
Ryan. Thanks for including me in your rant. But you will note that I have not participated in your calculation thread of argumentation. The reason I have not us that as a physicist, I know thus is not how one actually thinks about this kind if problem. I've made my remark about the blog post. Respond to that or not; but I'm not being sucked into this particular bit of kinda-garden-proifiness. -
L.J. Ryan at 17:11 PM on 3 April 20112nd law of thermodynamics contradicts greenhouse theory
Tom Curtis 929, KR, les Did you actually comprehend my post or just offer a knee jerk retort. re 1)Your Eq1 equations confirm mine. I'll prove it to you...what is the SW flux incident on the earths SURFACE? What is the SW absorptivity of the earth SURFACE? re 3) My (e3) is "mined" directly from Jin-Yi Yu lecture...KR, les and Philippe Chantreau seem to think highly of his presentation. So if I have got it wrong so does he. Your added commentary regarding TOA blackbody temperature is specious. Two reasons: first, the quote "Energy emitted by Earth = Energy absorbed by Earth" are not my words...look it up. Notice no mention of TOA. Second, the emission as defined by Stefan–Boltzmann law are from a blackbody's surface, not some arbitrary distance in order manufacture a energy gain... your definition is complete nonsense. re 4) Ok, let's eliminated earth's albedo and re-calculate blackbody maximum....T= (340 W/ m2 *1/σ).25 = 278K. Any interested readers should note, the absolute maximum blackbody temperature, with absolute maximum possible SW input is still, 10o colder, then actual temperature. Let me repeat that, GHG physics fabricates energy sufficient enough to confer temperature 10o above that which the sun provides! Tom Curtis do you deny this fact? re 5) You want to make SW absorption by the earth SURFACE 240 W/m2, fine. Shall I recalculate with this slightly higher flux, SURFACE absorption. As I suspect you know, there will be little change to the results. re 6) Ok, lets correct the record, please provide the actual SW absorption for the earths SURFACE. re 7) Since you obfuscate GHG physics mechanics invoking earths albedo, lets remove albedo and test this falsehood. No albedo, maximizes SW input, 340 W/m2 incident to the SURFACE. Given this most fantastic crutch, do you, Tom Curtis, KR, les, Philippe Chantreau, DSL, RW1, Stu, Phil, scaddenp, e, muoncounter, John Cook, DB, any of the other { -snip- } have confidence radiative forcing will work? Any interested readers should note, I will spot GHG physics the full solar input 340 W/m2 to the SURFACE, no albedo, and I contend it can not rectify the required energy to achieve earth's mean temperature of 288K.Moderator Response: [muoncounter] Please read the Comments Policy more carefully; accusations such as that removed from your comment are unnecessary and unacceptable. Do not overuse the emphasis; it is tantamount to shouting. -
Tom Curtis at 16:21 PM on 3 April 2011Muller Misinformation #1: confusing Mike's trick with hide the decline
TTTM @112, you have a pattern of making accusations without providing supporting arguments, or links to supporting evidence. This may be an effective way to avoid rebuttal, but that's OK, because by reducing yourself to unsubstantiated assertion, you remove any need for rebuttal. Considering the exchange we have just had, unsubstantiated assertion is probably the safest route for you, rather than having your baseless accusations again exposed to scrutiny. -
Tom Curtis at 16:14 PM on 3 April 2011Muller Misinformation #1: confusing Mike's trick with hide the decline
TTTM @115, on re-reading, yes it was attributed; but no it was not distinguished as being a quote. You should try placing quotes inside quotation marks, and preferably inside a block quote to distinguish it from the rest of the text. You should also attribute quotes to a person, not to an unlinked website. -
Simbiotic at 16:11 PM on 3 April 2011Zero Carbon Australia: We can do it
I am a former geothermal supporter (even invested $5000 in Geodynamics), but i don't think it has much potential in australia. Hot-springs type geothermal is excellent overseas where active volcanism is ongoing. Places such as Iceland, New Zealand and Indonesia have a lot of oportunities. In Australia our only geothermal option is from hot rocks, and involves drilling lots of very deep, large diameter holes. These holes are ludicrously expensive, in the range of tens of millions each. From memory, geodynamics had a plan to drill around a hundred of these holes for their planned comercial scale electricity plant. The other problem is that even hot rocks plants cant be build just anywhere. You need a location which has highly radiactive granites under a cover of at least 3km of sediment to insulate the heat. This is why geodynamics built their demonstration facility in the middle of the desert, somewhere out from the town of Innamincka, SA. -
Citizen99 at 15:55 PM on 3 April 2011Debunking Climate Myths from Politicians
John, I am thrilled to see this new page, and this is a great way to get started. One of the truths in U.S. politics is that the debate is led not by the politicians, but by their "bosses" in the extremist media (Thanks again, Australia ... just kidding!). The politicians follow, because they know that these media networks reach a lot of voters, and the vote of a misinformed dupe counts the same as any other. Remember that just a few years ago, many of these same politicians supported positive steps to curtail climate change, and have only recently reversed their rhetoric. Rep. Fred Upton of Michigan is a stark example, who made a very well-documented about-face on this issue in the last two years, after he saw the outsized influence of the tea parties in the 2010 mid-term debacle. The good news (I guess) is that the commitment of most of these individuals to their current position is about an inch deep, and thus can be reversed if they perceive public opinion again turning against them. And thus, any effort to educate potential voters on the counter-arguments against the nonsense they have been fed by the denier movement could be a valuable tool in changing these easily changeable politicians' minds. -
TOP at 15:40 PM on 3 April 2011Soot and global warming
A few papers on BC and snow melt. DUST AND BLACK CARBON IN SEASONAL SNOW ACROSS NORTHERN CHINA IMPURITIES IN SNOW: EFFECTS ON ALBEDO Darkening of Soot-doped Natural Snow: Measurements and Model Sources of light-absorbing aerosol in arctic snow and their seasonal variation This last study suggests that biomas burning is responsible for a lot of the BC in snow. I wasn't able to find anyting about the affect of BC on heat absorbtion over the oceans. -
TOP at 14:43 PM on 3 April 2011Soot and global warming
Doherty just measured BC. They haven't yet verified it's use in models to predict reductions in albedo. This winter I was especially observant of the snow melt next to my driveway. What Doherty says about the importance of crystal size to melt is apparently true. I observed that the snow was melting horizontally more or less in line with the sun's elevation. That wasn't the dirt on the snow that did that. -
Daniel Bailey at 14:40 PM on 3 April 2011Arctic Ice March 2011
Sphaerica If I could add but 2 things to the fine and salient points you've made: 1. I just wanted to reiterate and emphasize the point you've made about the looming albedo changes and length of days in the Arctic. The energy received in the Arctic summer is in excess of that received during the tropics - and this occurs for many weeks, 24/7. This imbalance has thinned the sea ice cap in the Arctic to the point where weather conditions alone could expose the Central Arctic Basin (and the area of the North Pole) to sunlight for the first time in millennia-to-hundreds-of-millennia). Essentially, the Arctic albedo could "flip" from it's natural white, highly reflective state to a very dark, very absorptive state. If the summer energy imbalance currently is enough to put the health of the Northern Hemisphere's refrigeration system "on the ropes", what will that energy imbalance do to our climate once it has "TKO'd" the polar cap? 2. Readership here at Skeptical Science are far more intelligent and discerning than those who would seek to dissemble and disinform would like to think. It should be obvious by now to those who've yet read this far on this thread as to which parties seek to provide information in full context, and which belong to the "D & D tribe". PS: Business-as-usual for another 20 years will essentially guarantee another 3-5 degrees C (or more) by 2100. The last time the world was that warm Antartica contained little ice (but Bob is right in that it will still take centuries-to-millennia to completely dissipate). The Yooper -
TimTheToolMan at 14:07 PM on 3 April 2011Muller Misinformation #1: confusing Mike's trick with hide the decline
"Can you honestly say that you attributed every and each quote coming from CA?" I've only made one and yes, it was attributed.Moderator Response: [muoncounter] See the prior moderation response at #110; there was no quote in #98. -
TimTheToolMan at 14:02 PM on 3 April 2011Muller Misinformation #1: confusing Mike's trick with hide the decline
"By the way, the accusation you make in 112 should be substantiated. " All I can say is that genuinely interested readers should visit Climate Audit to see the other side of this story and then make their own minds up based on the evidence presented. -
TOP at 14:01 PM on 3 April 2011Soot and global warming
Cryoconite Holes Apparently cryconite holes have been around since 1870. They are part of the ecosystem. Effect of Life in Holes. Some of the melting is due to heat released from the organisms that grow in cryoconite. Cryoconites in the Antarctic Weblog of Belgians studying cryoconites. The cryoconites in the Taylor valley support an active, diverse assemblage of organisms despite the fact that they may remain sealed from the atmosphere for decades. Given the density of the cryoconites in the dry valleys (~ 4-6% of ablation zone surfaces), flushing of the cryoconites during warm years could provide a vital nutrient and organic carbon source to the surrounding polar desert. LINK Some cryoconites have been around a while.
It seems more plausible that it isn't the carbon's heat absorbing properties, but rather it's food value that is important in the formation of cryoconite holes. Part of the food chain.
Some cryoconites have been around a while.
It seems more plausible that it isn't the carbon's heat absorbing properties, but rather it's food value that is important in the formation of cryoconite holes. Part of the food chain.
-
Philippe Chantreau at 13:46 PM on 3 April 2011Muller Misinformation #1: confusing Mike's trick with hide the decline
I seldom get my comments published at RC, in fact I can't even remember when was the last one I got one through. As for science winning, Muller is experiencing just how that goes at WUWT. After having found that the instrumental temperature data is really not so unreliable, he's getting the lynch mob at WUWT on his heels. Talk about going against the agenda. Let's keep it real. The moderation on this site is far superior and more flexible than anywhere else I know. Deltoid lets just about anything through and that has the inconvenient of degenerating into childish fights. Sks is exemplary. Check out the 2nd law of thermodynamics thread to see how much pure nonsense was allowed to trolls "going against the agenda" only for the sake of being open. Can you honestly say that you attributed every and each quote coming from CA? By the way, the accusation you make in 112 should be substantiated. -
TimTheToolMan at 13:23 PM on 3 April 2011Muller Misinformation #1: confusing Mike's trick with hide the decline
At the end of the day, word is getting out to scientists who understand and appreciate whats going on here. More detail is emerging regarding undisclosed truncations of the proxy data now at both ends of the reconstruction. Science always wins in the end.Moderator Response: [DB] "Science always wins in the end." Something dissemblers and disinformationists would do well remembering. -
Philippe Chantreau at 13:22 PM on 3 April 2011Muller Misinformation #1: confusing Mike's trick with hide the decline
TTTM, you want to experience censorship? Go to CA or WUWT and try to challenge their views with the same freedom you have enjoyed here. Don't be shy, pretend to be a real warmist and go gung-ho. See what happens, then report back to us. That's a form of scientific experiment, should be OK with you right? -
TimTheToolMan at 13:03 PM on 3 April 2011Muller Misinformation #1: confusing Mike's trick with hide the decline
"I believe this to be against forum policy, although I would prefer if the comment was not removed." Climate Audit was clearly credited with the quote. I see I am again being censored on this site. This has now moved beyond poor form now, moderators.Moderator Response: [muoncounter] Your last mention of CA was in comment #98, where there is no quote. Whining about censorship here is laughable; complaining about moderation is usually deleted under the Comments Policy. -
Tom Curtis at 12:40 PM on 3 April 2011Muller Misinformation #1: confusing Mike's trick with hide the decline
Sorry, I included the lower magnification version of MBH 99 that I had already posted rather than this one: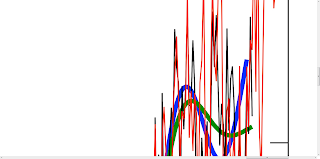 If a moderator could correct the error, I would be very thankful.
-
Tom Curtis at 12:37 PM on 3 April 2011Muller Misinformation #1: confusing Mike's trick with hide the decline
TTTM @107 simply asserts that he has the facts correct without argument. In doing so, he ignores the clear demonstration that his purported analysis is false - specifically the claims about truncation. To be perfectly clear about this, he* claimed that the third step of Mike's method was "Discarding all values of the smooth after the end of the proxy period." But the smoothed plot ends in 1973 for MBH 98, and 1978 or 1979 for MBH 99. Clearly the truncation method claimed by TTTM was not used. You can see this clearly for your self below: MBH 98 fig 5 end plot magnified twentyfold. The red marks indicate 1900 and 1950. The large black dashed line (splodge) is the smoothed function. The thin continuous line is the annual data which clearly continues past the last value of the smoothed function by several years (in fact 7).
MBH 99 (with alternate smoothing in green) magnified 10 fold. The blue line is the original MBH smoothing, the continuos black line is the year by year data, which clearly extends beyond the smoothed curve by at least one year, and probably two.
The second step is also false, in that it claims the instrumental period beyond 1995 (MBH 98) and 1998 (MBH 1999) was padded by the instrumental mean of the calibration period, ie, zero. This step is necessary in UC's reconstuction because he reconstructs the smoothed lines as terminating in 1980, so the intstrumental period does not provide enough padding by itself. But Mann does not extend the smoothed period beyond any value which would require such padding, ie, 1973 for MBH 98 and a 50 year smooth; and 1978 for MBH 1999 and a 40 year smooth.
So with steps 2 and 3 clearly refuted, all TTTM has to fall back on is the claim that Mann used the mean of the instrumental values to pad, as Mann claimes; or whether he uses the actual instrumental record itself as claimed by the "climate auditors". This subtle difference has been decided in the auditors favour by the auditors on the basis of eyeballing comparisons of unmagnified graphs which do not include any plots of a smooth padded with the mean of the values, ie, one of the two different methods at issue.
Frankly, I have followed TTTM's claims back to there source and amongst all their efforts, there is no attempt to plot a smooth using the mean of the instrumental values (Mann's claimed method) and hence no possibility of their having critically analyzed and rebutted that alternative.
Of course, had Steve McIntyre used Mann's actual method, he would not have had his apparent justification for slandering Michael Mann by saying:
"UC, that’s an interesting find. At the time of this post, we hadn’t managed to pin down Mannian smoothing methods – bu we did so in Sept last year while considering Mann 2008.
If you’re right about the splice, it places an interesting light on Mann’s outburst at rc:
MBH 98 fig 5 end plot magnified twentyfold. The red marks indicate 1900 and 1950. The large black dashed line (splodge) is the smoothed function. The thin continuous line is the annual data which clearly continues past the last value of the smoothed function by several years (in fact 7).
MBH 99 (with alternate smoothing in green) magnified 10 fold. The blue line is the original MBH smoothing, the continuos black line is the year by year data, which clearly extends beyond the smoothed curve by at least one year, and probably two.
The second step is also false, in that it claims the instrumental period beyond 1995 (MBH 98) and 1998 (MBH 1999) was padded by the instrumental mean of the calibration period, ie, zero. This step is necessary in UC's reconstuction because he reconstructs the smoothed lines as terminating in 1980, so the intstrumental period does not provide enough padding by itself. But Mann does not extend the smoothed period beyond any value which would require such padding, ie, 1973 for MBH 98 and a 50 year smooth; and 1978 for MBH 1999 and a 40 year smooth.
So with steps 2 and 3 clearly refuted, all TTTM has to fall back on is the claim that Mann used the mean of the instrumental values to pad, as Mann claimes; or whether he uses the actual instrumental record itself as claimed by the "climate auditors". This subtle difference has been decided in the auditors favour by the auditors on the basis of eyeballing comparisons of unmagnified graphs which do not include any plots of a smooth padded with the mean of the values, ie, one of the two different methods at issue.
Frankly, I have followed TTTM's claims back to there source and amongst all their efforts, there is no attempt to plot a smooth using the mean of the instrumental values (Mann's claimed method) and hence no possibility of their having critically analyzed and rebutted that alternative.
Of course, had Steve McIntyre used Mann's actual method, he would not have had his apparent justification for slandering Michael Mann by saying:
"UC, that’s an interesting find. At the time of this post, we hadn’t managed to pin down Mannian smoothing methods – bu we did so in Sept last year while considering Mann 2008.
If you’re right about the splice, it places an interesting light on Mann’s outburst at rc:
"No researchers in this field have ever, to our knowledge, “grafted the thermometer record onto” any reconstruction. It is somewhat disappointing to find this specious claim (which we usually find originating from industry-funded climate disinformation websites) appearing in this forum. Chu’s recent use of this graphic adds a little piquancy to this find."
(post 6th May 2009) So, anyone really interested in the truth can indeed find out the details, and the details clearly refute TTTM's claims. Unfortunately for him, the truth is to be found on this site rather than from the slander pits from which he regurgitates. *TTTM's claims, I have discovered, are in fact a simple cut and paste of claims made by Steve McIntyre, which is why his references to links have no links attached. I believe this to be against forum policy, although I would prefer if the comment was not removed.Moderator Response: [mc] Duplicate image replaced with blowup. -
TimTheToolMan at 11:10 AM on 3 April 2011Muller Misinformation #1: confusing Mike's trick with hide the decline
"So, TTTM's contention about the nature of the trick is incorrect, and John Cook is correct." I have simply described the facts about Mike's Nature Trick as determined by analysis and reproduction, you have described what Mike said about the "trick" Anyone who is genuinely interested can find out all the details for themselves and make their own opinion but one thing is certain... the facts cannot be found at sites like this one.Moderator Response: [DB] You entitled to your own opinions, just not your own facts. -
Tom Curtis at 10:21 AM on 3 April 2011Muller Misinformation #1: confusing Mike's trick with hide the decline
Turn's out people who make unwarranted accusations of (what they believe to be) wrong doing without adequate basis make me angry too. The difference between me and TTTM is I am angry because somebody is trying to drag somebody elses name through the mud without reason, while he is angry because their name is not being dragged through the mud without reason. Anyway, here is the terminal portion of a modified version of the MBH 99 graph blown up by 358%: The black line is the annual values of the reconstruction. The red line is the instrumental data. The blue line is the original smooth, while the green line is a smooth using the padding technique currently favoured by Mann. That technique uses only proxy values for the smooth.
TTTM claims using the instrumental values introduces a warming bias. However, quite plainly, the smooth using the instrumental mean terminates halfway between the last two values of the annual proxy data. In contrast, the proxy data only padding results in a smooth that terminates significantly below those values. So, and obviously, using proxy only data results in a cooling bias, as it inevitably must in a slope with a rapidly rising trend line. And that really is the point. Despite their high dudgeon, the "climate auditors" only care about the techniques of Mann (or Hansen, or Jones) because they record a rapid rise in temperatures in the twentieth century. Any technique that shows that rise they find objectionable, with consequent condemnation.
It should also be noted that contrary to TTTM's claims, the annual data in MBH 99 shows no inclination to decline. Rather it shows a relatively level temperature over the period 1945 to 1980 (as indeed is shown by the instrumental record) although the last two values may be the start of the rapid post 1975 rise in global temperatures.
The black line is the annual values of the reconstruction. The red line is the instrumental data. The blue line is the original smooth, while the green line is a smooth using the padding technique currently favoured by Mann. That technique uses only proxy values for the smooth.
TTTM claims using the instrumental values introduces a warming bias. However, quite plainly, the smooth using the instrumental mean terminates halfway between the last two values of the annual proxy data. In contrast, the proxy data only padding results in a smooth that terminates significantly below those values. So, and obviously, using proxy only data results in a cooling bias, as it inevitably must in a slope with a rapidly rising trend line. And that really is the point. Despite their high dudgeon, the "climate auditors" only care about the techniques of Mann (or Hansen, or Jones) because they record a rapid rise in temperatures in the twentieth century. Any technique that shows that rise they find objectionable, with consequent condemnation.
It should also be noted that contrary to TTTM's claims, the annual data in MBH 99 shows no inclination to decline. Rather it shows a relatively level temperature over the period 1945 to 1980 (as indeed is shown by the instrumental record) although the last two values may be the start of the rapid post 1975 rise in global temperatures.
-
muoncounter at 10:20 AM on 3 April 2011It's cooling
johnd#151: "I don't see this as strange" Probably not. But what is strange is the ability of deniersphere bloggers to trumpet an event like this as if it means something. From the post, Small numbers of juvenile harp seals are typically found each winter stranded along the coast of the northeastern United States. But this year, well over 100 adult harp seals – not juveniles – have been spotted … In some areas they’re reporting three times the normal number of sightings ... WUWT omits the part of the article where we learn that “the number of harp seals found in the northwest Atlantic” is “9 million.” So a hundred lost seals are news for Watt$ and co. But the 8,999,900 who know where they are don't get a mention. Now that's a cherrypick! -
Tom Curtis at 09:34 AM on 3 April 2011Muller Misinformation #1: confusing Mike's trick with hide the decline
Further to TTTM @101: The divergence problem does raise an issue about the ability of some tree rings to track temperature. It is, however, only some. Most tree rings do not show a divergence problem, and show the same long term pattern of temperature change in reconstructions. Further, non-tree ring proxies such as stalagmite data and coral data also show the same long term pattern of temperatures. This of itself implies the divergence problem is some unique problem due to modern industrial activity - and there are a host of potential candidates for the cause of the problem. The broader implications have been adequately discussed above. They show, not a rush to insert a "warming bias" by the scientists, but rather a rush to condemn on the basis of shoddy analysis by the "auditors". -
Tom Curtis at 09:26 AM on 3 April 2011Muller Misinformation #1: confusing Mike's trick with hide the decline
TTTM @101, the smoothing had no effect on the scientific results in MBH 98 and 99 as noted above, so you are wrong. As regards the WMO document, Jones decided to create three hybrid temperature proxies. There is nothing wrong with this. Nobody rational objects to the satellite temperature data because it uses a series of different satellites using different instruments, and hence constitutes a hybrid series. Nor are there any serious objections to the SST series that have similar problems. The only requirement for integrity in creating hybrid series is that you are clear that you have done so, and that you leave a paper trail so that anybody who wants to check on possible problems can do so. Jones did both. He clearly documented the inclusion of instrumental data, and he clearly referenced the source papers of the data he used so that anybody who thought there was a problem could back track and check. The response of real scientists to this would have been to back track, and then question the use of tree rings as temperature proxies. For the faux auditors, such quiet academic work was not enough because it could not raise the rabble. Instead they make trumped up charges of fraudulent activity. They then condemn themselves to an ever increasing and unsupportable conspiracy theory to maintain their trumped up charges as independent panel after independent panel looks at the charges and correctly finds that there was not academic wrong doing, and no questionable integrity in the case of the scientists involved. The integrity of people who would rather make accusations of wrong doing than notice that a graph ends in 1973 rather than in 1980 I leave to the reader to decide. -
Tom Curtis at 09:12 AM on 3 April 2011Muller Misinformation #1: confusing Mike's trick with hide the decline
Further to DBDunkerson @99, Michael Mann has commented on this issue at RealClimate. The most important point he makes is that the conclusions of the paper were made based on an analysis of the individual yearly records and decadal averages. Consequently the smoothing method makes no difference to the conclusions of the papers:"In some earlier work though (Mann et al, 1999), the boundary condition for the smoothed curve (at 1980) was determined by padding with the mean of the subsequent data (taken from the instrumental record). This does make a small difference near the end of the series. It doesn't effect any of the conclusions drawn in the paper though. These were based on comparisons of the individual reconstructed annual values (individual years and decadal averages over 10 consecutive years) from AD 1000-1980, with those from the recent instrumental record (1981-1998), and centered on the fact that the recent instrumental values were outside the error range of the reconstructed values over the past 1000 years and were not related to the smoothed curve."
Astute readers will also notice that Mann padded with the mean of the instrumental period rather than with the intstrumental measurements themselves. That is an important point. First, it means that in splicing the instrumental record to the proxy record, Jones was not emulating Mann's procedure. Therefore, "Mann's nature trick", contrary to TTTM, is not the three step procedure described by him (which is not a procedure ever used by Michael Mann). In fact, in a post co-authored by Michael Mann at RealClimate, the "Nature Trick" is explicitly described:"The paper in question is the Mann, Bradley and Hughes (1998) Nature paper on the original multiproxy temperature reconstruction, and the ‘trick’ is just to plot the instrumental records along with reconstruction so that the context of the recent warming is clear. Scientists often use the term “trick” to refer to a “a good way to deal with a problem”, rather than something that is “secret”, and so there is nothing problematic in this at all."
So, TTTM's contention about the nature of the trick is incorrect, and John Cook is correct. For those who are interested, the difference padding with the instrumental record (as TTTM claims Mann did) and padding with the mean of the instrumental record (as Mann actually did) can be seen by comparing figures 1 and 3 above. In figure 1, Jones did pad with the instrumental record. The result is a much larger slope on the end of the tail, even in the final years of the 70's (ie, the end of MBH 98 and 99's smooth) as the final value closes on the mean. The exact behaviour does depend on the smoothing function used, so this difference is probably not that significant. As a side note, TTTM's third about truncation is definitely false. In MBH 98, a 50 year smooth is used, and the smoothed function terminates in 1973 (see figure 5 (PDF), ie, 25 years before the padding data ends, and 7 years before the proxy data ends. In MBH 99 a 40 year smooth is used and the smoothed function ends in 1979 (see figure 3 above), ie, twenty years before the padding data ends and 1 year before the proxy data ends. Clearly the end of the smoothed function was simply a consequence of the algorithm used, not the result of a deliberate truncation. These errors in the "reconstruction" of MBH's methods are typical of the "climate auditors". They repeatedly think of methods to "reconstruct" climate scientists' procedures that sound suitably culpable to them (or can be spun that way) and then present that as though it was an actual reconstruction of the scientists methods without checking the fine details that distinguish between those methods and closely similar methods. They are so slack that, as seen above, they can describe a graph terminated in 1973 as being terminated in 1980, visually a very noticeable difference. In this case, even if Mann had used TTTM's methods 1 and 2, there would have been nothing wrong with it. To my mind, it would have been more defensible than using the 20 or 25 year mean of the last values in the proxy data (a common alternative). Any padding of a smoothing function constitutes a prediction of future values of the smoothed data. Using a 25 year mean of the proxy data would constitute a prediction that the data would have a negative trend after 1980 reaching a value equal to the mean of the 1955 to 1975 values in 2005. Given this is a temperatures proxy, which has tracked temperatures very well since 1880, it seems far more likely that the proxies would continue to track temperatures. Using the instrumental values to pad the series, ie, predicting the proxies would continue to track temperatures, therefore seems wholly defensible. In contrast, it would not be defensible as a method of padding Briffa's series which demonstrably does not track temperatures post 1960. That, or course, is not what Jones did in the WMO report. Rather, he created a hybrid temperature reconstruction from two sources of data, as he in fact informed us in that document. -
Rob Honeycutt at 09:11 AM on 3 April 2011Hockey stick is broken
TTTM said... "Take out the smoothing and the uptick at the end of the series in figure three (above) disappears. The temperature proxy should show a decline in temperatures as recorded by the tree rings." The problem there is that there in no decline in the temperature. We have actual recorded data showing what the modern temps are. -
adelady at 08:36 AM on 3 April 2011Muller Misinformation #1: confusing Mike's trick with hide the decline
I've posted my reply at Is the hockey stick broken Moderator, please delete from this thread if you wish. -
adelady at 08:33 AM on 3 April 2011Hockey stick is broken
This is a response to TTTM @ Muller Misinformation#1 "Adding a warming bias" = "Using modern, accurate records"? You know something? Whenever I have something modern that accurately performs some task, I prefer it. Using a laser level when doing household repairs is a great deal better than the tedious back-and-forthing of earlier techniques. However, we sometimes find ourselves without our modern gadgetry, so we use the best of what we've got. When we get the chance we check with the best modern equipment and information. And that's what the paleo + modern assembly does. It would be really terrific if every single paleo reconstruction were both accurate and adequate for recent, shorter timescales, but some aren't for one reason or another, eg the ones with century averaging periods. We do the best we can with what we've got. And MBH's work has been validated by similar results with other paleo series that don't have such issues. If MBH were being promoted as the "best" despite disagreement with everyone else's work in this field, you might have a point. But there's agreement, so your point fails. -
johnd at 08:16 AM on 3 April 2011Newcomers, Start Here
MMead at 07:18 AM, it's quite possible that you did enter it correctly, but sometimes gremlins do appear that cause links not to work as intended. At times the moderators will correct such broken links as is often noted on some posts, but obviously not always. I try to use the preview panel to make sure the link works, or even check it immediately as the post appears just to prove it out. If you are wanting more discussion about the study you presented, it may yield more results if you repost it again on a more appropriate thread as it appears that it has not found much interest to comment here. Out of sight, out of mind perhaps? -
adelady at 08:04 AM on 3 April 2011It's cooling
johnd, and we must also acknowledge that, every single year, some birds fly off in the wrong direction for their escape from winter. -
TimTheToolMan at 08:02 AM on 3 April 2011Muller Misinformation #1: confusing Mike's trick with hide the decline
"Take out the smoothing and you know what the results show? Exactly the same thing, just with more bumpiness on the curve." Wrong. Take out the smoothing and the uptick at the end of the series in figure three (above) disappears. The temperature proxy should show a decline in temperatures as recorded by the tree rings. The broader implication of divergence to dendrochronology is that because divergence is not understood, tree rings cannot be relied upon to accurately reflect temperature. [ -SNIP!- ]Moderator Response: [DB] Accusations of fraud and scientific misconduct snipped. This is not CA where anything goes. Commenting here is a privilege, one that can be rescinded. Be advised. -
MMead at 07:18 AM on 3 April 2011Newcomers, Start Here
Stu and johnd, thank you for your replies. I thought I entered the link according to the tips provided, but being a technological dinosaur, I apparently did it incorrectly. My apologies and thanks for correcting it. -
Philippe Chantreau at 05:37 AM on 3 April 2011Hockey stick is broken
Considering all the accusations of fraud and incompetence that have been thrown at Mann for the hockey stick, I find it especially important to point toward what can be uncovered when the skeptics's work is examined with the kind of attention they claim should be applied to scientific work. A major point in the accusations of McIntyre is from McIntyre&McKitrick 05, which expanded on a previous 04 paper. It is there claimed that Mann's statistical methods generate hockey sticks from artificially generated random data that do not contain a signal. Closer examination of the M&M computer code used in this "discovery" shows that the code is designed to sort hockey stick shapes first, then retain only these samples from a much larger number. These are the ones shown by M&M. The rest of M&M's work is riddled with much of what they accuse others to practice. The much touted Wegman report is no better. In addition wegman has been especially reluctant to let others examine his computer code, a behavior that skeptics systematically equate with fraudulent intentions. Thanks must be given to Deep Climate for investigating this in real skeptic fashion: http://deepclimate.org/2010/11/16/replication-and-due-diligence-wegman-style/ http://deepclimate.org/2010/10/25/the-wegman-report-sees-red-noise/ http://deepclimate.org/2010/10/08/wegman-under-investigation-by-george-mason-university/ What is most shocking about the whole thing is how little attention has been paid in the mass media, always so quick at picking up climate deniers accusations toward scientists. -
Rob Honeycutt at 05:24 AM on 3 April 2011Muller Misinformation #1: confusing Mike's trick with hide the decline
TTTM... Can you please inform us as to how that would alter any of the broader implications of the research? As I seem to remember, MBH98 is not a study on a temperature reconstruction of the past 100 years, it's a study on a temperature reconstruction for the past 1000 years. Right? So, can you tell me how CA's quibbling over Mann's methods of splicing the data changes the broader conclusions of the research? -
Philippe Chantreau at 04:31 AM on 3 April 20112nd law of thermodynamics contradicts greenhouse theory
LJR, I have to thank you for the link to Pr Jin-Yi Yu's lecture, which indeed could not be recommended enough. It certainly would be a nice addition to the site, or to the scientific guide. -
johnd at 04:22 AM on 3 April 2011It's cooling
muoncounter at 02:39 AM, most animals are very sensitive to subtle changes occurring in their natural environment. This is almost always reflected in their reproductive process where breeding rates adjust according to the coming seasonal conditions. For those animals that produce multiple offspring, the "choice" as to how many there will be is made at the beginning of the breeding cycle well before the conditions that will support the increased numbers that eventuate are evident, to man at least. It is not a case of always producing multiple births and the excess perish, animals that normal carry one offspring, or at times miss breeding altogether, will suddenly carry multiple embryo's. Another example that is often observed is water birds building nests at elevations that seem to account for the coming seasonal water level. I don't see this as strange, as whilst most people are becoming even more oblivious to coming change, (how many people need to be told by the TV news that it's going to rain whilst others sense it days, even weeks ahead), the change when it eventuates is not a spontaneous happening, but the culmination of a long process where subtle indicators begin to appear well before the eventual outcome. This is witnessed by our increasing ability to produce more accurate short and long range forecasts, the difference between those who have limited ability, and those who seem to have an uncanny ability, is that the latter have discovered what the most relevant indicators are, that combined produce an accurate prediction. Whist man must rely on formulas and theories in order to bring it all together, and this is the important bit, it is all based on measurements that are taken from the physical world. Now taking the forecasting of SST's as an example, some researchers believe they now have the ability to accurately forecast perhaps two years ahead. That means that the indicators they are tracking this very day are changing in such a way, that they indicate the beginning of a process leading to an eventual outcome in two years time. It may well be that that process is already well advanced, but man's ability to sense it, and thus measure it is still very limited. Thus if we accept that what occurs at any point in time is not a spontaneous event, (even though some people always seem to get soaked because they didn't have a clue it was going to rain), but instead a result of a long ongoing process, don't you think that at least some of the animals that live in that physical world are also able to sense well ahead of time, those subtle changes that we are only finally learning to map and understand. -
muoncounter at 02:39 AM on 3 April 2011It's cooling
Anyone in need of a laugh must read this CP analysis of the latest wackiness in Watt$ land: Seals predict cooling! Canadian Harp Seals may have “read” the predictions of the coming decades of stabilization of global temperatures and perhaps some cooling. Animals like the Harp Seal have experienced many millions of years of climatic change and, through the complex processes of evolution and natural selection, may have developed an ability to sense coming changes. -
CBDunkerson at 02:32 AM on 3 April 2011Muller Misinformation #1: confusing Mike's trick with hide the decline
TimTheToolMan, you do realize that the practical difference between the 'infuriating', 'ignorant', and 'untrue' explanation and your own is effectively nil, right? Take out the smoothing and you know what the results show? Exactly the same thing, just with more bumpiness on the curve. The current rate of warming is still greater than anything found in the proxy records. Temperatures now are still the warmest in the studied period. Every conclusion of MBH98 and MBH99 is still just as valid... as should be obvious given the numerous studies since then (even 'skeptic' studies) which have validated it. The difference between this and 'making a mountain out of a mole hill' is that the mole hill actually has some elevation to it. -
muoncounter at 02:30 AM on 3 April 2011A Plan for 100% Renewable Energy by 2050
Gilles#149: "We begin the era of struggle for exhausting resources - meaning in reality the end of economic growth" So the real Gilles has finally emerged: Civilization to collapse, apocalypse on the horizon. Why then are you not fully committed to this or some other fully renewable scenario, as the last gasp of a civilization in peril? Could it be that it's simply easier to be a nay-sayer, shouting 'non!' at every opportunity? Could it be that doing the work necessary to offer something constructive is not Gilles' cup of cafe-au-lait? -
KR at 02:20 AM on 3 April 20112nd law of thermodynamics contradicts greenhouse theory
L.J. Ryan - Fascinating post, you've obviously put a lot of work into it. It is, unfortunately, completely incorrect. Tom Curtis has shown that far more rigorously than I could. As les noted, you have an embedded link to a Professor Jin-Yi Yu's lecture on the greenhouse effect. It's a nice presentation - I suggest you actually read it, and it's conclusions, rather than mining it for equations. -
Tom Curtis at 02:06 AM on 3 April 20112nd law of thermodynamics contradicts greenhouse theory
LJRyan @924: 1) The emissivity/absorptivity of a body varies with wave length. Therefore there is no absolute emissivity, only emissivity/absorptivity relative to a certain range of frequencies of emissions/absorptions. Hence we have: (Eq 1a') reflectivity(sw) = earth's albedo(sw) = 0.3 Eq 1a") 1 - reflectivity(sw) = emissivity(sw) = 0.7 (Eq 1b') reflectivity(lw) = earth's albedo(lw) = 0.02 (Eq 1b") 1 - reflectivity(lw) = emissivity(lw) = 0.98 Where (sw) indicates the range of wavelengths at which the Sun's radiation is most intense, and (lw) indicates the ranges of wavelengths at which the Earth's thermal radiation is most intense, and where equation (1a'and ") consider the whole Earth system, while equations (1b'and ") consider only the surface of the Earth, and do not include the effects of the atmosphere. 2) (Eq 2) is ok as it stands, provided it is indexed for wavelengths as in equation 1. 3) Equation 3 is false in that you interpret σTe^4 as dealing with the Earth's surface only, while S/4*(1-A) definitely deals with the total incoming radiation at the top of the atmosphere. Consequently, equation 3 should read: (Eq 3) σTe^4 = S/4*(1-A) where Te is the effective temperature of the outgoing radiation at the top of the atmosphere, S is the total incoming solar radiation at the top of the atmoshere and A is the Earth's Albedo. Because equation 3 is valid only for the TOA, it places no limit on surface temperature of the Earth by itself, and no limit on the maximum energy radiated by the surface per second. 4) Equation 4 is false. The maximum black body absorption at the TOA is S/4, ie, the case where the Earth's albedo is zero. In this case, it is approximately 340 w/m^2. 5) Equation 5 is false. You had already applied the shortwave emissivity by compensating for Earth's albedo. There is no need, and it is contradictory to apply a second and different emissivity value. 6) Adjusting for errors to date, equation 6 is true. Stated correctly it is that the maximum out going radiation from the Earth at the top of the atmosphere, averaged over time, is S/4 or approx 340 w/m^2. Note, this is a TOA equality, not a surface equality, so as yet it tells us nothing about the Earth's surface temperature. 7) Equation seven and comments are irrelevant because of the preceding errors. We are not screaming about forcings. We are wondering why you can't even get the simple things right. I will not comment further at this time because: a) You have not established the appropriate groundwork, and are instead working on a host of demonstrably false assumptions. b) Your tables which carry your argument have unclear symbols, and are derived by an unexplained method. In other words, they are simply bare assertions. -
Bob Lacatena at 02:03 AM on 3 April 2011Arctic Ice March 2011
68, Ken Lambert, Number silliness. Confuse people with "ooh, that's no so much" analogies. Nice try. First, Arctic ice extent is down from the 1978-2000 average by 40%. That's 6.5 million kilometers. In addition, even within the area that still has 15%+ ice, the ice is clearly not evenly distributed over the extent. There will be more ice at higher latitudes, where the angle of incidence of the sunlight is less direct. The areas which receive more direct sunlight will have much less ice, even if they are part of the minimum extent, and so the area we are considering is even greater than 6.5 million kilometers. You also talk about only 3 months of solar radiation with low or negligible albedo. This is wrong. First, the Arctic day at that time of year is 24 hours long, so every day is like two equatorial days (or 3 temperate days, to put things in perspective for the casual readers who tend to live in temperate climates), so 3 months are more like 6 to 9. Similarly, the area did have a low albedo when it was covered with ice. The albedo of water is very dependent on the angle of incidence. Since at that time of year the angle of incidence is great than that at the tropics (66˚ at peak), it is like a non-stop tropical sun. The albedo of snow/ice is 0.9. The albedo of water at an angle of incidence 40˚ or higher is 0.1. Far from negligible, it is quite the opposite. Open water at that angle absorbs almost everything the sun can beam down. 24 hours a day. Over an area greater than 6.5 million kilometers (versus what used to happen, before global warming kicked in). With almost nothing reflected back. And it's getting worse! The day will soon come when that 6.5 million km2 area is even larger. As far as Antarctica being "the big knob," that's silly. Antarctica is a continent, covered with mountains, so the surface is at altitude and always well below freezing. No melting on the continent itself is remotely possible. No matter how much the earth warms, the area of ice over Antarctica will not change. The "big knob" there can't be turned, so it's not a knob at all. Stop distracting and confusing people with gibberish. -
L.J. Ryan at 02:03 AM on 3 April 20112nd law of thermodynamics contradicts greenhouse theory
Riccardo 927 you said: "that's just your interpretation" Be a bit more specific please. What is "that"?

Prev 1793 1794 1795 1796 1797 1798 1799 1800 1801 1802 1803 1804 1805 1806 1807 1808 Next


