


 Arguments


Recent Comments
Prev 1795 1796 1797 1798 1799 1800 1801 1802 1803 1804 1805 1806 1807 1808 1809 1810 Next
Comments 90101 to 90150:
-
Gilles at 03:44 AM on 2 April 2011A Plan for 100% Renewable Energy by 2050
mucounter - I'm saying nothing else for oil. Now if you think that the decrease of oil production will be driven by lower demand and reconversion to other energy sources, and not by geological availability, there is a very simple associated prediction : that prices should plunge and oil extraction will be given up because there aren't enough customers - that exactly what happened in the 80's with the oil counter-shock, that provoked both a nosedive of barrel price and a decrease of production/consumption - and this happened also very briefly just after the 2008 recession . But if the decrease is due to a lack or resources, you expect just the opposite : that the price will climb to heaven and that the high price will discourage customers to buy it -much probably through strong recessions and demand destruction. what's your favorite scenario ? concerning agencies : too bad that all sres scenarios are based on the numbers provided or used by the same agencies. But I don't see why they would be "instructed" to say that we need to find new oil fields that we don't know yet where they are- that's not good news for OECD ! and what's wrong with back-of-the-envelope calculations ? -
cjshaker at 03:39 AM on 2 April 2011Temp record is unreliable
Surprise! Professor Muller says that the IPCC temperature trend information is reasonable http://us1.campaign-archive2.com/?u=d8548cad5e5305433c810b0d4&id=fc86e0f3ab&e=36d50f5714 "In Summary Despite potential biases in the data, methods of analysis can be used to reduce bias effects well enough to enable us to measure long-term Earth temperature changes. Data integrity is adequate. Based on our initial work at Berkeley Earth, I believe that some of the most worrisome biases are less of a problem than I had previously thought." -
Rob Honeycutt at 03:16 AM on 2 April 2011Crux of a Core, Part 3... Dr. Ole Humlum
Gilles... You also might check out Dr Box's website which shows the modern temperature record for Greenland. You'll see that "no significant warming trend in the past decade" is demonstrably wrong. -
Rob Honeycutt at 03:10 AM on 2 April 2011Crux of a Core, Part 3... Dr. Ole Humlum
Gilles... You're in active pursuit of a straw man argument. I highly recommend you read the comments made by Dr Alley in Revkin's article that I linked above. -
muoncounter at 02:51 AM on 2 April 2011A Plan for 100% Renewable Energy by 2050
Gilles#135: "The peak in FF production is always governed by the offer, not the demand. No company stop drilling and extracting oil when the well is drilled, before it is exhausted." You've already demonstrated that you know nothing about the oil business; at least you're consistent because that's just false. Wells are abandoned when the economics turn unfavorable. If it costs more to produce than you can get for it, you stop producing. Gilles#141: "if it's true, why does all energy agencies seem to ignore it ?" Why do you assume it is the business of an 'energy agency' to do anything other than what they are instructed to do? In these cases, you've created some mythic significance from the presence of an 'oil to be found' term in an IEA forecast, fabricating a conclusion from it: 'They include it, so it must be vital to our society.' Nonsense. And now come the back-of-the-envelope calculations, which are of course based on complete understanding of energy use. This is the more appropriate xkcd for this situation. -
Gilles at 02:37 AM on 2 April 2011Crux of a Core, Part 3... Dr. Ole Humlum
Figure 3 clearly shows that variation of Greenland summit temperatures are * not* correlated with the variation of CO2 in paleoclimatic data (whatever this means - there is no obvious correlation). Given this objective fact, why use the current rise of Arctic temperatures as evidence for the influence of GHG ? Remarkably , the recent loss of Arctic ice is *not* related to a particularly high change in average temperatures. Actually the last decade has not shown any significant trend, and certainly not an acceleration.Moderator Response: [muoncounter] See global warming stopped in... for documentation that 'the last decade has not shown any significant trend' is false. -
Rob Honeycutt at 02:21 AM on 2 April 2011Crux of a Core, Part 3... Dr. Ole Humlum
Tom @ 6... Here is where I get some of the information regarding misuses of GISP2 data, and specifically the idea that snow drifts can cause some anomalous readings in the data. It's some material posted on Andy Revkin's Dot Earth blog.Second, although the central Greenland ice-core records may provide the best paleoclimatic temperature records available, multiple parameters confirm the strong temperature signal, and multiple cores confirm the widespread nature of the signal, the data still contain a lot of noise over short times (snowdrifts are real, among other things). An isotopic record from one site is not purely a temperature record at that site, so care is required to interpret the signal and not the noise. An extensive scientific literature exists on this topic, and I believe we are pretty good in the community at properly qualifying our statements to accord with the underlying scientific literature; the blogospheric misuses of the GISP2 isotopic data that I have seen are not doing so, and are making errors of interpretation as a result.
-
Rob Honeycutt at 02:03 AM on 2 April 2011Crux of a Core, Part 3... Dr. Ole Humlum
RSVP... Please note that my Fig 4 graph is Holocene only. -
lord_sidcup at 01:16 AM on 2 April 2011Debunking Climate Myths from Politicians
@31 Regarding John Redwood, I had a look through his blog and it is an absolute goldmine of badly constructed straw men. Here is a quite bizarre quote from last year: "It was good to hear the scientific establishment today concede what some of us have been saying for a long time – that changes on the sun can have an impact on our climate. I look forward to sun variations being included in models forecasting changes to earth temperatures." Time to revise climate change models? Another UK politician to watch out for is one time Conservative Party leadership contender David Davies: Why this ferocious desire to impose hair-shirt policies? "The case is not helped by the fact that the planet appears to have been cooling, not warming, in the last decade." -
Chris G at 01:14 AM on 2 April 2011Crux of a Core, Part 3... Dr. Ole Humlum
I sometimes use logarithmic scales when I have small values and large values on the same graph. But, then, I also sometimes have trouble when viewers don't understand just how large the actual differences are when looking at said graph. -
Bob Lacatena at 01:11 AM on 2 April 2011Arctic Ice March 2011
58, Ken Lambert Yes, yes, of course. Nothing to worry about. All is well. It's only a tiny place, and it's cold and far away. Don't worry about the Arctic melting for the first time in tens (hundreds?) of thousands of years. Don't worry about global warming, people! It's nothing. It's all exaggerated alarmist tripe. The Arctic is small. The ice recovers every winter. Temperature records are unreliable. It's all natural. Et cetera, et cetera. How many thousands of excuses can the denial crowd come up with to justify coordinated collective irresponsibility? -
Gilles at 01:07 AM on 2 April 2011A Plan for 100% Renewable Energy by 2050
Bern, you deviate to other topics - I would like however to make you notice that "X and Y published dire predictions for Z centuries" is not per se a proof they're right. And even if it were true, saying that doesn't say nothing about the inverse consequences of suppressing totally the FF consumption of the very same people you are supposed to save. You can claim that the consequences are negligible, but I stick to my question : if it's true, why does all energy agencies seem to ignore it ? -
Arkadiusz Semczyszak at 00:35 AM on 2 April 2011Acidification: Oceans past, present & yet to come
I also recommend a very interesting discussion by Nature Blogs. -
Arkadiusz Semczyszak at 00:31 AM on 2 April 2011Acidification: Oceans past, present & yet to come
Paper above applies to the economically important species - and yet only one of the species - does not provide the basis for good general conclusions. How - in general - the organisms react to reduce the alkalinity of the oceans? I do not know if it was discussed at Sc.S. this paper: Meta-analysis reveals negative yet variable effects of ocean acidification on marine organisms, Kroeker et al., 2010. But it is worth recalling some of the conclusions of this paper: “A variety of biological responses to ocean acidification have been measured across a range of taxa, but this information exists as case studies and has not been synthesized into meaningful comparisons amongst response variables and functional groups.” “Calcification responses varied significantly amongst organisms using different mineral forms of calcium carbonate.” “... the responses of calcifying algae were highly variable.” “Our results support the hypothesis that highly mobile organisms with developed intracellular/extracellular pH regulatory mechanisms may be more resilient to ocean acidification.” “We did not detect significant effects of ocean acidification on photosynthesis in the overall weighted, random effects analysis.” “In conclusion, our analyses revealed a strong negative effect of ocean acidification on marine organisms despite the variation in the sensitivity of taxonomic groups and developmental stages. However, differential sensitivities still have important implications for marine ecosystems where individual species often play disproportionately strong roles in structuring communities ...” ... however wikipedia: “However, some studies have found different response to ocean acidification, with coccolithophore calcification and photosynthesis both increasing under elevated atmospheric pCO2, an equal decline in primary production and calcification in response to elevated CO2 or the direction of the response varying between species. Recent work examining a sediment core from the North Atlantic found that while the species composition of coccolithophorids has remained unchanged for the industrial period 1780 to 2004, the calcification of coccoliths has increased by up to 40% during the same time.” Increasing Costs Due to Ocean Acidification Drives Phytoplankton to Be More Heavily Calcified: Optimal Growth Strategy of Coccolithophores, Irie et al. 2010.: “Contrary to the widely held belief, the evolutionarily optimized population can precipitate larger amounts of CaCO 3 during the bloom in more acidified seawater, depending on parameter values. These findings suggest that ocean acidification may enhance the calcification rates of marine organisms as an adaptive response, possibly accompanied by higher carbon fixation ability. Our theory also provides a compelling explanation for the multispecific fossil time-series record from ~200 years ago to present, in which mean coccolith size has increased along with rising atmospheric CO 2 concentration.” Coral reefs and ocean acidification synopsis ISRS, Briefing Paper 5, 2008.: “Most experiments have not indicated negative impacts on coral tissue growth under elevated carbon dioxide. Indeed, recent experiments have shown that some species cultured under high carbon dioxide concentrations can lose their skeletons altogether without apparent physiological stress or reductions in growth, and then resume skeletal building once carbon dioxide levels are returned to normal.(...).” Impact of CO2-driven ocean acidification on early life-history – what we know and what we need to know, Dupont, Havenhand and Thorndyke, 2009.: “At the same time, more physiological studies are needed to understand contradictory results (e.g. species-specific responses in closely related taxa) and solve apparent paradoxes (e.g. positive impacts in notionally “at risk” species such as calcifying sea urchins). Ultimately, more realistic experiments (e.g. mesocosms, synergy with other environmental parameters, multigeneration, etc.) are needed to upscale experimental data to the ecosystem level. (...)” I also recommend a very interesting discussion by . -
JMurphy at 23:54 PM on 1 April 2011Debunking Climate Myths from Politicians
In addition to the above, there is no need for this site to debunk Lawson (as if it was even necessary, I know), because the British chief scientific advisor, Sir John Beddington has already done so, as seen in letters that have just been released. -
Ken Lambert at 23:50 PM on 1 April 2011Arctic Ice March 2011
johnd #54 and #56 MC #57 Quite right again johnd. Many of these charts showing large red areas of warming are Mercator projections which grossly distort the high latitudes and infinitely expand the north and south poles to the same dimension as the equator. Without an equal area projection, the proper scale of the Arctic is not obvious to the non-geographer. DB's Insolation chart captioned; "The Arctic in summer receives more daily energy from the sun, both at the surface and the TOA, than does the equator" is also misleading. What DB should have captioned is that the Insolation (energy flux)at TOA for May, June ,July is higher than at the equator, but the total energy available (W/sq.m x Area in sq.m) is small compared with the tropics due to the small surface area above 60N and the much higher average insolation through the whole year at tropical latitudes. -
Bern at 23:46 PM on 1 April 2011A Plan for 100% Renewable Energy by 2050
Gilles, it wasn't intended to be ad hom, rather humorous (thus the XKCD ref and the smiley face :-). I'm happy for a mod to delete it, though, if you feel it's ad hom. Regarding the methane emissions - I just did a bit of searching, and the total amount is staggering - estimates vary from ~1,000 GtC to ~1,000,000 GtC locked up in permafrost & clathrates. Luckily for us, it seems that only a small part of that is likely to be released - one paper I found suggested it might only increase GHG forcing by ~10-25%. (phew!) On the other hand, there is significant evidence that the melting process has already started. Regarding the "safe" level of GHG: there are a number of climate scientists who think that it's more around 350ppm - meaning we need to *remove* CO2 from the atmosphere, rather than add to it. Hansen & Sato's recent paper [pdf] certainly makes a strong argument that a 450ppm target will lead to dramatic changes in climate and significant sea level rise (on the order of 4-6 metres or more). -
Gilles at 23:20 PM on 1 April 2011A Plan for 100% Renewable Energy by 2050
"ln(450/280) * FF = 2.05C Your '540 ppm is safe' view would instead put us at about 2.8C over pre-industrial levels... which most projections indicate would cause changes in sea level, freshwater supplies, and cultivatable land at a pace many nations would not be able to handle" could you please find me a reference showing that any of these things would be manageable with 2 °C and not with 2.8 °C ? is the 2°C some magic limit - it's fortunate that the Celsius scale gives suche an easily rememberable figure ! -
Gilles at 23:17 PM on 1 April 2011A Plan for 100% Renewable Energy by 2050
CBD If you ignore the amount of carbon we're burning each year, I think you'd better refresh somewhat your readings. Actually it is a little bit less than 10 with FF only, a bit more including deforestation, but i'm only doing back-of-the-envelope calculations. 2000Gt/30 = 67 years approximately (not 200), giving 133 ppm more at the current rate, so it's more 520 ppm - I took 540 for a conservative estimate including methane, deforestation, and so on - CO2 is always the main driver. I don't expect runaway methane emissions with such a level- please correct me if you know a valid reference that says the opposite. Now I took only the transient response in 2100 , that's why I didn't take the full 0.8 °C - 0.5 °C is an order of magnitude. For slow feedbacks, you have to take into account that the CO2 will also decrease with time with the slow reabsorption by the wells after the production has decreased - the whole temperature curve must be numerically integrated but I don't expect it will vary much after that. and as everybody knows, in 2100, we'll have found a lot of solutions to compensate for the loss of FF - which means in theory no limit for developing the whole mankind since finite stock resources won't be a problem anymore. I don't see why, if all mankind has become rich , it couldn't mitigate the impact of CC just as rich countries can do it currently. -
JMurphy at 23:06 PM on 1 April 2011Debunking Climate Myths from Politicians
Lawson was at it again recently, in the Spectator 'debate' in London. As usual it was non-scientific so-called skeptics (Lawson and Peiser from the GWPF, plus a Labour MP), arguing against scientists (Tim Palmer, David King, Simon Singh). Although the audience was mainly Spectator types, it would appear that more people were convinced of the dangers of AGW after the debate than before. -
CBDunkerson at 22:51 PM on 1 April 2011Muller Misinformation #1: confusing Mike's trick with hide the decline
Gilles: "Fine : if they are, the we can deduce with a great confidence from Fig 3 that most of the XXth century temperature rise has occurred before 1970, so it must be perfectly natural." Actually Fig 3 shows that unicorns are real and that therefor we no longer have to worry about cancer. No, I can't really back that up... but it bears about as much resemblance to reality as your description of the graph. -
CBDunkerson at 22:42 PM on 1 April 2011A Plan for 100% Renewable Energy by 2050
Gilles, actually the '10 Gt/yr' value was yours too. Like I said, I didn't check your numbers... just pointed out that the math doesn't work. At that, if we change 10 to 30 it still doesn't come out to 540 ppm. You don't give the calculations for how you get to 540 ppm only causing a 0.5 C increase over 450 ppm, but >my< 'back of the envelope' calcs would go something like this; At best estimates of climate sensitivity a doubling of CO2 is expected to cause 3C warming from fast feedbacks (FF) and 6C warming from slow feedbacks (SF). Ergo; FF * ln(2) = 3 -> FF = 4.33 SF * ln(2) = 6 -> SF = 8.66 ln(540/450) * FF = 0.79 C ln(540/450) * SF = 1.58 C So again, your 'abbreviated math' doesn't seem to match up. I was actually able to 'follow' your conclusion that 700 * 3 = 2000, but from there it seems to get progressively less accurate. For the record, the 450 ppm figure was derived based on a goal of limiting fast feedback warming to 2C over the pre-industrial level. We can use this to validate my formulas above; ln(450/280) * FF = 2.05C Your '540 ppm is safe' view would instead put us at about 2.8C over pre-industrial levels... which most projections indicate would cause changes in sea level, freshwater supplies, and cultivatable land at a pace many nations would not be able to handle. -
CBDunkerson at 22:09 PM on 1 April 2011Crux of a Core, Part 3... Dr. Ole Humlum
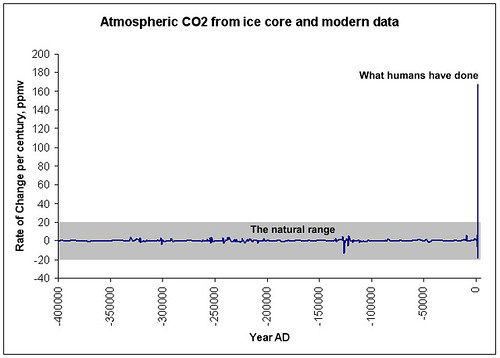
Yeah, that 'rate of atmospheric CO2 change' graph ought to be added to the 'CO2 increases are natural' rebuttal. I knew that CO2 increases of about 100 ppm took thousands of years throughout the interglacial cycle as opposed to mere decades now, but seeing that represented visually really drives the point home. The only 'problem' with the graph is that natural rates of change have always been so small in comparison that they are practically invisible at this scale. It might be worth having a 'blowout' at a more detailed scale to show that there were natural variations going on... they were just insignificant compared to the current human driven change. -
pkm at 20:55 PM on 1 April 2011Crux of a Core, Part 3... Dr. Ole Humlum
@9 RSVP, that graph shows the rate of change rather than the CO2 levels themselves... It is indeed a stunning perspective, that I will incidentally use in a few weeks in a presentation on CO2. I calculated the other day that current CO2 increase is about 2 ppm per year, whereas the increase rate during the last deglaciation was in the order of 0.007 ppm per year. More than 2 orders of magnitude smaller! -
Gilles at 19:49 PM on 1 April 2011Muller Misinformation #1: confusing Mike's trick with hide the decline
"There's an entire research field devoted to dedrochronology, and there's strong evidence that in most cases, tree rings are a good temperature proxy." Fine : if they are, the we can deduce with a great confidence from Fig 3 that most of the XXth century temperature rise has occurred before 1970, so it must be perfectly natural. -
RSVP at 19:06 PM on 1 April 2011Crux of a Core, Part 3... Dr. Ole Humlum
To Rob Honeycutt as per graph posted in pbellin 3 For all practical purposes, the CO2 level is completely flat in your graph. Should'nt it contain oscillations that reflect past ice ages? What the graphs seems to transmit is either we never had any ice ages, or if we did, CO2 ppm has no bearing on temperature. The great spike at the right also suggests this even more when you consider how little temperature has changed in recent years.Moderator Response: [DB] The graph of which you speak is clearly labelled as depicting the rate of change per century. As such it is a direct, apples-to-apples comparison between time periods. Apologies to the Bard, but "Context is the thing." -
Glenn Tamblyn at 18:37 PM on 1 April 2011Of Satellites and Air – A Primer on Tropospheric temperature measurement by Satellite
Daniel. If we have a supervolcano, then we can take AGW of the table as an agenda item for a while. And I will probably stop saving for my retirement. How can I spend my (very limited) wealth in a way that gives me the most fun before I croak?Moderator Response: [DB] Given the effects, if that supervolcano is Yellowstone here in the US, I might only have a few months. But the likelihood is far less than the temperature forcing from CO2. :) -
Stu at 18:05 PM on 1 April 2011Debunking Climate Myths from Politicians
"I believe Mr. Sarkozy is technically correct." The best kind of correct! Cheers Futurama. However, that doesn't mean he's not also wrong, sort of, cos it misses the point. Colder stratospheric temps would have only a small effect on ozone concentrations were it not for all the halogenated compounds we put there. I've been struggling for a decent analogy... maybe it's like leaving you freezer open and worrying that your kitchen is now a bit chilly, ignoring that all your food has gone off and the floor's just about flooded. Erm... yes? -
Rob Painting at 17:55 PM on 1 April 2011Acidification: Oceans past, present & yet to come
Agnostic @ 26 - Steve Baines may be referring to this paper Effect of Ocean Acidification on Iron Availability to Marine Phytoplankton. I don't have a copy, but it is discussed in sufficient depth here. -
Gilles at 17:34 PM on 1 April 2011A Plan for 100% Renewable Energy by 2050
" Given Gilles' persistence in posting here, and the content of the messages, I feel we're seeing one of two things: a sock-puppet, or someone who really believes what they're posting, a la this XKCD comic. Personally, I hope it's the latter. :-)" just a question for moderation : does this belong to the class of "ad hominem comments" , or not ? -
Gilles at 17:33 PM on 1 April 2011A Plan for 100% Renewable Energy by 2050
scaddenp, you asked me to answer your question, i did. CBD has obviously confused CO2 and toe or C when he wrote 2,000 Gt CO2 / 10 Gt/yr = 200 years since we produce around 30 GtCO2 and not 10 (this is the energy consumption). everybody can do mistakes, but it is extraordinary that it requires an explanation PLUS another justification for people claiming I'm not acting like a scientist. Mucounter : there is no mistake, I said 0.5 °C with respect to the the lowest reasonable value expected in 2100, not with respect to now. Please read me more carefully. The problem in saying "the threshold of 2°C is dangerous and we must keep below it" is that even then natural variability of a few tenths of degrees corresponds to dozens of Gt of C, if not hundreds ; so you cannot define with precision the moment when you're supposed to stop. In the Ecofys scenario, they just offer a possible (probably unrealistic) future production, but they are totally silent about how insuring it for sure in the future : who will tell whom that it's enough and that he should stop now using FF ? this is just the product of sim-city formatted brains who believe the world is in their computers (I'm afraid many climate scientists suffer from this disease) . The peak in FF production is always governed by the offer, not the demand. No company stop drilling and extracting oil when the well is drilled, before it is exhausted. The only fact that will limit the extraction (and is acting just now for the oil) , is just that the resource becomes so expensive that the number of customers decreases : you're just seeing it's happening, but you don't seem to understand it. Please, again, come back in the real world. -
Bern at 16:32 PM on 1 April 2011A Plan for 100% Renewable Energy by 2050
If you're doing back-of-the-envelope calculations, don't forget the methane from clathrates & permafrost... from memory, the permafrost component alone is supposed to add another 1,500 Gt of carbon all by itself - but in the form of methane, which is ~77 times worse than CO2 over 20 years, and 25 times worse over a century. Add that to the 2,000 Gt of CO2 from humans, plus methane from clathrates, plus increasing temperatures turning sinks like rainforests & the oceans into net sources (and releasing significant amounts of the previously-absorbed human emissions) and we could be looking at some serious increases in greenhouse forcing. Having just read the last 70-odd posts on this thread, it is clear that Gilles is arguing for continued use of fossil fuels, primarily because we don't currently price the externalities, and as a result it's currently the cheapest source of energy. Spoken like a true economist who doesn't believe global warming poses any threat whatsoever to human civilisation. Actually, I'd go further, to say it sounds more like what you'd hear from an accountant, rather than an economist. Given Gilles' persistence in posting here, and the content of the messages, I feel we're seeing one of two things: a sock-puppet, or someone who really believes what they're posting, a la this XKCD comic. Personally, I hope it's the latter. :-) -
WheelsOC at 15:53 PM on 1 April 2011Crux of a Core, Part 3... Dr. Ole Humlum
Funny how a few visual aids can help put things in perspective. Figure 3 was a nice touch. -
ginckgo at 15:49 PM on 1 April 2011Understanding Solar Evolution Part 2: Planets
Regarding the cap carbonates, there's an article by Greg Retallack (Neoproterozoic loess and limits to snowball Earth), in which he argues that at least the Aussie Nuccaleena Formation is actually a subaerial loess deposit, and therefor nothing to do with the termination of Snowball Earth, and by extension don't support CO2 as a major player in terminating these ice ages. I asked my old Lecturers at Adelaide Uni who worked on these formations for comment, and they were less than complimentary about the science - apparently it had been previously roundly rejected by peer review. So, just in case someone brings this article up to 'debunk' CO2's role, the article is apparently not very solid. -
CBDunkerson at 15:38 PM on 1 April 2011Debunking Climate Myths from Politicians
MidwestHES wrote: "The exact same thing that is happening with the debate on AGCD happened with the debate on the Ozone hole, starting in the early 1970's...The same groups and people that are denying this denied that as well." My favorite example of this is Will Happer's constant complaint that 'Al Gore fired me for disagreeing with him on global warming'.... but if you go back to news articles at the time his claim was, 'Al Gore fired me for disagreeing with him on ozone depletion'. It's not just the same people using the same sort of misinformation campaigns... it's even the same events (if it ever happened at all) retroactively re-written for a new topic. -
Tom Curtis at 15:20 PM on 1 April 2011Crux of a Core, Part 3... Dr. Ole Humlum
I am unsure if this is the best place for this comment. However: One piece of data that Dr Humlum presents is the correlation between global temperatures and the angular velocity of the Earth's rotation (or the inverse of the length of the day). Humlum comments:
"The length of day (LOD) as shown above are subject to variations due to variations in oceanic tides (smaller than 0.03 ms in absolute value), variations in the atmospheric circulation, and to internal effects and to transfer of angular momentum to the Moon orbital motion. Also the dynamical influence of the liquid core of the earth may account for slow variations, but then generally expressed as overall long-term trends (Akoi et al. 1982). The above diagrams show that periods with relatively high planetary rotation velocity (and low LOD) tend to be associated with relatively warm periods, and vice versa. Good examples are the peak of LOD in the early 20th century, concurrent with the last cold spell of The Little Ice Age and the loss of Titanic. Also the cold period 1965-1977 was associated with long day length (high LOD) and low planetary angular velocity. The generally increasing rotation velocity of Earth (and decreasing LOD) since then has taken place along with the period of late 20th century warming. Variations in LOD has also been associated with the Atmospheric Circulation Index (ACI) and variations in commercial catches of different fish species. Some of these associations are thoroughly described and discussed by Klyashtorin and Lyubushin (2007)."
Given the fact that some deniers claim there is a causal connection between the Length of the Day and global temperatures, with changes in the LOD causing changes in global temperatures, it is questionable that there is no discussion of (or mention of) glacial mass balance in the same context. Looking closely at the LOD signal, it is very plain that there is a seasonal signal. The Earth has a longer day (ie, it spins slower) in the Northern Hemisphere winter. The cause of this is easy to attribute - snow. In the NH winter, large areas of the Earth are covered by a thick blanket of snow. The snow is, in the summer, found in the oceans, but in the winter it is found on land, and hence (on average) at several hundred meters greater altitude. Because of conservation of momentum, this shift of mass slows the Earth's spin, and hence lengthens the day. The annual trend in changes of the LOD have similar magnitude to the seasonal variations. (The change in the 37 month mean of the LOD from 1972 to 2009 was approximately 0.003 seconds, while the seasonal variation has a range of about 0.0015 seconds.) It is also not a monotonic trend. Therefore whatever the cause, we do not expect the Earth to shed and regain angular momentum, but rather only to shed and regain angular velocity. This means the cause must involve changes in the relative locations of significant masses. As hinted at above, the larges temperature correlated change in distribution of masses at the Earth's surface is the change in glacial mass balances. As glaciers melt, the melt water finds itself either directly or indirectly in the sea, thus redistributing the mass by up to 10,000 km towards the Earths axis. Because tropical glaciers can be involved in this mass redistribution, the relative size of the effect for a given mass moved should be larger than the seasonal snowfall effect as tropical and subtropical glaciers are further from the Earth's axis of rotation. Following are the changes in mass balance for non-polar glaciers, and for Greenland. Clearly it would be very difficult to predict the change in the LOD from known changes in glacial mass balance, but it appears to me that the pattern in those changes can be seen as a long term trend driven by loss of mountain glaciers, modulated by the changes in Greenland's mass balance. The changes in Greenland's mass balance are, of course larger than the changes in mountain glaciers in absolute terms, but Greenland is much closer to the axis of rotation.

-
Tom Curtis at 14:46 PM on 1 April 2011Crux of a Core, Part 3... Dr. Ole Humlum
Rob Honeycutt @5, I am uncertain about the effects of snowdrifts on GISP2. The reason I object to using GISP2 (or any Greenland ice core) as a global proxy (above and beyond my more general objections against using any local proxy as a global proxy) is that Greenland dO18 is known to be unusually variable because of the North Atlantic Oscillation. In one mode of the NAO, the prevailing winds carry warm air onto Greenland from the Atlantic. In the other mode, it carries cold wind from the arctic. As I understand it, the O18 concentrations in precipitation are a function of the temperature of the water from which the water vapour originally evaporated, and the intervening atmospheric temperatures, and the temperature at the location of precipitation, the upshot is that dO18 gives a record of a regional temperature rather than a site specific temperature. This means that in one mode of the NAO, Greenland ice cores give a record of the temperature across the northern Atlantic and Greenland, while in the other mode, they give a record of temperatures across the Arctic and Greenland. Thus they will exhibit a greater variability than the actual local Greenland temperatures themselves; and a far greater variability than most other local temperature records. -
muoncounter at 13:33 PM on 1 April 2011Sea level rise: coming to a place near you
The mighty Tamino strikes again, with an excellent debunk of a new paper that touts no acceleration in sea level rise. An eye-grabber is this figure: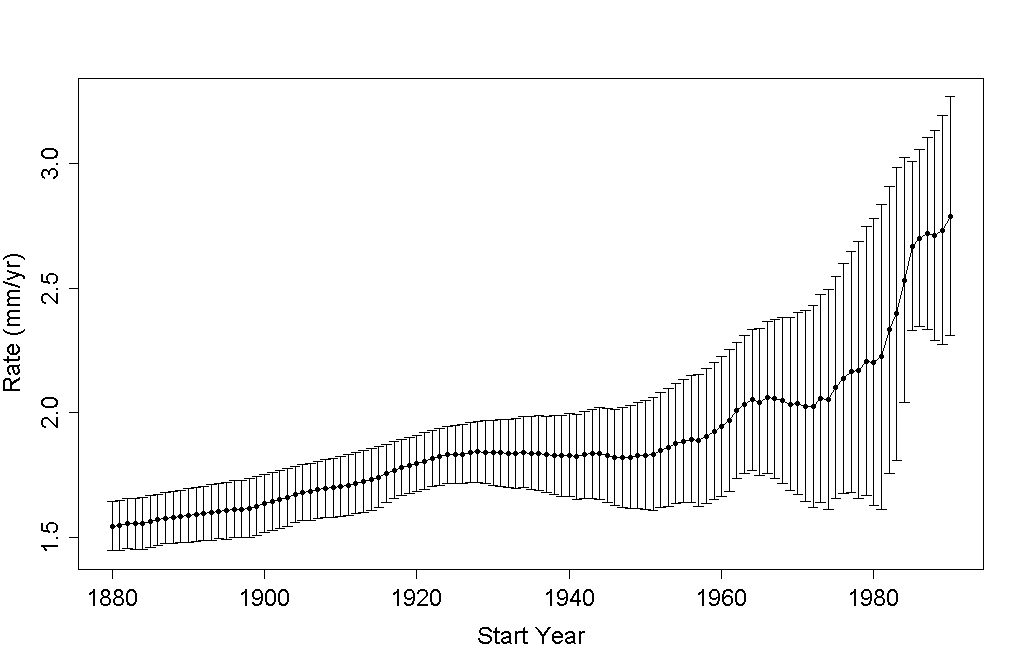 According to this, the recent rate of sea level rise is greater than its average value since 1930. Significantly so (in the statistical sense), even using a conservative estimate of autocorrelation. But the increase itself hasn’t been steady, so the sea level curve hasn’t followed a parabola, most of the increase has been since about 1980.
Once again, a long term uptrend, with a noticeable change in the late 70's-early 80's. The rate of increase increases. Kind of a deja vu all over again.
According to this, the recent rate of sea level rise is greater than its average value since 1930. Significantly so (in the statistical sense), even using a conservative estimate of autocorrelation. But the increase itself hasn’t been steady, so the sea level curve hasn’t followed a parabola, most of the increase has been since about 1980.
Once again, a long term uptrend, with a noticeable change in the late 70's-early 80's. The rate of increase increases. Kind of a deja vu all over again.
-
Marcus at 13:26 PM on 1 April 2011Debunking Climate Myths from Politicians
That's correct SoundOff, that's why there was an Ozone hole over Antarctica. -
Glenn Tamblyn at 13:21 PM on 1 April 2011Temp record is unreliable
garythompson @155 The station list you present looks like it is from a point in the northern Norwegian Sea. Don't forget this map is for land & ocean index, not just land. the predominant data for that region would be ocean SST data. GISTEMP uses ocean data in preference to land data when the land area is very small - look at the Chatham Islands in the South Pacific as a good example of this. Do runs for Land only, Ocean only and Land & Ocean. Look at the tabulated data for each run. The land data isn't used at all in the combined series. Also the use of data out to 1200 km is part of the standard algorithm for GISTEMP. However temps frpm 1200 k's out only have a small weighting at the centre. The basis for this 1200 range is the original research behind GISTEMP showing strong correlation between anomaly changes out to 1200 kms. Currently I am working on a post on another subject. Following that I plan a series of posts on surface temperature measurement that I hope will clarify some of these things. -
SoundOff at 13:09 PM on 1 April 2011Debunking Climate Myths from Politicians
I believe Mr. Sarkozy is technically correct. Greenhouse gases cause stratospheric cooling. A colder stratosphere is more conducive to ozone depletion (which is why we see ozone holes over the poles). The ban on the primary cause of the holes, CFCs, is intended to promote the recovery of the ozone layer. The net effect is probably a longer recovery period. I would agree that ozone depletion is not a first order consequence of greenhouse gas emissions. -
Glenn Tamblyn at 13:07 PM on 1 April 2011Of Satellites and Air – A Primer on Tropospheric temperature measurement by Satellite
Nice graph Daniel. Even shows up the lesser peak from the Agung eruption of 1963/64 Another speculation using that precise scientific instrument, a Mark I eyeball. All three eruptions spike back up to a similar level then drop back down to the old trend. Is that coincidence, a function of the size of the eruptions? Or an underlying property of the impact of any major eruption on the stratosphere?Moderator Response: [DB] Based on my understanding, the graph highlights the transient impact that volcanic eruptions typically have on climate. All bets are off on supervolcanic eruptions, tho. -
scaddenp at 12:24 PM on 1 April 2011Temp record is unreliable
Well a great many people have managed to use this data. eg look at this and you will guides to understanding the odd numbers and how to process if you look. What exactly were you trying to download from CISL? (their data, their rules - oil companies certainly cant download government data here without telling us who they are). While its great that you are looking at the data, you also should satisfy yourself about the methodology. (ie neither GISS, Hadcrut, nor noaa are trying to calculate a global mean temperature and that the anomaly data really is stable and spatially highly correlated). -
muoncounter at 12:06 PM on 1 April 2011Arctic Ice March 2011
johnd#56: "The major factor standing between the incoming solar radiation and the ice will be clouds," Indeed. From Kay 2007: Reduced cloudiness and enhanced downwelling radiation are associated with the unprecedented 2007 Arctic sea ice loss. Over the Western Arctic Ocean, total summertime cloud cover estimated from spaceborne radar and lidar data decreased by 16% from 2006 to 2007. The clearer skies led to downwelling shortwave (longwave) radiative fluxes increases of +32 W/m2 (-4 W/m2) from 2006 to 2007 ... ... we suggest that in a warmer Arctic with thinner ice, cloud and shortwave radiation anomalies will play an increasingly important role in modulating summertime sea ice extent. So a warmer Arctic summer has decreasing cloud cover, leading to more energy input to the surface. Better hope those Spencer magic clouds are coming to the rescue soon. -
muoncounter at 11:41 AM on 1 April 2011Temp record is unreliable
cloa "The US Government site provides no data or garbage numbers" What are you talking about? Data downloadable for free here, zipped here and graphics here. "its all our tax dollars." Ah ha: 'I can't find what I'm looking for, so they're wasting our tax dollars.' Anyone for tea? -
cloa513 at 11:06 AM on 1 April 2011Temp record is unreliable
I looked at the links through RealClimate.org The US Government site provides no data or garbage numbers like 4000 lots of -1936. Someone should complain about their garbage. Some useful data in the rest. CISL- its none of your business or your parent organisation- who I am nor should you restrict data access in any way. Needing the request data is a scientific disgrace- its all our tax dollars. -
Stephen Baines at 11:05 AM on 1 April 2011Acidification: Oceans past, present & yet to come
@Agnostic...The Southern Ocean is Fe limited because it gets most of it's nutrients from upwelling of very old deep water. Fe is not very soluble in the ocean under current pHs - it tends to complex with particles and gets removed to sediments over time. As deep water ages, Fe is slowly stripped from water by this process. When it rises to the surface there is consequently a definict of Fe rlative to nitrate, phosphate and silicate. The Fe gets used up by algae before the other nutrients, leading to Fe limitation and what are called High Nutrient Low chlorophyll (HNLC) conditions. In other regions that receive river water, release of Fe from sediments or dust, Fe is not so limiting and thos conditions don't ocur. I think that general picture is unlikely to change until pH drops quite a bit, and then it could take quite a while for any effect to be observed as you'd have to see that pH change at depth and aloow time for the slow processes I referred to respond. I know someone has recently done a calculation on the effect of pH on Fe availability. I'll see if I can find it. I'm sure it comes with a lot of caveats. -
muoncounter at 10:48 AM on 1 April 2011A Plan for 100% Renewable Energy by 2050
Gilles#129 "giving 2 000 Gt of CO2" Excellent. The same Gilles who scoffed at 650ppm under an IEA oil forecast now reveals back-of-the-envelope numbers that take us well past even that horrifying level. But no worries, Gilles says it's OK because he can twist a near-doubling of CO2 (from pre-industrial) into only another 0.5C. We've already seen +0.5C just since 1970, when CO2 was 325ppm; now its 390, a 20% increase. Gilles predicts: going to 540ppm, another 40% higher than today will result in just another 0.5C. Anyone (except Gilles) can see that's fuzzy math. This is from the same Gilles who believes that doubling the energy consumption of the planet won't be a problem. Anybody feel all better now? -
scaddenp at 10:41 AM on 1 April 2011Temp record is unreliable
I think there may be some confusion about what links are being referred to. Not the data links to chris shaker. To cloa513, moderator pointed to useful links in response to post here I pointed to other useful data (eg Hansen agreeing that mean global temperature isnt useful so dont us it) and actual methodology in posts 143 and 144. Both work. In essence, the arguments about mean global temperature are a strawman. The arguments against it are quite valid but the methodology being rebutted is not the methodology used for examining global temperature trends. The actual methodology (average anomaly) is pointed to by link and the papers that support it reveal decades of testing of the method validity. What cloa513 hasnt done is presented a contrary argument against this. Cloa513 - a debate of substance would include a statement about what you thought was excuses and particularly why you thought it was lame. The question really at hand is whether the globe is warming or not. You seem to contending that we dont know about method is flawed (but you havent examined the real method) plus some speculative FUD. You are also noting that other evidence of warming is provided by satellites tropospheric measurement (which is independent of ground measurement), sealevel rise and glacial retreat. If you are of one opinion now, you need to ask yourself what data would make you change you mind. -
adelady at 10:35 AM on 1 April 2011Debunking Climate Myths from Politicians
chrisd@27 I'm starting to think there might be a business opportunity - skincare for climate bloggers. With all the face-palming, head-desking and jaw-dropping, a soothing concoction to take away redness and soften callouses should be a runaway success.Response: [John] Well, 4 years of climate blogging have ravaged my once youthful good looks so you might have stumbled upon a lucrative niche industry there!
Prev 1795 1796 1797 1798 1799 1800 1801 1802 1803 1804 1805 1806 1807 1808 1809 1810 Next


