


 Arguments


Recent Comments
Prev 1803 1804 1805 1806 1807 1808 1809 1810 1811 1812 1813 1814 1815 1816 1817 1818 Next
Comments 90501 to 90550:
-
wingding at 21:18 PM on 29 March 2011The Day After McLean
Anyone remember David Archibald's prediction for May 2009? Similarly absurd.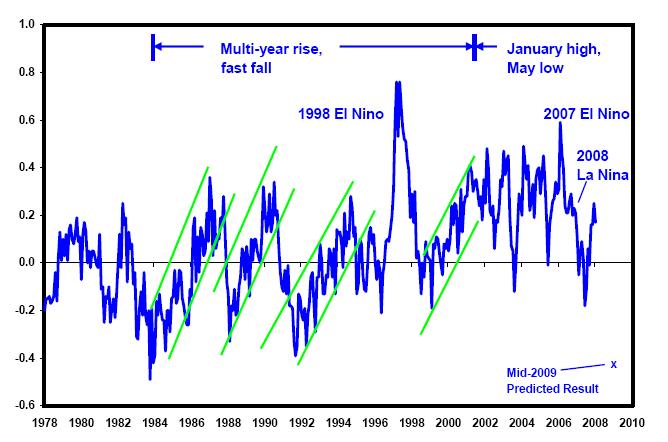
-
Glenn Tamblyn at 19:14 PM on 29 March 2011The Day After McLean
Susanne @33 The terminolgy used for the temperature products is rather abritrary and historical. I have a discussion of Satellite Temperatures here http://www.skepticalscience.com/Primer-Tropospheric-temperature-measurement-Satellite.html -
Glenn Tamblyn at 19:11 PM on 29 March 2011The Day After McLean
Alexandre @10 "To boldly predict what no man has predicted before... " Ahhh...I Love the Smell of Split-Infinitives ine the morning! -
shoyemore at 18:38 PM on 29 March 2011Muller Misinformation #1: confusing Mike's trick with hide the decline
J. Bowers #22, I read your post just as I was putting Christopher M. Bishop's tome Pattern Recognition and Machine Learning (Springer, 2006) into my briefcase. In the index under "k" is kernel trick, 292. The page elaborates "The concept of a kernel formulated as an inner product in a feature space allows us to build extensions of many well known algorithms by making use of the kernel trick, also known as kernel substitution." Bishop is an employee of Microsoft, and I am sure no one is going to accuse him (or anyone who uses the kernel trick) of scientific skulduggery. -
shoyemore at 18:28 PM on 29 March 2011Muller Misinformation #1: confusing Mike's trick with hide the decline
adelady, #6, Different strokes, I guess. I just refer people to Skeptical Science whenever this comes up!! -
J Bowers at 18:28 PM on 29 March 2011Muller Misinformation #1: confusing Mike's trick with hide the decline
There are other examples of the term "trick" being used in the emails, which denialists oh so conveniently ignore even when, as they themselves say, they have read the emails in their entirety. This one explains quite clearly what a trick is... #1200162026 “I would note that the distribution of rejection rates is like the distribution of precipitation in that it is bounded by zero. A quick-and-dirty way to explore this possibility using a “trick” used with precipitation data is to apply a square root transformation to the rejection rates, average these, then reverse transform the average. The square root transformation should yield data that is more nearly Gaussian than the untransformed data.” Perhaps Dr Muller would like to accuse the sender of that email of something ansty. -
damorbel at 17:50 PM on 29 March 20112nd law of thermodynamics contradicts greenhouse theory
Re #874Tom Curtis you wrote:- "1) Surely you mean that Heat is what is measured by temperature multiplied by heat capacity" That would be energy - Joules. Heat capacity is 'C' (Cp; Cv) which is in Joules/Kelvin (J/K) The 2nd law requires for equilibrium, that T is uniform, i.e. no temperature diffences, no teperature gradients. Further you wrote:- "I think the revisionist physicists who want to outlaw the use of "heat" to describe internal energy are merely sowing confusion for themselves and their students." I have noticed this too but it isn't consistent. Since heat is only a function of temperature, it is only a function of molecular motion, the harder they vibrate the hotter things are! The devil in the matter seems to be latent heat which really is a misnomer. Let us take ice; when ice is formed the operative change is the loss of vibrational energy as the molecules line up to form crystals. Crystals have energy stored in the the lattice bonds. This is of course is 'energy in Joules' but it does not affect the temperature as ice forms/melts so it is not really heat but it is part of the internal energy of a water/ice thermal system. I suspect you knew all of this before reading it here. But there seem to be a number of contributors who need reminding! You wrote:- " Any back radiation that is reflected from the surface is simply part of the Surface Radiation." In kinetic theory molecules exchange energy by collision, thus on any (imaginary) surface introduced in a volume of gas the molecules on either side of this imaginary surface exchange energy (momentum, really), (T>0) all the time; so, if you were being pedantic, you could describe this energy exchange as 'forward' energy and 'back' energy and it is going on all the time, at every imaginable 'surface' in the volume. Energy exchange by radiation is not much different, but in this case the collisions are replaced by the emission and absorption of photons. Just like kinetic theory where the 'collisions' are between adjacent molecules. This is where the concept of 'back radiation' fails because it relies on radiation acting over large distances whereas it is actually very local, just the same as kinetic energy exchange. I have referred to this in previous posts, at the time I mentioned Einstein's paper 'Strahlungs-Emission und Absorption nach der Quantentheorie (german 1916) It is available on line in english and it is fairly easy to read and it firmly disposes of the idea that radiating gases can make any difference to the distribution of energy in a gas. -
shoyemore at 17:30 PM on 29 March 2011Muller Misinformation #1: confusing Mike's trick with hide the decline
Dana1981, #3 I have watched Muller in action twice on video, and both times found myself fuming at his misinformation and calumnies against other scientists. I also noted his obvious ego-driven presentation and love of the spotlight. Here is someone who not only wants to undermine Jim Hansen, he wants to BE Jim Hansen or be the new Hansen figure. On the credit side, Muller correctly identifies anthropogenic climate change as a major threat. But the way he uses his scientific disagreements as cloaks for personal attacks is unacceptable. He certainly deserves refutation on his many "errors" (deliberate or otherwise), more so than Monckton. I would just not have started with this point! I think the Mann-Jones issue has been thrashed to death and few people will be swayed either way by coverage of old ground. -
Gilles at 17:13 PM on 29 March 2011Muller Misinformation #1: confusing Mike's trick with hide the decline
sorry but (again), something is still unclear for me : what is the calibration period and what is the validation period of Briffa's dendro series ? -
Gilles at 16:59 PM on 29 March 2011A Plan for 100% Renewable Energy by 2050
scaddendp : what's your guess for the average slope of the temperature increase in the 4 next decades? I you predict an acceleration, It would be interesting to see how soon it will be measurable. Mucounter 118 : what is classic is your continuous misreading of what I'm saying. First I didn't care about the website hosting this graph, I know it perfectly well and I already commented it a number of times since it appeared in fall 2010 in WEO 2010. I just was too lazy to find if it were published on line on the IEA site on a html page instead of the pdf I gave you in link - so I just googled "iea oil production WEO 2010" and I took the first occurence I found (the fact that guys like you are not aware of this kind of predictions is for me totally indicative of the total unawareness of the real problems of the coming decades, BTW). You say it is only a "very limited attempt to reduce CO2 emissions". Thank you, I can read numbers. I know that. It wasn't my question. My question was : why does the IEA think oil is "needed", even the poor 20 Mb/d "yet to be found" if it is so easy to suppress it ? I hope you don't think this graph has been obtained simply by adding commitments of all countries US+SFU+China+france+ Etc... No country can know exactly what its growth and energy consumption will be in 2030, and if you consider all the oil excluding NGL and unconventional, you can notice it is strictly flat. I hope you will agree that the likelihood that the sum of all commitments of all countries in the world is strictly flat for 30 years is extremely tiny. So is the likelihood that we would find exactly this amount. Obviously IEA has no way to know exactly how much oil will be found in yet unknown fields. So think a little bit more about all this : on which basis can IEA produce such a graph ? any idea? may be les, who understands perfectly "how the world works" , could help you ? -
Glenn Tamblyn at 16:40 PM on 29 March 2011Of Satellites and Air – A Primer on Tropospheric temperature measurement by Satellite
BP Although the lower Stratosphere hasn't colled much lately, the fact remains that it has cooled since start of the satellite record. ince each reading from a satellite is based on the current temperature profile through the air column. Since the temps are all anomalies relative to a baseline period, the stratosphere doesn't have to keep cooling to impact what the tropospheric reading from T2 appears to be. Earlier in the history it will have had a growing bias. If its cooling has stabilised, the bias it contributes isn't growing, but there is still a fixed bias from the amount of cooling that has occurred. The important point about how the various compensation schemes for Stratospheric cool bias compensation work is that they are applied at the individual sample level, not at the high order trend level. Each reading has the compensation applied then trends are calculated from it. If the bias isn't changing at present then new samples will still have the same bias removed. Interesting from the records - Eruptions don't show up much at all in the lower trop' series but hugely in the strat'. El Nino is the opposite, largely lower trop' based. -
robert way at 16:23 PM on 29 March 2011Muller Misinformation #1: confusing Mike's trick with hide the decline
For you Charlie A, More support for my interpretation from Briffa 2001 “Bias might be introduced in cases where the spatial coverage is not uniform (e.g., of the 24 original chronologies with data back to 1500, half are concentrated in eastern Siberia) but this can be reduced by prior averaging of the chronologies into regional series (as was done in the previous section)… Eight different methods have been used… They produce very similar results for the post-1700 period… They exhibit fairly dramatic differences, however, in the magnitude of multidecadal variability prior to 1700… highlighting the sensitivity of the reconstruction to the methodology used, once the number of regions with data, and the reliability of each regional reconstruction, begin to decrease. The selection of a single reconstruction of the ALL temperature series is clearly somewhat arbitrary… The method that produces the best fit in the calibration period is principal component regression… “…we note that the 1450s were much cooler in all of the other (i.e., not PCA regression) methods of producing this curve…” -
dana1981 at 16:04 PM on 29 March 2011A Plan for 100% Energy from Wind, Water, and Solar by 2050
Sean A #48 - we try to refrain from calling people "deniers" on this site, especially when they aren't denying anything. I've merely discussed a study (two now, actually) which puts forth a plan to transition away from fossil fuels to renewable energy without using nuclear. Now, you may have your doubts about these plans, and that's fine. But there's no need to be rude about it. I specifically outlined 7 ways in which the intermittency of some renewables can be addressed. Solar thermal can easily store energy, geothermal and hydroelectric can be used to fill in the gaps when wind or solar production are low. It seems like a perfectly plausible plan to me. I often find that people who are pro-nuclear are often unwilling to consider other alternatives, and that really puzzles me. There are a lot of good reasons not to want to rely on nuclear power, so if we don't have to, I don't see why we wouldn't explore other options. -
dana1981 at 15:57 PM on 29 March 2011Muller Misinformation #1: confusing Mike's trick with hide the decline
Charlie A #16 - please take a look at the site Comments Policy, particularly the very first policy - no accusations of deception. This is actually my biggest beef with McIntyre and co. If you want to know why Briffa made a certain decision, why not try, hmm, I dunno, asking Briffa? Instead of immediately leaping to the conclusion that he's "hiding" something, or only showing data when it comes out "as desired". Personally I find that when people assume others are dishonest, they're projecting their own behavior. -
robert way at 15:53 PM on 29 March 2011Muller Misinformation #1: confusing Mike's trick with hide the decline
garythompson at 14:52 PM on 29 March, 2011 This is the spatial distribution of proxies from the CA stuff pre-1500 http://www.skepticalscience.com/pics/Sites.png If you call that an adequate spatial distribution then you are fooling yourself. 87% of pre-1500s data comes from 2/5 regions from the study. It is obvious to those who pay attention that this is a good reason to consider that the reconstruction pre-1500 does not accurately represent the entire region. Furthermore, show me the 8 station to which you refer? I can count more than 8 on greenland alone so tell me where you get these numbers? Actually you're also wrong on the 1500 km part, it is 1200 km not 1500 so get your facts straight. Also consider that stations at high latitudes are highly correlated (0.5) at 1200 km as presented by Hansen and Lebedeff (1987). Finally, the assessment presented by GISS is supported by NCEP Reanalysis, and ECMWF reanalysis datasets which include satellite, weather balloon and station data. NCEP in fact shows greater warming than GISS (supplemented by Environment Canada stations) as shown in my previous post. http://www.skepticalscience.com/pics/ArcticTC1880-2010NCEP.png Your argument is just wrong. Sorry. -
Bern at 15:47 PM on 29 March 2011A Plan for 100% Energy from Wind, Water, and Solar by 2050
johnd: regarding your comments on variability of supply & demand - note that there has been decades of effort put in to "levelling" the demand curve. This is due to the increased efficiency of running coal-fired plants at constant load, not because of any insurmountable difficulty in matching supply & demand. One of the biggest impacts of that we see locally (at least in Queensland), is that it is illegal to connect electric water heaters to normal supply - they *must* be connected to a different, controlled supply, where the electricity network managers can turn them on & off remotely to shape the demand curve. This mostly results in them running at night, to boost minimum demand. It has the side effect that they also draw power when prices are lowest, so a lower tariff is charged. Even with efforts like this, however, there is still a 40% drop in demand for electricity at night. Take the demand-levelling out of the equation, and you'd find that the demand curve would peak higher during the day, and plummet much lower at night. Hmm, that sounds like a ripe candidate for solar generation with storage... Ken Lambert: If you read the Part II paper linked in the article, you'll find a lot of information on costs. Basically, most renewables are expected to be competitive with coal (and cheaper than gas) within ~10 years or so. Some are competitive now. If you factor in the costs of destabilising the world's climate, then fossil fuels are more expensive now than nearly every alternative out there. The number quoted in the paper (about 14c/kWh, although it might be double that or more) equates to a carbon price of at least $150/tCO2, I think (not 100% certain how the numbers convert). To put that in perspective, electricity prices here have increased ~8c/kWh over the past 8 years, when there has been no carbon pricing whatsoever. That's all to pay for transmission network upgrades, and the cost is borne entirely by the consumers, while the wholesale price of generation has remained fairly static. When you include carbon pricing at $150/tCO2, then solar PV is cheaper than coal right now. Given that it's projected to be cheaper than coal *without* carbon pricing by 2020, you'd have to be a mug to think a coal-fired plant is a good investment. Either that, or have a lot of friends in government who can keep up a supply of tax breaks, subsidies, and barriers to entry to keep other players out of 'your' market. Oddly enough, we have just those kinds of barriers here in Australia. Transmission network improvements required to bring online a new generator (e.g. a windfarm or solar plant) must be 100% paid for by the wholesale price of electricity from that generator, despite all the existing generators (nearly all coal-fired) having been permitted to spread their network costs across the entire network (when it was all government owned - the privatised generators now don't have to pay for the network costs at all). -
Charlie A at 15:43 PM on 29 March 2011Muller Misinformation #1: confusing Mike's trick with hide the decline
#14 Robert Way says @13:48 29 March "What they don't tell you is that going back to 1400 there are only 8 proxies so they do not include the data past 1550 because of the substantial reduction in the number of proxies" So why two years later in 2001 does Briffa choose to show a similar reconstruction extending back to 1400, with only 2 (TWO!) sites in 1402, 8 sites in 1500 and 19 sites in 1550? Perhaps because this reconstruction came out as desired?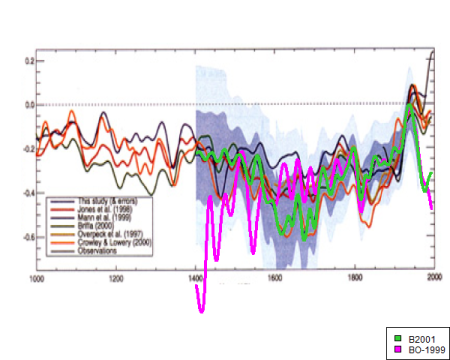 Figure 2. From Briffa et al 2001 (JGR) Plate 3, also showing the pre-deletion data used in Briffa-Osborn 1999 (magenta). The Briffa 2001 version ends in 1960 and has been extended using data from Climategate emails (showing the decline).
ref: HIde the Decline, the Other Deletion
Figure 2. From Briffa et al 2001 (JGR) Plate 3, also showing the pre-deletion data used in Briffa-Osborn 1999 (magenta). The Briffa 2001 version ends in 1960 and has been extended using data from Climategate emails (showing the decline).
ref: HIde the Decline, the Other Deletion
-
Bern at 14:57 PM on 29 March 2011A Plan for 100% Energy from Wind, Water, and Solar by 2050
Sean A: if you think that nuclear is going to stand up & be counted in the current political environment in most western countries, then you're sadly mistaken. If I recall correctly, the major reason that Hansen & Lovelock thought nuclear should be part of the mix is that there were no other sources of large-scale baseload power that they could see in the short term, both of them being convinced that we need to stop burning fossil fuels yesterday. Personally, I think that Gen IV reactors (like the IFR - Integral Fast Reactor, the LFTR - Liquid Fluoride Thorium Reactor, and others) have the potential to supply enormous amounts of carbon-free electricity with very low risk (and certainly lower environmental & health impacts than coal!). But you need to convince a few hundred million others of that, and, as the latest election results from Germany show, the emotive anti-nuclear argument is winning the day right now, by a clear majority. Unless & until more dispassionate analysis by the voting public of the events at Fukushima Daiichi occurs, it's extremely unlikely that new nuclear plants will even be on the table for discussion, let alone actually built. Given the propensity of the mass media for hyping the doomsday scenarios that might eventuate, then dropping the story altogether when things get "boring" (i.e. not at all apocalyptic), I'm not holding my breath for that. So, given the #1 priority is to get rid of fossil fuels, then we need to put serious effort into other renewables for a while. The progress I've seen over the past 5 years or so is pretty encouraging, I have to say, and with a bit more effort, we'll see where things go. Given the combination of high technological capability & large "Greens" political influence, I'm expecting some exciting developments to come out of Germany over the next few years (fingers crossed!). -
garythompson at 14:52 PM on 29 March 2011Muller Misinformation #1: confusing Mike's trick with hide the decline
If the proxy data didn't correlate with temperature data after 1960, then why did Briffa make the claim that the tree proxy data was in error without looking at a possible error in the instrument data? From the paper here there were many theories floated as to why the tree ring data diverges after 1960 but many of them point to a drought condition. Other suggestions include global dimming, polution, strataspheric ozone levels, insect infestation, etc. While all of these might be real, that is a fairly complex set of conditions that must come together to cause this error and surely another obvious answer could come from the temperature measurements. Maybe this was thouroughly investigated and shown not to be a cause in a paper and if someone has a link to that I'd appreciate you sharing it. This graph from that paper also highlights the divergence over the last couple of decades. And correct me if I'm wrong but over the past couple of decades we've seen a large drop out of the number of weather stations, especially in the northern latitudes where the tree ring data diverges. Could this be another possible explanation? How close were the temperature stations to the tree ring samples? Were they at similar elevations and does that matter?
#14 Robert Way - If 8 data points aren't sufficient to justify a large enough sample size why is it ok to have 8 data points (i.e. temperature stations) to represent a global region composed of a circle with a 1,500 km radius (which is what the GISS data does for the north pole area)? If you look at the dark red area on the picture below and then go click on the center of that region on the GISS site you'll only find 8 sites that have continuous measurements over the past several decades.
And correct me if I'm wrong but over the past couple of decades we've seen a large drop out of the number of weather stations, especially in the northern latitudes where the tree ring data diverges. Could this be another possible explanation? How close were the temperature stations to the tree ring samples? Were they at similar elevations and does that matter?
#14 Robert Way - If 8 data points aren't sufficient to justify a large enough sample size why is it ok to have 8 data points (i.e. temperature stations) to represent a global region composed of a circle with a 1,500 km radius (which is what the GISS data does for the north pole area)? If you look at the dark red area on the picture below and then go click on the center of that region on the GISS site you'll only find 8 sites that have continuous measurements over the past several decades.
 Moderator Response: If you want to discuss the reliability of the temperature record, please take your discussion to the temperature record thread.
 -
Tom Curtis at 14:08 PM on 29 March 20112nd law of thermodynamics contradicts greenhouse theory
damorbel @872: 1) Surely you mean that Heat is what is measured by temperature multiplied by heat capacity. "Heat capacity"? How about that. It appears to be implicit to the language of physics (as it has always been to natural languages) that heat is something that can be stored. I think the revisionist physicists who want to outlaw the use of "heat" to describe internal energy are merely sowing confusion for themselves and their students. 2) Any back radiation that is reflected from the surface is simply part of the Surface Radiation. This is because, fairly obviously, IR detectors cannot distinguish between IR radiation emitted and reflected at the same frequency. The amount reflected is, of course, very small, and probably not large enough to include even if you designed instruments that could reliably distinguish it. Therefore there is no problem in treating emitted surface radiation plus reflected back radiation as a single bulk quantity. In this case you are scoffing at ant hills while swallowing mountains of denier nonsense. -
Sean A at 14:02 PM on 29 March 2011A Plan for 100% Energy from Wind, Water, and Solar by 2050
Who's in denial now? Ignoring a major source of sustainable energy would be inadvisable. Any plan for 100% carbon-free energy that excludes nuclear is hopelessly unrealistic. 50% of our energy from wind? You gotta be pulling my leg. Biofuels? There's no future for biofuels, we need arable land to grow food. There's going to be 10 billion people on the planet soon. Go ahead and get all of the nuclear angst out of your systems now. But make it quick, because we're running out of time. Forward-looking thinkers have already come to the conclusion that we have no choice but to develop nuclear (and renewables) if we want to stop burning coal. Lovelock and Hansen, among others. If you look at the numbers, for renewables only, the numbers don't add up. withouthotair.com Generation IV - Use stockpiles of nuclear waste for fuel. No further mining needed. - Passively safe. - Proliferation resistant. - Some designs, such as the IFR, are not new technology. We can start building these plants now. Renewables and nuclear = climate and energy problems solved. Renewables without nuclear = we have to build more coal plants. Bad outcome. -
robert way at 13:48 PM on 29 March 2011Muller Misinformation #1: confusing Mike's trick with hide the decline
Charlie A at 10:26 AM on 29 March, 2011 "3. Deleting the pre-1550 data in Briffa and Osborne 1999 article in Science and other peer reviewed articles." I don't think going to climate audit will give you the best opinion on this subject. They seem to believe that not showing data where the sample density is too low and the spatial distribution is low equates to a "trick". What they don't tell you is that going back to 1400 there are only 8 proxies so they do not include the data past 1550 because of the substantial reduction in the number of proxies. An example I can point to is here: http://treesfortheforest.files.wordpress.com/2010/05/ghcn_global_temp_area_1961-1990_5x51.png Are scientists "hiding the decline" by not using data going past 1880s in global temperature records? Of course not, the distribution is not accurate. Using less data=noisier data and the authors chose to show when they had confidence in their datasets. No story here. -
arch stanton at 13:28 PM on 29 March 2011Muller Misinformation #1: confusing Mike's trick with hide the decline
Dana (10) I hope he does also. Keep up the good work. -
Bern at 13:17 PM on 29 March 2011The Day After McLean
That link johnd provided above for JAMSTEC was interesting, particularly this part of their forecast: "Southeastern China, southwestern Japan, US and Europe would have warm and dry condition during boreal spring-summer seasons." Following on from the very heavy snowstorms during late winter, warm conditions means there is likely to be significant flooding in the US this spring/summer as the snowpack melts (as per the NOAA assessment). The other question is: how warm is warm? Are we talking heatwave warm? It would be somewhat ironic if the continental US experienced record-setting warm temperatures during one of the cooler years of the last decade, given the focus by some on cooler CONUS temps during one of the hottest years ever recorded last year. -
getricks at 13:00 PM on 29 March 2011Muller Misinformation #1: confusing Mike's trick with hide the decline
This is exactly the kind of information a non scientific person like myself needs to see to de-jigsaw puzzle the stuff that makes me so suspicious. Thank-you. Why was muller [--snip--] things.? To increase potency of his skeptical argument it would seem. That is the ongoing problem for us average Joes. Too many [--snip--] written in scientific language.(thinking non scientific folk are too stupid perhaps) And I hope Muller knows he is being held accountable for what he says as should all in this debate. I hope you realize just how important your site is.Thanks again. -
muoncounter at 12:48 PM on 29 March 2011A Plan for 100% Renewable Energy by 2050
Gilles#116: "I just wanted to notice that they consider that oil is needed - notwithstanding the well known fact that we could so easily replace it," Classic. You posted a graph (which you didn't cite until 9 comments later - perhaps because you clipped the graph from 'Republicans for Environmental Protection,' whatever that is), without explanatory reference to the report to which the graph belongs. You interpret the graph's 'oil to be found' to suit your biased needs. And reach a completely incorrect conclusion. Here's the actual source document for the graph, which is indeed part of the IEA World Energy Outlook for 2010. Let's do what you conspicuously did not: Define the 'New Policy Scenario,' which you see as a statement that these 'clowns' consider that 'oil is needed.' From the factsheet: In the New Policies Scenario ... world primary energy demand increases by 36% between 2008 and 2035, or 1.2% per year on average. This compares with 2% per year over the previous 27-year period. The scenario assumes cautious implementation of the policy commitments and plans announced by countries around the world, including the national pledges to reduce greenhouse-gas emissions and plans to phase out fossil-fuel subsidies. So this is really a very limited attempt to reduce CO2 emissions; it is, by design, not a radical shift away from oil consumption. Later in the document, the New Policy Scenario is compared to the commitments of Copenhagen: Were those commitments to be implemented in a cautious manner, as assumed in the New Policies Scenario, rising demand for fossil fuels would continue to drive up energy‑related CO2 emissions, making it all but impossible to achieve the 2°C goal. ... Emissions jump to over 35 Gigatonne (Gt) in 2035 — 21% up on the 2008 level of 29Gt. Non‑OECD countries account for all of the increase; OECD emissions peak before 2015 and then begin to fall. These trends are in line with stabilising the concentration of greenhouse gases (GHG) at over 650 parts per million (ppm) of CO2‑equivalent, resulting in a likely temperature rise of more than 3.5°C in the long term. --emphasis added So: The IEA doesn't consider that oil is needed, as you claim. They show a scenario of baby steps, in which oil use increases and we arrive at 650ppm and the high side of +3.5C. That's not a good outcome. Really, Gilles, you've got to try harder. You've not yet shown that you have any inclination to do that; but at the very least, find out what you're talking about before forming an opinion. -
2nd law of thermodynamics contradicts greenhouse theory
Fred, The back-radiation in Trenberth's original diagram illustrates the gross flow of energy from atmosphere to surface. If you want to see the net energy flow (heat transfer), just subtract it from the gross flow of energy from surface to atmosphere: 356 - 333 = 23 W/m^2 net radiative energy transfer from surface to atmosphere. Where exactly do you see a violation of the 2nd law? Oh and the "correct" version you cited is derived by doing this exact type of math on Trenberth's results. It is the same information, not a corrected version. All they did was sum the gross inputs/outputs into the atmosphere. Also don't forget that Trenberth's diagram documents measured values, it is not a theoretical whimsy. If you doubt that back-radiation exists, go buy an infrared thermometer, point it at space on a clear night, and prove your point. -
dhogaza at 12:14 PM on 29 March 2011Muller Misinformation #1: confusing Mike's trick with hide the decline
Charlie A:An example of item #3 is the annotated version of Briffa and Osborne Figure 1 from Science 1999 article.
Let me see if if I get this right: they discard proxy data that doesn't calibrate with the modern temperature record and proxy data that doesn't calibrate with proxy data pre-1550. This seems like the right thing to do, indeed. D'oh. -
dana1981 at 12:06 PM on 29 March 2011The Day After McLean
Susanne - it is temperature of the lower troposphere -
dana1981 at 12:04 PM on 29 March 2011Muller Misinformation #1: confusing Mike's trick with hide the decline
Arch - thanks, but we'd prefer if Muller began examining the facts more carefully, particularly when speaking to Congress. This is meant as motivation for Muller to start being more careful and accurate with his statements. -
arch stanton at 11:48 AM on 29 March 2011Muller Misinformation #1: confusing Mike's trick with hide the decline
John, Dana, Thank you very much for your hard work in the area of separating the truth from….other. It would appear to me that this (Muller Misinformation #1: confusing Mike's trick with hide the decline) is an ongoing series concerning Muller’s upcoming anticipated presentation before congress. I humbly suggest that you hold off on critiquing him until after he has exposed himself to congress. Don’t help him polish his presentation or find new ways to deceitfully misrepresent the science. Suggestion for the next person who watches the Berkeley video: Count the times Muller says he thinks climate change is a problem (I don’t want to watch it again). Thanks again, arch -
Berényi Péter at 11:37 AM on 29 March 2011Of Satellites and Air – A Primer on Tropospheric temperature measurement by Satellite
Re: Moderator Response:Nice omission, ignoring the effect of two major volcanic eruptions.[DB] Nice cherry-pick & ignoring the rest of the picture for the TLS
 If lower stratospheric temperature anomaly is put against atmospheric CO2 concentration, regime changes due to eruptions can even more clearly be seen. And of course, that carbon dioxide itself has no effect on it at all.
 There is apparently a strong short time warming effect in the stratosphere from volcanic eruptions followed by a mild cooling with a much longer relaxation time, possibly due to nanoparticles, which have extended stratospheric lifetime (because there's no rain there to wash them out).
Moderator Response:
There is apparently a strong short time warming effect in the stratosphere from volcanic eruptions followed by a mild cooling with a much longer relaxation time, possibly due to nanoparticles, which have extended stratospheric lifetime (because there's no rain there to wash them out).
Moderator Response:[DB] Perhaps you missed reading the entire unadulterated graphic straight from RSS, so here's the unvarnished piece in question, again:

FYI: The spiky bits were the eruptions in question. For those not in full possession of the straight information, volcanoes exert their transient cooling effects in the lower troposphere in opposite fashion in the stratosphere: temporarily warming it.
Due to the paucity (love that word) of water vapor in the stratosphere, the radiative imbalance of the Earth allows CO2 to freely exert it's GHG effects by cooling the stratosphere. As the clear RSS graphic I have shown twice now starkly delineates, the long-term stratospheric temperature trend is down, while the level of CO2 in our atmosphere is up, driving up the temperature of the lower troposphere and our oceans with it. A change in conditions for which mankind is responsible. No matter the dissembling of some.
-
arch stanton at 11:13 AM on 29 March 2011Muller Misinformation #1: confusing Mike's trick with hide the decline
Besides playing fast and loose with the facts, Muller’s presentation utilizes the Wattsoid technique of carefully crafting straw men from the worst of the MSM. -
chrisd3 at 11:02 AM on 29 March 2011Muller Misinformation #1: confusing Mike's trick with hide the decline
Unfortunately for the [--snip--], even Muller's own BEST study appears poised to confirm everyone else's temperature reconstructions:Their preliminary results sit right within the results of NOAA, NASA, and HadCRU, confirming that prior analyses were correct in every way that matters. Their results confirm the reality of global warming and support in all essential respects the historical temperature analyses of the NOAA, NASA, and HadCRU.
Kind of moots the whole hide the decline non-issue. http://climateprogress.org/2011/03/20/berkeley-temperature-study-results-global-warming/ -
adelady at 10:49 AM on 29 March 2011Zero Carbon Australia: We can do it
KeninOz@113. You must have a fly on the wall reporting to you from my household. We recently had a discussion about aluminium. If I had a smelter in Oz I'd be drawing lines on a map to see how easy it would be to connect to the geothermal projects. Getting in first with some investment tied to a guaranteed future supply with some price guarantees sounds like a very good idea. A bit of extra cash flow from claiming a share of the income from the power delivered to others from the lines installed to connect to the plant would be pretty tasty, too. But that's just me. -
Susanne at 10:41 AM on 29 March 2011The Day After McLean
Apologies if this is answered somewhere, but what is TLT (response to comment #5)? Lower Troposphere Temperature seems most likely on the face of it, but why isn't that LTT? ThanksModerator Response: [muoncounter] See UAH satellite temperatures at wikipedia for additional explanation of these terms. -
scaddenp at 10:31 AM on 29 March 2011A Plan for 100% Renewable Energy by 2050
Cant help noticing Gilles claims that SRES scenarios make no account of resource restriction, seem somewhat at odds with SRES itself. However, leaving that aside, suppose we drop all oil use now, dont replace oil with coal-created electric, so we only use half the coal by 2100, what the guess on CO2 ppm by 2050? Gilles doesnt believe in models so I doubt he cares, but frankly I still dont want to go there in less than 40 years. -
adelady at 10:28 AM on 29 March 2011Muller Misinformation #1: confusing Mike's trick with hide the decline
Shoyemore#1 I think it's important for non-scientists like me to be Absolutely Clear In Our Minds about matters that are likely to be thrown at us in conversations and on-line. We can't fall back on something like a denialist mantra - just reciting and repeating a form of words. As it happens, we're all different. Some things turn on the lightbulb for me that leave others bemused or confused. Many people need, as any teacher knows, several exposures and different explanations before all the elements fall into place for everyone. At =that= point, further details or work or discussion are needed to get the student or interested person to understand well enough to be able to describe or discuss the issue or the phenomenon in their own words. It's not enough to get it. You have to 'own' it in a form suitable to share. So I'd disagree. It might be old hat or boring to someone who's been involved for a long time. For novices or those who've only just begun to grasp why there's a fuss about a particular matter, a new reference or an explanation in a new form of words might be just the ticket. -
Charlie A at 10:26 AM on 29 March 2011Muller Misinformation #1: confusing Mike's trick with hide the decline
For those trying to keep the various issues separate, there seems to be at least three. 1. Splicing instrumental data onto the end of tree ring based temperature reconstructions for the WMO cover. 2. Deleting post 1960 data, both WMO cover and peer reviewed papers. 3. Deleting the pre-1550 data in Briffa and Osborne 1999 article in Science and other peer reviewed articles. There may be others, but those seem to be the main ones. An example of item #3 is the annotated version of Briffa and Osborne Figure 1 from Science 1999 article.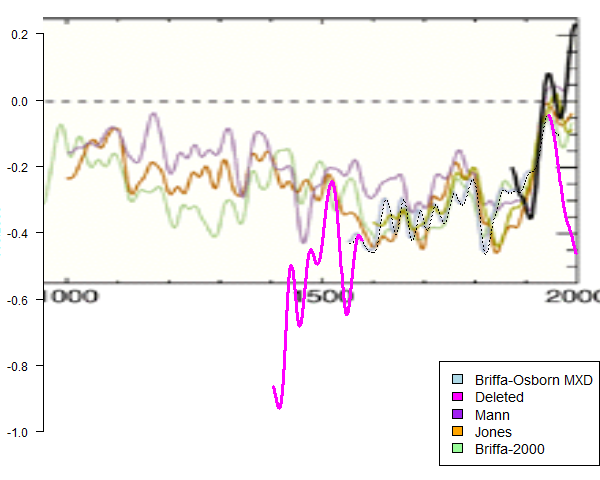 For more discussion, see Hide the Decline, Science magazine version
-
Gilles at 10:24 AM on 29 March 2011Dana's 50th: Why I Blog
SNRratio : could you please be more precise of what you're referring to as "different data or methodologies ending up with the same probability distribution " - because I don't see what you mean. Marcus#29 : "even though you admit you're not a scientists" at least a definite piece of evidence that you don't listen to what I'm saying or don't understand it - I never admitted that I wasn't a scientist, for the very good reason that I am one, and I'd have no interest in saying the opposite. Is my english really that poor ? -
Gilles at 10:15 AM on 29 March 2011A Plan for 100% Renewable Energy by 2050
les : what is wrong in 111 ? do the set of SRES scenarios encompass all likely possibilities for the future, or not ? I mean of course it would be much unlikely that a particular scenario corresponds exactly to reality : but you could expect that it will be inside the whole set, so let's formulate like this : what is the likelihood that the real history of production of FF in the XXIth lies outside the convex polyhedra built by the set of all SRES scenario for all (oil, gas, coal) production numbers, in order of magnitude ? 50 % ? 10 % ? 1 % ? less ? 114 Mucounter : I don't want to discuss here the plausibility of IEA scenarios - I just wanted to notice that they consider that oil is needed - notwithstanding the well known fact that we could so easily replace it, like all FF - isn't it somewhat strange that they seem to ignore such an obvious possibility ? -
NewYorkJ at 10:06 AM on 29 March 2011The Day After McLean
Hard to qualify the McLean prediction. If he's referring to any of the surface records, it's clearly implausible. If he's referring to satellite LT records, where is he getting 1956 data from? If he's referring just to the ENSO region (becoming quite a stretch here), he's claiming that models indicate la Nina will last "well into autumn" and last until June of the following year, which does not match mean model predictions as others have pointed out. But ENSO values were around record levels recently, which brings up a revealing claim: "Since 1958 there's been a 30% increase in atmospheric carbon dioxide and if this had a major influence on temperature we'd expect to see clear evidence of the temperature continually rising above what the SOI suggests it should be, but this is not happening". So if McLean's ENSO hypothesis is correct, we will indeed see global average temperature drop to near 1956 levels. To give him credit, it's nice to see a contrarian make a falsifiable prediction, one that is a logical extension of his ridiculous hypothesis. I have to give him credit for that. What are we left with? A serious typo? Maybe by "1956" he meant "2008"? -
Peter Hogarth at 10:06 AM on 29 March 2011Weather vs Climate
johnd at 08:11 AM on 29 March, 2011 If you are agreeing with the authors that GHG forcing is driving longer term global trends in SST and SAT, but shorter term variations in (primarily) tropical SST may in turn be driving corresponding interannual variations in SAT (such as the well known connection between ENSO or tropical SST variations and global SAT variations), then I have misunderstood your point in the final section of 116 and duly apologise. If I rephrase to clarify: If the time frame is long, it is necessary to include GHGs to get correlation. -
dana1981 at 09:49 AM on 29 March 2011Muller Misinformation #1: confusing Mike's trick with hide the decline
And for the record, as a Berkeley alumn myself, it really irritates me how fast and loose Muller is playing with the facts, to put it nicely. He's not representing the university well at all. -
dana1981 at 09:48 AM on 29 March 2011Muller Misinformation #1: confusing Mike's trick with hide the decline
Shoyemore - the problem is that Muller seems to be trying to position himself as some sort of climate expert, and yet his lecture is absolutely riddled with fundamental mistakes and misinformation. So we think it's important, if he's going to become this go-to climate expert (he's already been invited to testify before Congress on the subject on Thursday), someone needs to keep him honest and get the facts right, even if the subject is one which has been re-treaded over and over. It's just all the worse that "experts" are still getting these facts wrong. -
meanders at 09:40 AM on 29 March 2011Muller Misinformation #1: confusing Mike's trick with hide the decline
And did you notice how Prof. Muller [--snip--] the WMO graph by adding the legend 'Tree Ring Data'? Of course it's not a graph of 'tree ring data', it's a temperature reconstruction. Not to mention that he chose to use the relatively obscure WMO graph rather than the clearer and more widely publicized IPCC graph. To me the most ironic part of the (mis)quote was his (non)reference to "... Mike's Nature trick...", as in, the peer-reviewed journal Nature. To Prof. Muller, though, "the justification would not have survived peer review in any publication that I'm willing to publish in." Hm. (This section of the lecture is at 34:05 in the link in the main post.) -
shoyemore at 09:13 AM on 29 March 2011Muller Misinformation #1: confusing Mike's trick with hide the decline
I have made this comment before, but I wonder if this continual defence of Phil Jones and Michael Mann is doing more harm than good? The public know there have been several inquiries and no heads have rolled. I know deniers like McIntyre are still harping on about the e-mails (and on and on and on ....) but does it really help to issue lengthy rejoinders every time the subject comes up? It sounds defensive and plays into the belief that there is something questionable about the content of the mails. Would it be better just to say "Case Closed!" or simply shout "Boring!" and move on? PS No problem with the content of the post, which is excellent as usual. Well done, Johh, but I am concerned about the wider point above. -
Ken in Oz at 09:13 AM on 29 March 2011Zero Carbon Australia: We can do it
My previous comment @112 may have crossed the line into political commentary but I think the real point is that without the political will to act it's a hypothetical proposal. Would it work to reduce emissions if taken up? Surely it would but energy costs, dependent on reliability of supply, would be highly variable and clearly higher than fossil fuels without a carbon price (which is being strongly opposed); current style of energy intensive industry practices would need to change (isn't that the point?). A making hay (or aluminium) when the sun shines approach and/or industry taking responsibility for it's own uninteruptable power storage would probably be inherent in a renewables only approach. It could be very expensive but still not as expensive as failure to act will be. Large scale storage remains an area I think is vital to acceptance, investment and deep deployment of solar and wind that can replace fossil fuels (rather than be as well as FF's), yet has not received an appropriate level of R&D attention. -
Michael.M at 08:51 AM on 29 March 2011The Day After McLean
At EIKE "European Intitute for C(K)limate and Energy", a letterbox-Institute and the german spin-off of CFACT, they were offered a little bet after they published the McLean-Paper. The author declined with the message: "Wer wettet, will betrügen!" "Who bets, wants to betray". Very neat. A nonsenical claim and when challenged very cold feet. -
Ed Davies at 08:19 AM on 29 March 2011The Day After McLean
Just in case, I've saved a copy of that complete page (including images, etc) in a tar.gz file and put a sha256 sum of it on my Wikipedia user page to timestamp it (even if I delete it it'll be available in the history). It's not that I'm not an entirely trusting person or anything...
Prev 1803 1804 1805 1806 1807 1808 1809 1810 1811 1812 1813 1814 1815 1816 1817 1818 Next


