


 Arguments


Recent Comments
Prev 1852 1853 1854 1855 1856 1857 1858 1859 1860 1861 1862 1863 1864 1865 1866 1867 Next
Comments 92951 to 93000:
-
johnd at 03:25 AM on 11 March 2011Christy's Unconvincing Congressional Testimony
Tom Curtis at 22:33 PM, you make it all seem that the AEP is changing such that an area prone to flooding is being created where a city has long stood, rather than a city being created where a flood prone area always stood. -
michael sweet at 03:10 AM on 11 March 2011Examining Hansen's prediction about the West Side Highway
It is interesting to see the skeptics here say we can just raise the sea walls a meter and in other threads they say it is too expensive to do anything to lower CO2 emissions. How much will it cost to raise all those seawalls? Remember you have to raise the road bed also. Will you build Miami's sea walls on their beachfront? Once sea level rise really gets going after 2050 it will not be cost effective to raise the sea walls, the city will have to be moved. London is reported to be able to raise their sea walls 2 meters and then have major problems. Miami's water supply will be underwater long before then. -
Albatross at 02:48 AM on 11 March 2011Examining Hansen's prediction about the West Side Highway
HR >"Hansen was assuming CO2 would double by 2028. Are you saying that assumption is wrong." Depends-- if he was talking about CO2 equivalent as they do in the IPCC, then he might be pretty darn close. And that is part of the problem, this was an off the-cuff comment, not a formal scientific projection. Anyhow, Tom's post @39 really makes some excellent points. Thanks Tom-- I enjoy your posts, I learn a lot from them. -
Fred Staples at 02:08 AM on 11 March 2011Climate Emergency: Time to Slam on the Brakes
Moderator, 77, at the thread entitled "Greenhouse effect and the second law of thermodynamics" I contributed a simple demonstration, 337, (with an isothermal atmosphere) that radiative insulation (the blanket theory of AGW) was quite different from conductive insulation. I added some basic thermodynamics to explain the difference between heat and energy, a source of much confusion in the blog. Very Tall Guy, 329, agreed with my comments and responded with the "higher is colder" theory, complete with a chart. I then attempted to comment as follows (but the thread, sadly, had closed): "The explanation you offer, Very Tall Guy, is the only plausible explanation of the AGW effect. It is the preferred explanation of the founding fathers over at RC, and you can find it in the Rabbet rebuttal of the G and T paper, (immediately following their absurd multi-layer, back-radiation explanation). It begins with the lapse rate, a function of gravity and specific heat, which has nothing to do with radiative effects. Without this lapse rate there would be no possibility of AGW. The argument is that increasing CO2 in the cold, dry, upper atmosphere, impedes outgoing radiation, and moves the effective radiation point to higher (and therefore) colder temperatures. Outgoing radiation is reduced, incoming radiation remains the same, and the whole atmosphere and surface warms up to restore the balance. As your drawing demonstrates, the lapse rate moves to the right". This explanation is plausible, but is it true? Notice that this is a top-of-the atmosphere effect. It is absolutely incompatible with the UAH published results (Global Warming at a Glance) for the mid and lower troposphere. And if the stratosphere is not masking mid-troposphere warming, the AGW explanation of warming over the last 30 years cannot be sustained. Which brings us back to the "upper troposphere warming is masked by stratospheric cooling" argument. The data I quoted, 70, was from the Hadley centre radio-sonde data, not the satellites. I have seen no satellite stratospheric temperatures, but I would welcome a link. I followed the link in 85, and read this: " As the lower atmosphere warms due to an enhanced greenhouse effect, the upper atmosphere is expected to cool as a consequence. The simple way to think about this is that greenhouse gases are trapping heat in the lower atmosphere. Since less heat is released into the upper atmosphere (starting with the stratosphere), it cools" Simple indeed. Those words look sensible, but like "Friday is faster, far, than a fried egg", they are literally meaningless. Heat is not energy. It cannot be trapped or stored. It is, by definition and the second law of thermodynamics, the net transfer of energy between a higher and a lower temperature. Freeman Dyson refused to discuss the matter any further with the Independent's science editor when he made a similar comment. We can use the term "heat transfer" loosely, so long as we know what we mean. I am as ready as the next man to accept that if the facts don't agree with the theories (models), so much the worse for the facts, but there are limits to credibility. Returning to the subject of this thread, China has vast resources of accessible coal, and the US is wedded to transport and air conditioning. They will not be convinced by the story so far "to leave their remaining fossil fuels in the ground".Moderator Response: No, that thread (2nd law of thermodynamics contradicts greenhouse theory) is not closed. Maybe you were logged out for some reason, or there was a temporary glitch. Try commenting there again. Everybody else, do not reply here; reply over there. Thanks. -
Daniel Bailey at 01:44 AM on 11 March 2011Examining Hansen's prediction about the West Side Highway
@ RickG and Jesús Rosino RickG has the right of it. The skeptics' favorite toy, the Bounoua et al 2010 paper, must be evaluated in context: it is intended to investigate a thought model of what happens to evapotranspiration, plant growth, planetary albedo and global surface temperatures under an already doubled CO2 scenario, under which all other variables/forcings are constrained (assumes low climate sensitivity of less than 2°C, air+ocean thermal response to doubled CO2 already achieved, etc). It is a modeling study narrowly designed to evaluate an investigative line of thought only (i.e., not a forecasting model per se). What it does not do is speak to the other multitude of other feedbacks known to exist affecting sea level rise and ice sheet response to a warming world, factors known to already be at play. As such it is of zero value with regard to the topic of this post (well, maybe when the moon is in the 7th house and Jupiter collides with Mars ☺ ...). Hope that helps, The Yooper -
les at 00:56 AM on 11 March 2011A Real-World Example of Carbon Pricing Benefits Outweighing Costs
When considering the impact of the requirements for cleaner transport, it's always worth considering how technology evolution really works - and, in this case, a good case study is Horse-Manure The point being, in the case of the car for example, that the technologies can be pretty rubbish and expensive till the market need reaches a sufficient level, after which the best are selected and can really take off. Looking around at what 'people' are doing in the here and now, with relatively niche technologies - like the current gen of electric cars - is meaningless. -
Gilles at 00:41 AM on 11 March 2011A Real-World Example of Carbon Pricing Benefits Outweighing Costs
Marcus, sorry, I don't have any oil (or gas or nuclear or aeolian industry) shares (actually I don't have ANY share, even if it may be surprising for you- only old fashion spare account.) Some years ago, I had some money available from an expired life insurance contract. My banker advised me to invest in stock markets, but you know, at this time , I already read some things about impending crisis and peak oil. It was in 2007. So I preferred to buy gold- more as a game, to test my own confidence in these kinds of predictions, than to really make money. Actually stock markets plunged one year after and gold has gained twice its value. As a physicist, I like empirical tests of the predictive power of theories). Besides i have a little car burning 6l/100 km - 40 miles per gallon, I am heated by a combination of heat pump (very low carbon intensity in France thanks to nuclear energy) and wood in a close chimney ), I try to take public transportation and electric trains as much as possible : well I think there are worse ways of life. so back to the problem. I'm just stating that I don't see any solution in the evolution of car market, even including HEV that do NOT spare much fuel compared to small optimized vehicles , and the ridiculously small proportion of EV planned in the near future. But I'm ready to test this kind of predictions in the near future as well. -
Tom Curtis at 00:09 AM on 11 March 2011Examining Hansen's prediction about the West Side Highway
First, HR, Hansen's comments where clearly designed to illustrate a speculative scenario. They are not a scientific forecast. They are a spur of the moment speculation. That criticisms of such comments seems so important to deniers suggests they have nothing substantive to say about the actual science. Second, even if we allow Hansen's comments as being a substantive scientific contribution as the deniers seem to want us to do, they are clearly obsolete. This is worse than trying to dam AR4 because The First Assessment report contained a minor error. This does not mean it is inappropriate to compare Hansen's predictions with later events. However, to do so, you should take his published opinions (not of the cuff remarks), and you should allow the predictions to be adjusted in light of detailed knowledge in which there has been a clear advance since the prediction (such as the range of plausible values for climate sensitivity). This is not mystical prognostication, it is science. Third, it is very unclear what is actually predicted. The most straight forward interpretation (to me) of the prediction is what would New York look like 40 years after a doubling of CO2, ie, after the effects of such a doubling had time to impact the global climate system. So, this conversation is premature anytime before 40 years after such a doubling. On current estimates, that should be some time around 2090. -
JMurphy at 00:07 AM on 11 March 2011Examining Hansen's prediction about the West Side Highway
With regard to possible sea-levels at unspecified times in the future, it seems things are still not looking as hopeful as some so-called skeptics would like to believe : Polar ice loss quickens, raising seas -
Eric (skeptic) at 23:07 PM on 10 March 2011Climate Emergency: Time to Slam on the Brakes
Moderator: the post #8 by alan_marshall contains extra html and body tags which affects some browsers such as lynx (although not Mozilla). The specific effect is that all the posts following are unnumbered (probably due to the /html in #8)Moderator Response: [DB] Fixed, thanks! -
RickG at 22:40 PM on 10 March 2011Examining Hansen's prediction about the West Side Highway
Jesús Rosino, Thanks for the links. The Bounoua et al 2010 paper is interesting but also rather confusing, at least to me. They state a base line of 350 ppm and talk about doubling to 700 ppm. What is confusing is that all three of their modeled scenarios only extend 30 years. That is not anywhere realistic for a doubling of CO2. I admit that I only gave it a fast read and maybe I'm missing something. Nevertheless, I still think the Hansen discussion is a pre industrial base line. -
Tom Curtis at 22:33 PM on 10 March 2011Christy's Unconvincing Congressional Testimony
From Christy's written testimony:"Secondly, regarding the recent Australian flooding as a physical event in the context climate history (with the estimated 2010 maximum river height added to the chart below) one sees a relative lull in flooding events after 1900. Only four events reached the moderate category in the past 110 years, while 14 such events were recorded in the 60 years before 1900. Indeed, the recent flood magnitude had been exceeded six times in the last 170 years, twice by almost double the level of flooding as observed in 2010."
Christy supports these claims with a chart of flood heights of historical Brisbane River floods as measured at the Port Office, with the height of the 2011 flood marked in as a red bar. What he does not do is mention the effects of dams built on the Brisbane River and Stanley river (a tribuatary of the Brisbane) designed specifically to have a very large flood mitigation capacity. Is is very obvious why he does not. Modelling of the effects those dams would have had on historical floods has been carried out, and show that had those dams existed throughout the period of settlement, the 1893 flood would have peaked at 3.36 meters and the 1974 flood at 3.48 meters, compared to the 2011 flood's 4.46 meters. This is not evidence that helps make Christy's case, so unsurprisingly he makes no mention of it. But to not mention the potential impact of two major dams on the headwaters of the river when making such historical comparisons is at best negligence that calls Christy's ability as a scholar in to serious question, and at worst is a deliberate and transparent deception. Curiously, on the same day Christy made his testimony, SEQWater released its report on the 2011 flood. It shows modelling of the size of the 2011 flood as it would have been without dams. I have indicated the levels of the 1893 flood (no dams) and 1974 flood (Sommerset only) on the chart: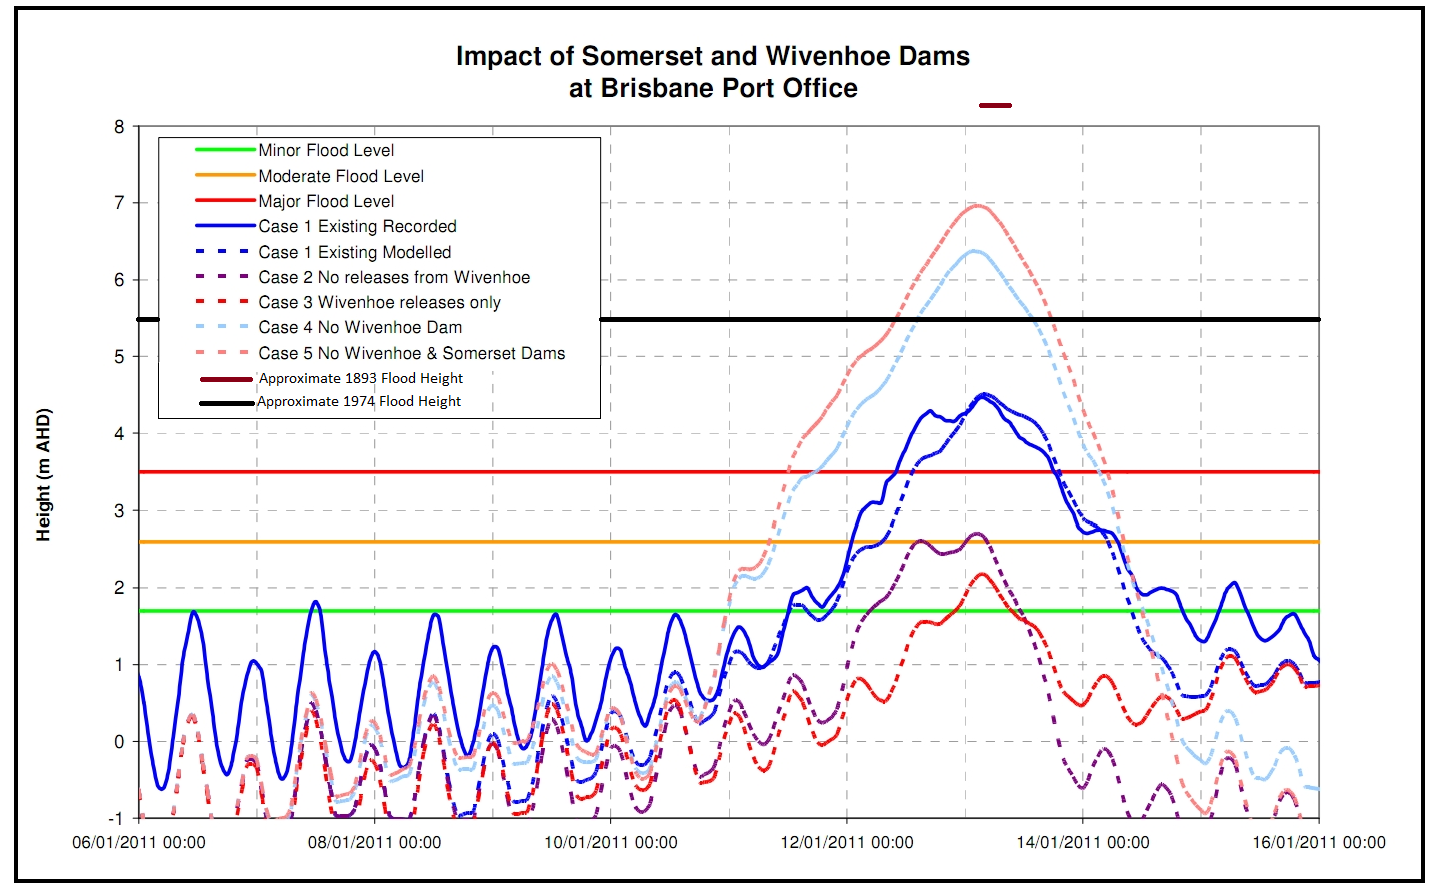 (You will notice that although the 1893 flood would have been reduced below 2011 flood levels by the presence of both dams, it in fact had a greater volume of flow unimpeded. The difference is due to the different impacts of the dams based on differences in location, timing and patterns of rainfall. I did not have that information in my blog linked above, so some claims in it are in need of updating.)
Christy goes on in his testimony to repeat slanders from The Australian, in particular that the flood was caused by negligence by the dam operators, and that 80% of the flood water came from a massive emergency release. On the chart above is modeled the flooding in Brisbane had there been no releases from the dam, and the flooding in Brisbane if only water released from the dam had been involved. At no point until well after the peak does the water from the dam exceed the levels of water from other tribuataries of the Brisbane. Clearly the Australian's claim, repeated uncritically by Christy is false.
In fact the immediate cause of the flood was an Annual Exceedance Probablity 1 in 2000 year rainfall onto the immediate surrounds of Lake Wivenhoe, that rapidly drove the lake above safe levels. Of course, mentioning an AEP 1 in 2000 year event which was part of a larger AEP 1 in 100 to 1 in 200 year event, which followed just a fortnight after an (estimated) AEP 1 in 50 year event, which in turn followed by a mere 37 years an AEP 1 in 70 year event does not make a compelling case that wild weather is not on the increase.
Far better to repeat glib falsehoods (apparently) then to actually analyze the data.
(As a side note, Christy got his chart of Brisbane Flood levels from Roger Pielke Jr and hence had access to the information above about the effects of the dams before he made his report based on my comment 17.)
(You will notice that although the 1893 flood would have been reduced below 2011 flood levels by the presence of both dams, it in fact had a greater volume of flow unimpeded. The difference is due to the different impacts of the dams based on differences in location, timing and patterns of rainfall. I did not have that information in my blog linked above, so some claims in it are in need of updating.)
Christy goes on in his testimony to repeat slanders from The Australian, in particular that the flood was caused by negligence by the dam operators, and that 80% of the flood water came from a massive emergency release. On the chart above is modeled the flooding in Brisbane had there been no releases from the dam, and the flooding in Brisbane if only water released from the dam had been involved. At no point until well after the peak does the water from the dam exceed the levels of water from other tribuataries of the Brisbane. Clearly the Australian's claim, repeated uncritically by Christy is false.
In fact the immediate cause of the flood was an Annual Exceedance Probablity 1 in 2000 year rainfall onto the immediate surrounds of Lake Wivenhoe, that rapidly drove the lake above safe levels. Of course, mentioning an AEP 1 in 2000 year event which was part of a larger AEP 1 in 100 to 1 in 200 year event, which followed just a fortnight after an (estimated) AEP 1 in 50 year event, which in turn followed by a mere 37 years an AEP 1 in 70 year event does not make a compelling case that wild weather is not on the increase.
Far better to repeat glib falsehoods (apparently) then to actually analyze the data.
(As a side note, Christy got his chart of Brisbane Flood levels from Roger Pielke Jr and hence had access to the information above about the effects of the dams before he made his report based on my comment 17.)
-
RickG at 22:05 PM on 10 March 2011Examining Hansen's prediction about the West Side Highway
HR: Hansen was assuming CO2 would double by 2028. Are you saying that assumption is wrong? Aside from Hansen not giving a time-line, his comments were about a doubling of CO2. Any time-line is irrelevant. -
Tom Curtis at 21:50 PM on 10 March 2011Christy's Unconvincing Congressional Testimony
John Christy, from his written testimony:"In the first aspect of temperature change, we have shown that the pattern of change at the surface does indeed show warming over land. However, in very detailed analyses of localized areas in the US and Africa we found that this warming is dominated by increases in nighttime temperatures, with little change in daytime temperatures. This pattern of warming is a classic signature of surface development (land cover and land use change) by human activities. The facts that (a) the daytime temperatures do not show significant warming in these studies and (b) the daytime temperature is much more representative of the deep atmospheric temperature where the warming due to the enhanced greenhouse effect should be evident, lead us to conclude that much of the surface temperature warming is related to surface development around the thermometer Subcommittee Energy and Power 14 John R. Christy, 8 March 2011 sites. This type of surface development interacts with complexities of the nighttime boundary layer which leads to warming not related to greenhouse warming (Christy et al. 2006, 2009, see also Walters et al. 2007, Pielke, Sr. 2008.)"
(My emphasis) First, Christy claims that increased night time temperatures relative to day time temperatures is a "classic signature of surface development", which is itself false. Replacing grassland with concrete or tarmac (as at an air field, for example) will increase day time temperatures and decrease night time temperatures because of the reduced water content and hence heat capacity of the surface. It will also increase the difference because vegetation takes some of the incoming energy and stores it as chemical energy, which is then released over the full diurnal cycle. What is worse than that nonsense, however, is the claim that warming due to the green house effect will have a maximum effect in day time relative to night time (b). That is a straight forward falsehood. I doubt Christy can produce a single GCM result that supports that claim. On the contrary, simple analysis (as first done by Arrhenius in 1896, and confirmed by GCMs since shows that the effect of greenhouse gases is to reduce the diurnal cycle. IMO, this is not a mistake that could be made by anyone familiar with the literature on the green house effect. -
Jesús Rosino at 21:41 PM on 10 March 2011It's not us
As well as nights warming faster than days, I would add winter warming faster than summer (if it was the sun, it would be the other way around), mentioned in the Scientific Guide to Global Warming Skepticism. -
johnd at 21:21 PM on 10 March 2011Interactive animation of the climate change impact on agriculture
Marcus at 13:06 PM, I have no doubt that you associate and talk to others who share similar views as yourself. Whether or not they are representative or not is another matter. Are you also sure they are not concerned more about short term weather events such as droughts? For representative views we should look perhaps to organisations such as the "National Farmers Federation", who represent all Australian farmers, in all fields, in all states. Five or six years ago they generally subscribed to the view that climate change was possibly the biggest risk facing Australian farmers over the coming century. This is easily found on the record. I'm not sure that they still hold that view. Recently I witnessed Jock Lawrie, the new President of the NFF, talk on climate related matters, and his general position was that they, the NFF, need to see more evidence before any major initiatives are undertaken relating to climate change. It is difficult to find any transcripts or recent statements on just what the NFF policy is at present to provide as a reference, the best I can do at the moment is the farewell address given by the outgoing President, David Crombie just four months ago. What is conspicuous by it's absence is any reference at all to climate change being the biggest risk of the coming century, or even a risk at all. In fact the only reference to climate at all talks about "adapting to our variable climate". Our variable climate. Don't you think that is a bit perplexing? Even when he speaks of the significant challenges and change that he had to face during his term, climate change does not rate a mention. Nor does it rate a mention when he speaks of future issues that will have to be faced. So what do you think is the current NFF feeling about AGW, they being the official representative of Australian farmers? David Crombie's Farewell Address -
JMurphy at 21:18 PM on 10 March 2011Examining Hansen's prediction about the West Side Highway
HumanityRules wrote : "Hansen was assuming CO2 would double by 2028. Are you saying that assumption is wrong?" Perhaps you should read what is written above : "Reiss asked me to speculate on changes that might happen in New York City in 40 years assuming CO2 doubled in amount." (Emphasis added) Hanson was NOT assuming that would ACTUALLY happen in 40 years. -
paulchevin at 21:16 PM on 10 March 2011Christy's Unconvincing Congressional Testimony
That's an impressive turnaround time for such a detailed rebuttal! Thanks. -
Ricki at 20:22 PM on 10 March 2011Christy's Unconvincing Congressional Testimony
Great run-down of the testimony. Keep up the good work. -
Jesús Rosino at 19:10 PM on 10 March 2011Examining Hansen's prediction about the West Side Highway
RickG #12 said: "its pretty well understood when climatologists talk about a doubling of CO2 they are referencing a doubling of the pre-industrial amount of 280 to 560" That depends on the context. And in this case, the question wasn't posed by a climatologist, but by a journalist. Look at this abstract, for example. It just says "climate simulations with 2 × CO2". If you don't have acces to the whole paper you may asume they are working under 2xCO2 since pre-industrial levels. However, if you have the chance to dig into the actual paper, you will see that their scenario is "under 2 × CO2 (700 ppm)". -
les at 19:10 PM on 10 March 2011Climate Emergency: Time to Slam on the Brakes
For those who think that without fossil fuels our growth based "life style" will be doomed; It's worth looking at the current "Great Stagnation" .v. "Great Divergence" debate (e.g. see here or here and all over the place). The relevance is that part of Tyler Cowen's argument in The Great Stagnation is that we've basically exhausted the growth gains from technologies like fossil fuels - and other 'low hanging fruit'. That's not to say that they're not required to preserve the status-quo; but they won't provide improvements in life-styles in the future... at least for the developed countries. There's lots of details on those debates we'll all agree or disagree with... that's the fun of it; but I think the above 'take away' is really worth while. It's not so completely wrong as to be ignorable. Then, of all the possible drivers of future growth (for the technologically advanced nations) - low carbon technology is clearly, clearly, one of the big ones... ... what is surprising is that so many of the American nation are now such cowerds as not to rise to the challenge - even though overcoming that challenge will, more than likely, put them back on the sustained-growth path... -
James Wight at 19:03 PM on 10 March 2011Climate Emergency: Time to Slam on the Brakes
In addition to all the other responses to Fred Staples, I’d add the following in response to Fred’s extraordinary claim that the medieval warming was equivalent to the warming expected this century – ie. several degrees. Even the reconstructions held up by contrarians only show the Medieval Warm Period as a few tenths of a degree warmer than the mid-20th century, or similar to today. Where is the evidence that the Medieval Warm Period was several degrees warmer?Moderator Response: [DB] Indeed, the Martín-Chivelet et al 2010 reconstruction done in Europe states:"Remarkably, the presented records allow direct comparison of recent warming with former warm intervals such as the Roman or the Medieval periods. That comparison reveals the 20th Century as the time with highest surface temperatures of the last 4000 years for the studied area."
-
HumanityRules at 18:52 PM on 10 March 2011Examining Hansen's prediction about the West Side Highway
30 Phila Phila it's not being personnal to critically examine what a scientist says about the science whether that is speculation or predictions. If Hansen wants to acknowledge that this speculation has nothing to do with the science then I'd be happy to drop it. In fact if you and others say that this has nothing to do with science then I'll drop it. The balls in your court. -
nigelj at 18:44 PM on 10 March 2011Examining Hansen's prediction about the West Side Highway
Looks like a story thats got altered in the retelling and not something you want to get too bogged down defending. Make the key points concisely, but mainly go on the attack. I think I recall Watts saying ten years ago that we were entering a cooling period. Certainly various sceptics were. Clearly it hasnt happened. But all I see is you people fighting a rear guard action and getting derailed and trumped. -
scaddenp at 18:11 PM on 10 March 2011Examining Hansen's prediction about the West Side Highway
HR = try Mitchell, J.F.B., J. Lowe, R.A. Wood and M. Vellinga, 2006: Extreme events due to human-induced climate change. Philos. T. Roy. Soc. A, 364, 2117-2133. (From looking at AR4 WG2). Includes study of Ganges delta effect from 50 year event.) -
Phila at 18:05 PM on 10 March 2011Examining Hansen's prediction about the West Side Highway
HR: If he still stands by what he said in 1988 (which he does) then it's well worth arguing about. It's especially worthwhile for people who can't really argue on the basic science, and are accordingly forced to personalize the issues, and create pointless distractions and fake scandals wherever possible. Thus, no opportunity to distort Hansen's views -- or better yet, to assume some God's-eye, extratemporal position from which to declare him wrong then, now and forever -- can be passed up. Meanwhile, "skeptics" get to churn out endless claims and predictions -- many of which are based on little more than resentment and wishful thinking, and are debunked in a matter of days, if not hours -- without losing much, if any, credibility among their peers. I don't know what's more irritating: the hypocrisy, or the assumption that we're not attentive enough to notice it. -
scaddenp at 18:03 PM on 10 March 2011Examining Hansen's prediction about the West Side Highway
HR: increasing sea-level makes storm surges worse not more frequent. On what I imagine is hard surface in advanced country, I imagine the effect will not be large. In an area like Mekong or Ganges delta, it will be a bit tougher. -
scaddenp at 17:59 PM on 10 March 2011It cooled mid-century
Correlation isn't what it is about. The question is whether modelled temperatures using estimated forcing match the actual record. See IPCC WG1 for the answer. -
Phila at 17:39 PM on 10 March 2011The Earth's Sixth Mass Extinction May Be Underway
Albatross: phila@32, Have you read "Extinction" by Dr. Michael Boulter? If not, I recommend it. I haven't, but will add it to the dangerously swaying pile. Thanks for the tip! -
Gilles at 16:59 PM on 10 March 2011It cooled mid-century
muoncounter : I would call this figure an unconvincing correlation, since the slope in the 1900-1940 period is quite comparable to the modern one, although CO2 was very different.Moderator Response: [Dikran Marsupial] yes, indeed, but CO2 is not the only forcing, not all warming is caaused by CO2 and nobody claims it is. -
Gilles at 16:52 PM on 10 March 2011Climate Emergency: Time to Slam on the Brakes
concerning volcanic activity, I'm puzzled : does a major eruption modify a 30 years slope ? what is the characteristic time of its influence ?Moderator Response: [DB] For more on that topic, go to the Two-attempts-to-blame-global-warming-on-volcanoes thread for info & related discussion. Thanks! -
Gilles at 16:45 PM on 10 March 2011Climate Emergency: Time to Slam on the Brakes
"Both of the countries mentioned are investing very heavily in renewables. The point you seem unwilling to get is that renewable energy is the economic driver of this century." so they're also investing very very heavily in fossil fuels, aren't they ? Renewable energy as a driver of growth ? where is the scientific evidence of that ? BTW you seem to think that economic growth is a good thing ? so not doing an economic growth that we could achieve is a bad thing ? comments on aerosols on the relevant post Agnostic : "There are times when I wonder if Gilles and Fred intend making a genuine contribution to the debate – in this case the need to limit atmospheric CO2 concentration to 350ppm by 2100 and how this might be done" If this is the ONLY goal, whatever it costs , then solution is simple : stop all fossil fuels production at once, bomb all oil wells, forbid all gas extraction, close all coal mines. If this is not acceptable for you, then there must be another criterion. Can you be a little more explicit about "the other thing" ? 350 ppm under which condition? what is acceptable, and what isn't ? -
Gilles at 16:40 PM on 10 March 2011It's aerosols
I don't see any quantitative fits of the variation causes by aerosols. The break of temperature curves occured in the 40 , not in the 50's. And it's much more obviously correlated with PDO than with aerosols. My question was : maybe PDO is caused by aerosols ?Moderator Response: [DB] "maybe PDO is caused by aerosols" You can't possibly be serious...Pirates, maybe, Leprechauns, certainly, but aerosols??? -
HumanityRules at 16:39 PM on 10 March 2011Examining Hansen's prediction about the West Side Highway
27 Gordon I think I acknowledged that the topic is about how Watts got it wrong. But what's more important speculation by an influential climate scientist who's helping to shape the IPCCs position or a blogger? Sorry if I disagree with the ClimateHawk's (and you) about the priority and the scope of the discussion here. Given the last sentance in the article one could argue that the topic is also why we should forget about what Hansen predicted. I'm not so sure we should do that. "In the meantime, we can stop using this conversation from 1988 as a reason to be skeptical about the human origins of global warming." Hansen was assuming CO2 would double by 2028. Are you saying that assumption is wrong? "Reiss asked me to speculate on changes that might happen in New York City in 40 years assuming CO2 doubled in amount" Whether this is a prediction or speculation is irrelevant, it's helped shape the wider debate of climate science, it comes from an influencial individual in that debate. It's worth arguing the merits of it. If he still stands by what he said in 1988 (which he does) then it's well worth arguing about. -
mandas at 16:24 PM on 10 March 2011The Earth's Sixth Mass Extinction May Be Underway
What keeps being forgotten in discussions about extinctions etc is that species extinctions are not discrete events. All species rely on other species for their survival - be it food, pollination, shelter, symbiotic relationships, etc. The 'food chain' or ecosystem is like the child's game of 'pick up sticks'. Sometimes, you can remove a single stick from the pile and not much happens. Other times, the removal of one stick causes others to move and fall. Eventually, if you remove enough sticks, the whole pile comes crashing down. The ecosystem is the same. Sometimes the extinction of one species can essentially go unnoticed. However, in other cases the extinction of a species will cause cascading trophic events and can cause multiple other species to go extinct or to undergo substantial change. Eventually, if enough critical species go extinct, the whole system falls apart and there is nothing anyone can do to prop it up. What's worse, we only have a very limited understanding of which species are the critical ones. We do know there are some species such as phytoplankton which underpin almost all life on Earth - and we do know they are undergoing dramatic changes right now as a result of climate change and other anthropogenic influences. But what exactly that will mean for life as we know it is unclear. There are others - bees and coral for example. But we just don't know how many other species are out there that could cause the pile to collapse, nor what their current circumstances or vulnerability to change are. We are tampering with forces we don't understand, and which can have profound effects on our way of life. This is not about a few feet of sea level rise, or higher insurance premiums because of more extreme weather events. Despite our grandious posturings, we are an animal species just like every other animal species, and subject to the same ecosystem influences. Human survival of the current round of extinctions is not guaranteed. -
Gordon1368 at 15:59 PM on 10 March 2011Examining Hansen's prediction about the West Side Highway
@#26 HR I took a hard look at Hansen's prediction for 2028 and discovered, he did not make a prediction for 2028 at all. He was asked in 1988, if CO2 doubles, what kind of impact would that have. He illustrated the impact of a doubling of CO2 by talking about what a meter rise in sea level would look like, he did not predict it would happen by any specific time in that interview. The 40-year period, and the 20=year period seem to have been tacked on along the way. Is it really that hard to understand the topic here? The topic is how people twisted his illustration of the impact of a hypothetical doubling of CO2 into a "prediction" of an event within a specific period of time. -
Tom Dayton at 15:59 PM on 10 March 2011CO2 effect is saturated
tjfolkerts, regarding lapse rate, you'll be interested to read Eli Rabbett's post about a skeptic named Hermann Harde, who used a climate model so simple that it had only two layers of atmosphere--too few layers to adequately represent the strength of the effect of higher layers being cooler. -
Karamanski at 15:43 PM on 10 March 2011Christy's Unconvincing Congressional Testimony
One of the things I have noticed about John Christy is: depending on who he is talking to, he will give entirely different answers about global warming. For example, in the bogus documentary "Dommsday Called Off", he says the Earth isn't even warming and the urban heat island effect accounts for most of the warming in surface temperatures. But, his UAH data agrees remarkably well with surface temperatures even though he says it doesn't, when interviewed by skeptical media outlets. Christy's self-contradictory claims are very perplexing given the fact that he has impressive credentials and is still actively engaged in climate change research. -
HumanityRules at 15:37 PM on 10 March 2011Examining Hansen's prediction about the West Side Highway
21 scaddenp So to be pedantic (or scientific) about this if the issue is storm surge then what are the chances that anybody looking out of the window from the GISS building in 2028 will witness flooding from an extreme weather event? Will 1:100 year events become 1:25 years events? Or will they become annual? Should Hansen state "The West Side Highway [which runs along the Hudson River] will be under water" Not even probably, likely, possibly. Will NY city see this coming and added another metre to the seawall? If we tried to look at this scientifically I suspect Hansen is more likely in the 5% region of the curve than the 95% region and that would be accepting the IPCCs version of the science. I know the point here is to show the sloppiness of WUWT but really shouldn't we be taking a hard look at Hansens prediction even if it's for 2028? -
Albatross at 15:35 PM on 10 March 2011Examining Hansen's prediction about the West Side Highway
HR, Don't make the mistake of assuming that GSL will rise uniformly. Consider this research from 2009: "A study in Nature Geoscience in March warned that warmer water temperatures could shift ocean currents in a way that would raise sea levels off the Northeast [USA] by about 8 inches (20 cm) more than the average global sea level rise. But it did not include the additional impact of Greenland's ice, which at moderate to high melt rates would further accelerate changes in ocean circulation and drive an additional 4 to 12 inches (about 10 to 30 cm) of water toward heavily populated areas of northeastern North America on top of average global sea level rise. More remote areas in extreme northeastern Canada and Greenland could see even higher sea level rise." So it may well be that the east coast of N. America experiences a greater increase in sea level than other areas will.
If I were a betting man, my money would be on Hansen. His prediction may not be perfect, but it will probably be pretty close to the mark.
Moderator Response: [DB] Nice study. Similar to the Bamber et al study in Science 2009, which found a 25% greater impact from SLR on the US Eastern Seaboard cities than the global average.
So it may well be that the east coast of N. America experiences a greater increase in sea level than other areas will.
If I were a betting man, my money would be on Hansen. His prediction may not be perfect, but it will probably be pretty close to the mark.
Moderator Response: [DB] Nice study. Similar to the Bamber et al study in Science 2009, which found a 25% greater impact from SLR on the US Eastern Seaboard cities than the global average. -
Albatross at 15:25 PM on 10 March 2011Christy's Unconvincing Congressional Testimony
Dana, Sorry, you did say that you were addressing his written testimony. You should try and watch the proceedings, they will be available online soon I hope. -
HumanityRules at 15:24 PM on 10 March 2011Examining Hansen's prediction about the West Side Highway
17 muoncounter "Red is just a bit above current sea level." That would be 1-7 metres (seawalls are 1.5M above SL at their minimum in the south of the island). At it's worse SLR is expected to be in the region of 10-20cm by 2028. It's still presently 3.4mm/yr and has been for the past 20 years. It's going to have to average more than 3 times that amount from now on to hit the 20cm mark by 2028. I suspect sea level isn't necessarily the issue here rather suspected increase in storm severity. Has anybody read the extended quote from Hansen. Honestly this reads like post-apocalyptic SF to me. "The West Side Highway [which runs along the Hudson River] will be under water. And there will be tape across the windows across the street because of high winds. And the same birds won't be there. The trees in the median strip will change." Then he said, "There will be more police cars." Why? "Well, you know what happens to crime when the heat goes up." (this is from the Salon interview with Reiss so take it with as big a pinch of salt as you like but I don't see anybody running to correct this part) -
nofreewind at 15:03 PM on 10 March 2011Examining Hansen's prediction about the West Side Highway
Hank, maybe you should check out the NOAA San Fransisco sea level charts. http://tidesandcurrents.noaa.gov/sltrends/sltrends_station.shtml?stnid=9414290 I know you are concerned about the models, but for 30 years, since 1980, there has been appreciable rise in sea level. 8 inches per century, same old, same old. -
tjfolkerts at 14:59 PM on 10 March 2011CO2 effect is saturated
Tom, Thanks for the info and the link to the other discussions - they were quite informative. I should have guessed that if a relative novice like me can think of it, then others would have already explored the idea in more depth. :-) -
scaddenp at 14:45 PM on 10 March 2011Climate Emergency: Time to Slam on the Brakes
Glenn, I am very well aware of that. I was waiting to see whether Fred agreed that this was the proper way to experimental verify temperature spatial correlation or not. You could add in the analysis of Jones and Kelly too and probably many others. -
dana1981 at 14:43 PM on 10 March 2011Christy's Unconvincing Congressional Testimony
Alby - I didn't see the live proceedings, but heard that Christy said something about Antarctic sea ice. Not in his written testimony though. -
muoncounter at 14:40 PM on 10 March 2011Examining Hansen's prediction about the West Side Highway
There's no shortage of garbage. But it did take 16+ years just to figure out how to fix a hole in the road. Who knows how long it'll take to figure out what to do, as scaddenp points out, in the event of a serious storm on top of some accelerated rise?
-
Glenn Tamblyn at 14:38 PM on 10 March 2011Climate Emergency: Time to Slam on the Brakes
Glenn Tamblyn @85 My Oops. Albatross's second graph is radiosonde data not Sat's. Rest of my comments still apply. -
Glenn Tamblyn at 14:35 PM on 10 March 2011Climate Emergency: Time to Slam on the Brakes
scaddenp @83 Which is exactly what Hansen et al did when developing the methodology for the GISS temperature series. Details here http://pubs.giss.nasa.gov/cgi-bin/abstract.cgi?id=ha00700d Abstract of Hansen & Lebedeff 1987 "We analyze surface air temperature data from available meteorological stations with principal focus on the period 1880-1985. The temperature changes at mid- and high latitude stations separated by less than 1000 km are shown to be highly correlated; at low latitudes the correlation falls off more rapidly with distance for nearby stations. We combine the station data in a way which is designed to provide accurate long-term variations. Error estimates are based in part on studies of how accurately the actual station distributions are able to reproduce temperature change in a global data set produced by a three-dimensional general circulation model with realistic variability. We find that meaningful global temperature change can be obtained for the past century, despite the fact that the meteorological stations are confined mainly to continental and island locations. The results indicate a global warming of about 0.5-0.7°C in the past century, with warming of similar magnitude in both hemispheres; the northern hemisphere result is similar to that found by several other investigators. A strong warming trend between 1965 and 1980 raised the global mean temperature in 1980 and 1981 to the highest level in the period of instrumental records. The warm period in recent years differs qualitatively from the earlier warm period centered around 1940; the earlier warming was focused at high northern latitudes, while the recent warming is more global. We present selected graphs and maps of the temperature change in each of the eight latitude zones. A computer tape of the derived regional and global temperature changes is available from the authors" 'Computer tape'! How times have changed. -
Glenn Tamblyn at 14:26 PM on 10 March 2011Climate Emergency: Time to Slam on the Brakes
Fred S @70 etc "At RC you will find that the crucial "fingerprint" of AGW is the simultaneous warming of the troposphere and cooling of the stratosphere. Since the UAH data shows no warming of the mid-troposhere since 1979 (the only significant warming period) this data alone would be sufficient to destroy the CO2 theory. Gavin Schmidts (of RC fame) response to me on this point is interesting: [Response: The MT (mid-troposhere) data has a very significant contribution from the stratosphere (which is cooling) and so is not expected to be rising very substantially. This is the whole reason why MSU-LT and the Fu and Johnson approaches were developed. - gavin] So, assuming that the UAH luminaries have not understood this argument, and are consequently publishing misleading data, is the stratosphere really cooling?." Fred The UAH (and RSS) mid-troposphere products (TMT) are based on using the T2 channel from the satellites. This signal originates primarily form the lower & mid troposphere but around 15% comes from the lower stratosphere where there has been cooling. So the signal recorded by T2 is an underestimate of the tropospheres actual temp change. We know the stratosphere has been cooling based on the T4 channel from the satellites. Virtually all of its signal orginates in the lower stratosphere with minimal contamination from the troposphere. In 1992 Spencer & Christy at UAH created a new temperature product using a mathematical technique that removes the stratospheric influence from T2 (but unfortunately also much of the mid tropospheric signal as well) This is their TLT product. In 2005 RSS added a similar product. All the analyses from RSS show greater trends than UAH. This is believed to be due to several factors, primarily their different handling of the short overlap time between the NOAA-9 and NOAA-10 satellites and differing methods of handling Diurnal Drift. The Mid troposphere data shown by Albatross is the RSS T2 analysis - warmer than UAH T2 but still not compensating for stratospheric biasing. Several teams have looked at other analysis techniques - referred to by Gavin, Vinnikov & Grody and Zou et al. Fu & Johansen's method uses a different technique to extract temps from between the 830hPa to 300hPa levels and remove the stratospheric influence; these show warming throughout the entire troposphere at levels equal to or higher than the TLT products. But their method isn't useful for obtaining local or regional trends. However, NOOA maintain a running analysis using FU et al's technique applied to both the UAH and RSS TMT products here http://www.ncdc.noaa.gov/temp-and-precip/msu This may be the source of Albatross's second graph. Vinnikiv & Grody used a quite different technique again and produced even warmer results 0.20 to 0.26 C/Decade and this is without removing the stratospheric bias. Recently Zou et al have published a newer method for performing the critical intersatellite correlation needed to have an on-going trend over multiple satellites. They report a trend 1979 - 2010 of 0.137 C/Decade for TMT again without removing the stratospheric bias. You can see that here http://www.star.nesdis.noaa.gov/smcd/emb/mscat/mscatmain.htm To these comments: "1880 to 1940: A period of warming. The mountain glaciers recede and the ice in the Arctic Ocean begins to melt again. The causes of this period of warming are unknown." Some possible causes. Low level CO2 warming from the modest increase of CO2 till then. Slightly higher period of Solar activity. Low levels of Volcanic activity. And your transition point of 1940 may more accurately be 1945. Final contributory cause. A change in the nationality (and thus measurement method) of the ships taking the majority of SST measurements during the war years to those immediately after adding a small warming bias during the war years and a small cooling bias afterwards. "1940 to 1977: Cooling period. The temperatures are cooler than currently. Mountain glaciers recede, and some begin to advance. The tabloids (and climate science) inform us of widespread catastrophes due to the "New Glaciation". The causes of this period of cooling are unknown." Causes. Increased GH Gases. AGW was occurring then as evidenced by the fact that night time temps do show warming over that period. But this was masked by cooling effects. Increased volcanic activity. And much higher aerosol levels due to the post war boom before we started introducing Clean-Air Acts in the 60's/70's. All those Aerosols masking the warming. After 1970, the air gets cleaned up, GH gas warming intensifies and temps (and heat content in the ocean) start to climb, now only interspersed by two major eruptions - El Chinchon & Pinatubo. And Solar output is a little lower so warming really is greater. Then the 2000's 'flattening'. Particularly if we use the El Nino of 1998 as a bad reference point. What has happened this decade? A long and deep Solar Minimum at the end of the decade. Increasing dirty industrialisation in China, India etc. Increased Contrails from the growth of air-travel. So more masking aerosols at the same time as reduced solar output. But even then it was only a levelling off, not a real drop. Consider. 1998 and 2010 are roughly equal for average temp depending on which source you use. 1998 was one of the biggest El Nino's, an event that warms the atmosphere. 2010 was (still is) a huge La Nina, an event that cools the atmosphere. So 1998 + Warming El Nino matched by 2010 and cooling La Nina and milder Sun and more Aerosols. Looks like something else in 2010 is holding the temps up against these other forces. Could it be...GH Gases? (Moderator. I am on a @&%!ing lousy Internet Connection at present. If possible, grovel, beg, could you insert some links to SkS arguments related to the points I have just made)Moderator Response: [DB] Added links.
Prev 1852 1853 1854 1855 1856 1857 1858 1859 1860 1861 1862 1863 1864 1865 1866 1867 Next


