


 Arguments


Recent Comments
Prev 1853 1854 1855 1856 1857 1858 1859 1860 1861 1862 1863 1864 1865 1866 1867 1868 Next
Comments 93001 to 93050:
-
Glenn Tamblyn at 14:38 PM on 10 March 2011Climate Emergency: Time to Slam on the Brakes
Glenn Tamblyn @85 My Oops. Albatross's second graph is radiosonde data not Sat's. Rest of my comments still apply. -
Glenn Tamblyn at 14:35 PM on 10 March 2011Climate Emergency: Time to Slam on the Brakes
scaddenp @83 Which is exactly what Hansen et al did when developing the methodology for the GISS temperature series. Details here http://pubs.giss.nasa.gov/cgi-bin/abstract.cgi?id=ha00700d Abstract of Hansen & Lebedeff 1987 "We analyze surface air temperature data from available meteorological stations with principal focus on the period 1880-1985. The temperature changes at mid- and high latitude stations separated by less than 1000 km are shown to be highly correlated; at low latitudes the correlation falls off more rapidly with distance for nearby stations. We combine the station data in a way which is designed to provide accurate long-term variations. Error estimates are based in part on studies of how accurately the actual station distributions are able to reproduce temperature change in a global data set produced by a three-dimensional general circulation model with realistic variability. We find that meaningful global temperature change can be obtained for the past century, despite the fact that the meteorological stations are confined mainly to continental and island locations. The results indicate a global warming of about 0.5-0.7°C in the past century, with warming of similar magnitude in both hemispheres; the northern hemisphere result is similar to that found by several other investigators. A strong warming trend between 1965 and 1980 raised the global mean temperature in 1980 and 1981 to the highest level in the period of instrumental records. The warm period in recent years differs qualitatively from the earlier warm period centered around 1940; the earlier warming was focused at high northern latitudes, while the recent warming is more global. We present selected graphs and maps of the temperature change in each of the eight latitude zones. A computer tape of the derived regional and global temperature changes is available from the authors" 'Computer tape'! How times have changed. -
Glenn Tamblyn at 14:26 PM on 10 March 2011Climate Emergency: Time to Slam on the Brakes
Fred S @70 etc "At RC you will find that the crucial "fingerprint" of AGW is the simultaneous warming of the troposphere and cooling of the stratosphere. Since the UAH data shows no warming of the mid-troposhere since 1979 (the only significant warming period) this data alone would be sufficient to destroy the CO2 theory. Gavin Schmidts (of RC fame) response to me on this point is interesting: [Response: The MT (mid-troposhere) data has a very significant contribution from the stratosphere (which is cooling) and so is not expected to be rising very substantially. This is the whole reason why MSU-LT and the Fu and Johnson approaches were developed. - gavin] So, assuming that the UAH luminaries have not understood this argument, and are consequently publishing misleading data, is the stratosphere really cooling?." Fred The UAH (and RSS) mid-troposphere products (TMT) are based on using the T2 channel from the satellites. This signal originates primarily form the lower & mid troposphere but around 15% comes from the lower stratosphere where there has been cooling. So the signal recorded by T2 is an underestimate of the tropospheres actual temp change. We know the stratosphere has been cooling based on the T4 channel from the satellites. Virtually all of its signal orginates in the lower stratosphere with minimal contamination from the troposphere. In 1992 Spencer & Christy at UAH created a new temperature product using a mathematical technique that removes the stratospheric influence from T2 (but unfortunately also much of the mid tropospheric signal as well) This is their TLT product. In 2005 RSS added a similar product. All the analyses from RSS show greater trends than UAH. This is believed to be due to several factors, primarily their different handling of the short overlap time between the NOAA-9 and NOAA-10 satellites and differing methods of handling Diurnal Drift. The Mid troposphere data shown by Albatross is the RSS T2 analysis - warmer than UAH T2 but still not compensating for stratospheric biasing. Several teams have looked at other analysis techniques - referred to by Gavin, Vinnikov & Grody and Zou et al. Fu & Johansen's method uses a different technique to extract temps from between the 830hPa to 300hPa levels and remove the stratospheric influence; these show warming throughout the entire troposphere at levels equal to or higher than the TLT products. But their method isn't useful for obtaining local or regional trends. However, NOOA maintain a running analysis using FU et al's technique applied to both the UAH and RSS TMT products here http://www.ncdc.noaa.gov/temp-and-precip/msu This may be the source of Albatross's second graph. Vinnikiv & Grody used a quite different technique again and produced even warmer results 0.20 to 0.26 C/Decade and this is without removing the stratospheric bias. Recently Zou et al have published a newer method for performing the critical intersatellite correlation needed to have an on-going trend over multiple satellites. They report a trend 1979 - 2010 of 0.137 C/Decade for TMT again without removing the stratospheric bias. You can see that here http://www.star.nesdis.noaa.gov/smcd/emb/mscat/mscatmain.htm To these comments: "1880 to 1940: A period of warming. The mountain glaciers recede and the ice in the Arctic Ocean begins to melt again. The causes of this period of warming are unknown." Some possible causes. Low level CO2 warming from the modest increase of CO2 till then. Slightly higher period of Solar activity. Low levels of Volcanic activity. And your transition point of 1940 may more accurately be 1945. Final contributory cause. A change in the nationality (and thus measurement method) of the ships taking the majority of SST measurements during the war years to those immediately after adding a small warming bias during the war years and a small cooling bias afterwards. "1940 to 1977: Cooling period. The temperatures are cooler than currently. Mountain glaciers recede, and some begin to advance. The tabloids (and climate science) inform us of widespread catastrophes due to the "New Glaciation". The causes of this period of cooling are unknown." Causes. Increased GH Gases. AGW was occurring then as evidenced by the fact that night time temps do show warming over that period. But this was masked by cooling effects. Increased volcanic activity. And much higher aerosol levels due to the post war boom before we started introducing Clean-Air Acts in the 60's/70's. All those Aerosols masking the warming. After 1970, the air gets cleaned up, GH gas warming intensifies and temps (and heat content in the ocean) start to climb, now only interspersed by two major eruptions - El Chinchon & Pinatubo. And Solar output is a little lower so warming really is greater. Then the 2000's 'flattening'. Particularly if we use the El Nino of 1998 as a bad reference point. What has happened this decade? A long and deep Solar Minimum at the end of the decade. Increasing dirty industrialisation in China, India etc. Increased Contrails from the growth of air-travel. So more masking aerosols at the same time as reduced solar output. But even then it was only a levelling off, not a real drop. Consider. 1998 and 2010 are roughly equal for average temp depending on which source you use. 1998 was one of the biggest El Nino's, an event that warms the atmosphere. 2010 was (still is) a huge La Nina, an event that cools the atmosphere. So 1998 + Warming El Nino matched by 2010 and cooling La Nina and milder Sun and more Aerosols. Looks like something else in 2010 is holding the temps up against these other forces. Could it be...GH Gases? (Moderator. I am on a @&%!ing lousy Internet Connection at present. If possible, grovel, beg, could you insert some links to SkS arguments related to the points I have just made)Moderator Response: [DB] Added links. -
scaddenp at 14:25 PM on 10 March 2011Examining Hansen's prediction about the West Side Highway
Charlie - if sealevel stays are 3-4mm per year, then I would say no problem. We can adapt fast enough. If it exceeds 10mm/year, that is another story but that is the prediction for latter part of this century. Frankly worrying about Manhattan seems a little twee compared to issues of storm surge, erosion and salt-invasion on the big deltas of the world. -
Charlie A at 14:22 PM on 10 March 2011Examining Hansen's prediction about the West Side Highway
muoncounter: "Yes, it's called landfill". That's exactly what I meant. Do you expect our ability to fill in shoreline will be reduced or enhanced in the future? Here is a graph of the sea level rise at Battery Park, per NOAAs records. Note that it has pretty much risen at the same rate over the last 150 years, and has not yet drowned the city.
-
Bern at 14:20 PM on 10 March 2011It's too hard
It's a bit of misdirection at work. What makes for a high standard of living is not ready access to fossil fuels. It's ready access to energy. If that energy just happens to come from, say, solar / wind / hydro / nuclear / biofuel sources, then, well, what do you know, the standard of living is still the same! I also agree with michael sweet's comment at #5: many developed economies are running quite nicely with far lower carbon intensity that the US or Australia. But, no, it's all about "I've got a right to drive the kids to school in a two-and-a-half-tonne SUV that gets 12 miles to the gallon!" The low-hanging fruit is definitely points 1 and 3 in the article above. The cost is minimal, but the savings in terms of energy are quite substantial! By "minimal cost", I really do mean minimal, e.g. with far stricter fuel efficiency requirements on new vehicles, total fuel consumption would drop significantly as older vehicles were replaced. What would the cost be? Approximately zero, financially, but certainly a lot of complaining from people who like to drive huge cars with thirsty engines... What about better insulation of buildings? Well, there are plenty of case studies pointing out that this is a net positive over the longer term, as you generally make back more than the cost of the insulation in terms of lower energy bills. This is only going to become more so as electricity and gas prices continue to rise. -
muoncounter at 14:15 PM on 10 March 2011Examining Hansen's prediction about the West Side Highway
"Manhattan has consistently expanded in size," Yes, it's called landfill. -
scaddenp at 14:14 PM on 10 March 2011The Earth's Sixth Mass Extinction May Be Underway
A catastrophe for pseudo-skeptics would be higher taxes, more expensive fuel, or horrors, regulations. Raising the global mortality rate by several million a year is just fine so long as they are long way away and preferably Muslim. -
Charlie A at 14:12 PM on 10 March 2011Examining Hansen's prediction about the West Side Highway
Man seems to be keeping ahead of the ocean. Manhattan has consistently expanded in size, even as the sea level rises. http://www.racontours.com/archive/coastline_anim.php -
Bern at 14:03 PM on 10 March 2011The Earth's Sixth Mass Extinction May Be Underway
I'm quite willing to agree that climate change is only one of the factors that might drive this mass extinction event (which already seems to be well underway). But making a bad situation worse is never a good approach. Reading some of the responses above to my comment, I was struck by a thought: it seems many of the AGW 'skeptics' have an attitude of "Hey, I got mine, why should I care?" This particularly applies to the biodiversity that is being threatened by mass extinction, although I've seen quotes suggesting that some of them don't hesitate to apply it even to their own children. I can only put it down to a profound ignorance of the role that ecosystem services play in ensuring the quality of life that we enjoy today. -
Albatross at 14:00 PM on 10 March 2011Christy's Unconvincing Congressional Testimony
Dana, Didn't Christy also make the misleading comment that the Antarctic is gaining ice? I can't remember is he said that or that the Antarctic sea-ice is increasing. Either way, both are wrong and/or misleading. RickG, Yes, it was quite partisan and the Republican's especially seemed to intent on using their 5 minutes to make ideological rants or spout as many myths about climate science and AGW as they could. They should be ashamed, yet bizarrely they wear their ignorance like a badge of honour and (wrongly) perceive themselves as Galileos. Incredibly disappointing and discouraging that a nation who put men on the moon and which has made so many fine scientific discoveries has now sunk to this. What is annoying is that the EPA have addressed all their concerns in detail, see here. -
muoncounter at 13:50 PM on 10 March 2011Examining Hansen's prediction about the West Side Highway
For the record, here's the Sea Level Rise Explorer map of Manhattan. The red strip along the southwest side of the island is the West Side Highway. Red is just a bit above current sea level. The PATH trainyards just south of 34th St are a particularly low point; the aircraft carrier referred to is part of a museum a few blocks north. The GISS office is uptown and uphill a bit (in the green), but with a good view of events. If you zoom the map, look for Broadway and 112St, about 1000' off the river. -
HumanityRules at 13:41 PM on 10 March 2011Examining Hansen's prediction about the West Side Highway
"Your prior comment was deleted due to violations of the Comments Policy." Which one? It made exactly the same point as MattJ in #1 except with a little more sarcasm (and I thought fun). OK I'll quote MattJ and say I absolutely agree with him. "That still sounds implausible, not at all helpful to getting people to take the issue and the predictions seriously." -
HumanityRules at 13:34 PM on 10 March 2011Examining Hansen's prediction about the West Side Highway
You don't like sarcasm?Moderator Response: [muoncounter] Your prior comment was deleted due to violations of the Comments Policy. -
HumanityRules at 13:32 PM on 10 March 2011Examining Hansen's prediction about the West Side Highway
Erm maybe I should eat my words :) I thought I'd post a link to a webcam of West Side Highway so people could follow the progress of the rising water. I got this one which seems to show an aircraft carrier travelling down the road. It looks like we're too late! http://www.earthcam.com/panasonic/new_york_wshw.html -
RickG at 13:31 PM on 10 March 2011Christy's Unconvincing Congressional Testimony
I watched the hearing and was very disappointed with the proceedings. It seemed the policy makers (both sides) were more interested in making their own statements than trying to solicit and understand any of the science. It also seemed that both sides directed questions to get the answers they wanted to hear. -
muoncounter at 13:28 PM on 10 March 2011Climate Emergency: Time to Slam on the Brakes
Fred S, Thanks for the reassurance; I guess nuclear plants are safe after all. However, on a more relevant matter for this thread: I note that your fair summary is clipped verbatim from 'The global warming scam'. Google "4,000 years ago to AD 900: Global cooling begins" and you get the whole thing, kicking around the denier echo-chamber since 2005 or so. As you've seen from the response, that's not a much of a source. If you care about your own credibility, please investigate some real science. -
muoncounter at 13:08 PM on 10 March 2011It's too hard
Gilles, "if you really think that the influence of fossil fuel consumption on the standard of living is less obvious... " I most certainly did not say that; I simply said that your attempt at substantiating your point failed dismally. It would be far more beneficial for the conversation at large if you tempered your opinions with actual facts. That is really what this website is all about. Facts can be discussed and evaluated; opinions just hang in the breeze. -
Marcus at 13:06 PM on 10 March 2011Interactive animation of the climate change impact on agriculture
"But there is a real place in the debate for those people, those with dirt under their fingernails, who are in the unique position to be able see whether the way the climate performs in theory is how it actually manifests itself on the ground." Yep, like the people I & my fellow employees talk to on a pretty regular basis-& you want to guess what their feeling is about Global Warming John? They're even more nervous about it than the scientists are-because they're seeing first hand the negative impacts that warming temperatures & more extreme hydrological cycles are having on their crop yields. -
Marcus at 13:01 PM on 10 March 2011Interactive animation of the climate change impact on agriculture
"•Cereal grains including rice, wheat, barley, oats and rye average between 25 and 64 percent higher yields under elevated CO2 levels." Well perhaps-*if* the plants in question are getting sufficient nitrogen, water & trace elements, & are not also being subjected to abnormally warm weather. Also, recent FACE trial results (from Horsham in Victoria) suggest that-even in ideal conditions-any such gains are short-term only, as the plants quickly become acclimatized to the higher CO2 levels. -
ProfMandia at 12:21 PM on 10 March 2011Blaming the Pacific Decadal Oscillation
Timothy Chase: Please contact me ASAP. mandias-at-sunysuffolk.edu -
GaryB at 12:14 PM on 10 March 2011Examining Hansen's prediction about the West Side Highway
I am so tired of the right's penchant for equating predictions with prophecies. There are always conditions inherent in predictions that if changed outside the assumed or stated limits nullifies the prediction. It becomes neither right nor wrong. -
scaddenp at 11:51 AM on 10 March 2011The Climate Show Episode 8: Kevin Trenberth
I asked about the OLR "trend" in NOOA data. Gavin Schmidt's response: "it's almost certainly from the NCEP reanalysis. The trends are corrupted by changes in the observing network and uncorrected biases in obs make these trends not robust and untrustworthy. If you look at the ERA interim, I'm sure it would look very different." Note exactly the first time there has been issues with NCEP reanalysis trends that arent. While I note papers using the OLR from ERA-interim (eg Claudio Belotti, Richard Bantges and John Harries), I cant actually find the data so maybe not released yet. Anyone know better? -
Bob Tisdale at 11:45 AM on 10 March 2011Blaming the Pacific Decadal Oscillation
DB: Since you believe Tamino's use of the wrong SST dataset in an analysis is "de facto standard in climate data analysis", there's no reason for me to continue to discuss this matter. -
scaddenp at 11:37 AM on 10 March 2011Climate Emergency: Time to Slam on the Brakes
Further to what RickG said. Fred, thought experiment - you could set up temperature monitoring network over say a small region, measure for a couple of years to get some averages, then start comparing anomaly temperatures from these stations to see how well they are spatially correlated. If the temperature anomalies are highly spatially correlated, then could reduce no. of station. If not, then you need to increase network to get better estimate of region temperature. Seem like a reasonable experiment to you? You would accept its results? -
scaddenp at 11:27 AM on 10 March 2011Climate Emergency: Time to Slam on the Brakes
Agnostic - google for their "contributions" over at realclimate. See what you think (same old, same old despite helpful responses obviously ignored). Perhaps comments policy needs an extra clause: claims in responses must be substantiated by data and/or papers.Moderator Response: [DB] Indeed, some have a knack for saying less with more. As for the comments policy, repetitive unsubstantiated claims can and have gotten deleted in the past; that can also happen in the future. :) -
michael sweet at 11:27 AM on 10 March 2011It's too hard
Gilles: According to this Wiki page almost all European countries and Hong Kong produce about 25% of the CO2 per capita as the USA. My observation is that their living standards are about the same as the USA. Can you provide data to support your extraordinary claim of standard of living depending on fossil fuel consumption, or would you rather continue to assert this claim without data? Obviously it is possible to live well with 25% of USA emissions, Europe is doing it now. You have provided little or no data to support your claims. Why should I believe your hand waving? -
Craig Cogger at 11:23 AM on 10 March 2011Interactive animation of the climate change impact on agriculture
The Penn State model is a useful educational tool for visualizing projected big picture impacts of climate change on agricultural production. Stockle et al. at Washington State University (USA) recently published the results of a similar modeling project focused on climate impacts on rainfed wheat, irrigated potatoes, and irrigated apples, three major crops eastern Washington, which has a cool semi-arid to sub-humid climate. They compared four climate models over using the IPCC A1B scenario (middle of the road CO2 emissions), linking them to a well-tested crop growth model. For each crop they ran 4 scenarios, 1) climate effect alone, 2) climate + adaptation (variety and planting date shifts), 3) climate and CO2 effect, and 4) climate + CO2 + adaptation. Modeled temperature increases by late century were around 3 C (compared with 1975-2005 baseline) and precipitation increases were projected. Only winter wheat showed yield increases from climate alone (at some locations), while spring wheat, apples and potatoes declined. Including CO2 effects and adaptation resulted in projected yield increases for apples and potatoes, but decline in quality could be an issue. In some ways this study approaches a best case scenario. The simulations assumed adequate nutrients (likely to be true) and sufficient irrigation water (more problematic given that snowpack is a major local irrigation source), and did not account for extreme weather events, or changes in weed, insect or disease pressure. The authors also noted uncertainty of the extent beneficial effects of CO2 as another caveat. -
Marcus at 11:16 AM on 10 March 2011A Real-World Example of Carbon Pricing Benefits Outweighing Costs
"And I repeat : I do not take as granted the speculations about 2020. I'm just looking at ordinary people around me." I do so love how some people turn anecdotal evidence into general *fact*. This claim is as utterly pointless, Gilles, as your earlier question to me. Though I do know several people who own either an EV or an HEV, even if they didn't it wouldn't change the basic fact that an both classes of vehicle generate only an average of 13kg of CO2/100km (even if powered entirely from coal) compared to around 25kg of CO2/100km in a standard car run by a reciprocating engine. Of course, even if you ignore the benefits of the reduced CO2 emissions, there is the obvious reduction of benzene, ozone & particulate emissions at the source-which is good for the health of pedestrians & bike-riders who have the share the road with car drivers. -
Marcus at 11:11 AM on 10 March 2011A Real-World Example of Carbon Pricing Benefits Outweighing Costs
Gilles, even an HEV has a lower CO2 footprint than a regular vehicle-a fact you seem utterly determined to ignore. If you use an HEV solely for the daily commute, then you probably won't even need to use the petrol-burning component-yet even if you do need to burn petrol, it will still be several times more efficient than in a reciprocating engine-which gets less than 20% thermal efficiency. Why don't you just come clean, Gilles, & admit that your dislike of HEV's & EV's is because you see them as a threat to your Oil Industry shares.Moderator Response: [DB] Please dial back the rhetoric a bit. Whether or not someone has, or hasn't, "oil industry shares" isn't germane to the topic of this post. Thanks! -
RickG at 11:10 AM on 10 March 2011Climate Emergency: Time to Slam on the Brakes
Fred, I think you are wrong about comparing temperatures of different areas of a plant to the planet. For measuring the average temperature of the planet, NASA/GISS uses a grid system consisting of some 8,000 grid boxes of which there are many measuring sites within each. Regions do vary greatly but that is what gives the global average. What happens in one region can affect another. But in your plant setting the average temperature of the building is not an issue as there are probably many areas with separate thermostats that are set and controlled specifically for those areas. They do not affect the rest of the plant. As for you reactor temperature that is very important to control. If it starts getting too high that is a serious problem. The Earth as well has critical temperatures that seriously affect the many environments. -
Riduna at 11:09 AM on 10 March 2011Climate Emergency: Time to Slam on the Brakes
There are times when I wonder if Gilles and Fred intend making a genuine contribution to the debate – in this case the need to limit atmospheric CO2 concentration to 350ppm by 2100 and how this might be done – or, in the tradition of the best denialists, simply make misleading, unsubstantiated, or untrue statements? If the latter, it seems so pointless, particularly on SkS. -
Tom Dayton at 11:03 AM on 10 March 2011Climate Emergency: Time to Slam on the Brakes
Also false, Fred, is your claim "The tabloids (and climate science) inform us of widespread catastrophes due to the 'New Glaciation.'" See the Argument "Ice age predicted in the 70s" about climate science predictions. What the tabloids published is entirely irrelevant. -
Tom Dayton at 10:52 AM on 10 March 2011Climate Emergency: Time to Slam on the Brakes
Fred Staples, you wrote: "1940 to 1977: Cooling period. The temperatures are cooler than currently. Mountain glaciers recede, and some begin to advance. The tabloids (and climate science) inform us of widespread catastrophes due to the 'New Glaciation'. The causes of this period of cooling are unknown." Your claim of unknown cause is false, as explained in the Argument "It cooled mid-century." -
Fred Staples at 10:44 AM on 10 March 2011Climate Emergency: Time to Slam on the Brakes
I will respond to all the comments, but I should first say something to muoncounter (55) so that he can sleep more soundly. I was writing about the measurement of ambient temperatures which related to working conditions, not core temperatures which related to nuclear safety. The problem was that, with relatively few measurement sites, and measurements which were neither continuous nor simultaneous, it was impossible to know the average temperature of the building. All that we could measure was trends at the measurement sites, and even these would be distorted by ventilation changes, doors opening and closing, etc. The parallels to global temperatures are obvious, which is why I made the point. However, think about the core temperatures, which are seriously important. We had (in my day) fixed points inside the core recording temperatures continuously. The maximum permitted core output depended on the average temperature, and the safety of the reactor depended on the highest temperature of an individual fuel element. Both these temperatures were strictly limited, but, by definition, not measured. Inevitably, we had to use a combination of statistics, probability, and sound theory backed up by laboratory based measurements. I hope that helps, but I am not sure that it will.Moderator Response: Respond to each point on the appropriate thread as the responders have pointed you to. A general thread such as this one is okay for starting conversations, but getting into more detail must be done on more relevantly narrow threads. Feel free to post comments here, simply linking to your responses on the relevant, narrow threads. -
Gilles at 10:34 AM on 10 March 2011It's too hard
Muoncounter : if you really think that the influence of fossil fuel consumption on the standard of living is less obvious than that of the average temperature, I'm afraid I can't argue further with you. We are obviously not living on the same planet. -
Albatross at 09:44 AM on 10 March 2011Climate Emergency: Time to Slam on the Brakes
Fred says @70, "Since the UAH data shows no warming of the mid-troposhere since 1979 (the only significant warming period) this data alone would be sufficient to destroy the CO2 theory." SkS Readers, this statement is demonstrably false. Consider these data from RSS derived from satellites for the mid troposphere (TMT): Also, consider these data from the GUAN:
 From NCDC:
"[radiosonde] Data collected and averaged between the 850–300 mb levels (approximately 5,000 to 30,000 feet above the surface) indicate that 1958–2010 global temperature trends in the middle troposphere are similar to trends in surface temperature; 0.13°C/decade (0.23°F/decade) for surface and 0.16°C/decade (0.29°F/decade) for mid-troposphere. Since 1976, mid-troposphere temperatures have increased at a rate of 0.18°C/decade (0.32°F/decade). For 2010, global mid-troposphere temperatures were 0.78°C (1.40°F) above the 1971–2000 mean—the warmest on record."
From NCDC:
"[radiosonde] Data collected and averaged between the 850–300 mb levels (approximately 5,000 to 30,000 feet above the surface) indicate that 1958–2010 global temperature trends in the middle troposphere are similar to trends in surface temperature; 0.13°C/decade (0.23°F/decade) for surface and 0.16°C/decade (0.29°F/decade) for mid-troposphere. Since 1976, mid-troposphere temperatures have increased at a rate of 0.18°C/decade (0.32°F/decade). For 2010, global mid-troposphere temperatures were 0.78°C (1.40°F) above the 1971–2000 mean—the warmest on record."
-
Rob Honeycutt at 09:43 AM on 10 March 2011Climate Emergency: Time to Slam on the Brakes
Fred @ 70... Wow. You've cataloged quite a body of misinformation there. I take note that none of what you've stated is substantiated by research. One thing I always appreciate here at SkS is the fact that everyone (most) people link to actual peer reviewed literature to back up what they say. Anything less is hand waving. -
Tom Dayton at 09:40 AM on 10 March 2011Climate Emergency: Time to Slam on the Brakes
Fred Staples, you wrote: "1880 to 1940: A period of warming. The mountain glaciers recede and the ice in the Arctic Ocean begins to melt again. The causes of this period of warming are unknown." Your claim of unknown cause is false, as explained in the Argument "It warmed before 1940 when CO2 was low." -
RickG at 09:39 AM on 10 March 2011Climate Emergency: Time to Slam on the Brakes
Fred: The association with rising CO2 since 1977 might, of course, be a classic case of the correlation-causation statistical fallacy: A is happening, B is happening, therefore A causes B. Except the physics of CO2 is well known and tested. Joseph Fourier demonstrated the greenhouse effect in 1827. John Tyndall discovered that CO2, water vapor and NH4 were greenhouse gases while O2 and N2 were not in 1858. Svante Arrhenius calculated that doubling CO2 would warm the Earth by 4-6 deg C in 1896. The over whelming majority of climate scientists today agree that a doubling of CO2 will cause a warming of about 3 to 3.5 deg. C. I think your correlation-causation statistical fallacy is wishful thinking on your part. -
Climate Emergency: Time to Slam on the Brakes
A follow-up on my previous post - global temperature decrease in the year with out summer was 0.4-0.7°C, with rather larger local effects in the NorthEastern US and Northern Europe. Again, compare this one or two year event - that trashed agriculture in the Northern Hemisphere - with a 2°C rise that persists for centuries. And then try to convince anyone that it's not going to be a problem for us... -
Climate Emergency: Time to Slam on the Brakes
Fred Staples - "1816 is known as the "year with no summer". Snow falls in New England in June. The widespread failure of crops and deaths due to hypothermia are common. The causes of this period of cooling are unknown." (Emphasis added) That would be, to put it mildly, incorrect. There was a combination of a serious low in solar activity tied with multiple high end volcanic eruptions, including Mount Tambora in 1815, which injected volcanic dust into the stratosphere (aerosol forcing). Note the Northern European temperatures, relative to 1971-2000: This was a severe event, but limited to about a years duration, with temperature changes of about -3C in the worst areas. Makes you wonder what +2C temperatures persisting for decades or centuries will do to us, eh?
As to the rest of your post - I suggest you look at (and comment upon) the tropospheric hot spot thread. Your claims on that topic are not supported. As to CO2 and your claims that it doesn't cause warming, I suggest you look at one of the (many) CO2 threads and comment appropriately.
This was a severe event, but limited to about a years duration, with temperature changes of about -3C in the worst areas. Makes you wonder what +2C temperatures persisting for decades or centuries will do to us, eh?
As to the rest of your post - I suggest you look at (and comment upon) the tropospheric hot spot thread. Your claims on that topic are not supported. As to CO2 and your claims that it doesn't cause warming, I suggest you look at one of the (many) CO2 threads and comment appropriately.
-
scaddenp at 09:25 AM on 10 March 2011The Climate Show Episode 8: Kevin Trenberth
That does not mean CO2 forcing doesn't exist, just that we cannot measure it. Pardon? For a CO2 forcing, you certainly can - but you have to look at the spectral data. See the papers at There's no empirical evidence. As to average OLR - that's interesting enough to ask the modellers, but as Huang and Ramanswamy show, there is not a straightforward relationship expected by the models. As to albedo - come on. We know albedo within limits of uncertainty and how variation in albedo operates in W/m2 as forcing is covered in IPCC report. These argument sound like excuses for no action rather a response to the science. -
Fred Staples at 09:10 AM on 10 March 2011Climate Emergency: Time to Slam on the Brakes
The temperature record may not be accurate, but it is not necessarily rubbish, moderator, 49. The following is a fair summary of recent global temperatures. 4,000 years ago to AD 900: Global cooling begins. The Arctic Ocean freezes over, mountain glaciers form once more in the Rocky Mountains, in Norway and in the Alps. The Black Sea freezes over several times, and ice forms on the Nile in Egypt. Northern Europe gets a lot wetter, and the marshes develop again in previously dry areas. The sea level drops to approximately its present level. The temperatures on the surface of the Earth are about 0.5-1 degree cooler than at present. The causes of this period of cooling are unknown. AD 1000 to 1500: This period has quick, but uneven, warming of the climate of the Northern Hemisphere. The North Atlantic becomes ice-free and Norse exploration as far as North America takes place. The Norse colonies in Greenland even export crop surpluses to Scandinavia. Wine grapes grow in southern Britain. The temperatures are from 3-8 degrees warmer than currently. The period lasts only a brief 500 years. By the year 1500, it has vanished. The Earth experiences as much warming between the 11th and the 13th century as is now predicted by global-warming scientists for the next century. The causes of this period of warming are unknown. 1430 to 1880: This is a period of the fast but uneven cooling of Northern Hemisphere climates. Norwegian glaciers advance to their most distant extension in post-glacial times. The northern forests disappear, to be replaced with tundra. Severe winters characterize a lot of Europe and North America. The channels and rivers get colder, the snows get heavy, and the summers cool and short. The temperatures on the surface of the world are about 0.5-1.5 degrees cooler than present. In the United States, 1816 is known as the "year with no summer". Snow falls in New England in June. The widespread failure of crops and deaths due to hypothermia are common. The causes of this period of cooling are unknown. 1880 to 1940: A period of warming. The mountain glaciers recede and the ice in the Arctic Ocean begins to melt again. The causes of this period of warming are unknown. 1940 to 1977: Cooling period. The temperatures are cooler than currently. Mountain glaciers recede, and some begin to advance. The tabloids (and climate science) inform us of widespread catastrophes due to the "New Glaciation". The causes of this period of cooling are unknown. 1977 to present: Warming period. The summer of 2003 is said to be the warmest one since the Middle Ages. The tabloids (and this blog) notify us of widespread catastrophes due to "global warming". The causes of warming are discovered - humanity and its carbon-dioxide-generating fossil-fuel use and deforestation. We can say with certainty that CO2 could have had nothing to do with any of these episodes, except, perhaps, the last. The association with rising CO2 since 1977 might, of course, be a classic case of the correlation-causation statistical fallacy: A is happening, B is happening, therefore A causes B. You extend the fallacy by suggesting that if C, D, E and F are also happening, these are also caused by A if we cannot provide an alternative explanation. Einstein said, quite rightly, that "10,000 observations could confirm a theory, it only takes one to refute it." At RC you will find that the crucial "fingerprint" of AGW is the simultaneous warming of the troposphere and cooling of the stratosphere. Since the UAH data shows no warming of the mid-troposhere since 1979 (the only significant warming period) this data alone would be sufficient to destroy the CO2 theory. Gavin Schmidts (of RC fame) response to me on this point is interesting: [Response: The MT (mid-troposhere) data has a very significant contribution from the stratosphere (which is cooling) and so is not expected to be rising very substantially. This is the whole reason why MSU-LT and the Fu and Johnson approaches were developed. - gavin] So, assuming that the UAH luminaries have not understood this argument, and are consequently publishing misleading data, is the stratosphere really cooling?. You can see the data in the Hadley centre radio-sonde records for the lower stratosphere. From 1958 to 1974 there was a fall of 1.0 degree centigrade, with a major volcanic eruption in 1964. Thereafter there are three distinct periods of level temperatures separated by the two volcanic eruptions marked on the chart. From 1974 to 1983, the beginning of the troposheric warming period, stratosheric temeratures did not fall. The El Chicon eruption was accomapnied by a step fall of about half a degree. Temperatures did not fall again until 1993, when a further drop of half a degree accompanied the Pintaubo eruption. Thereafte the temperatures have remained constant for 17 years. The overall fall from 1974 was (from the Hadley charts), about 1 degree, but in the years immediately following the volcanic eruptions temperatures rose by about 1 degree. It is a very big stretch to suggest that these step-wise stratospheric coolings (accompanied, as they are, by a reduction in ozone) explain the absence of warming in the troposhere. Nevertheless, it is on that stretch that AGW theory depends. As to "why isn't the rising CO2 having any effect", we would first have to ask why it should, which is where the burden of proof must lie. I have collected six different explanations from RC, of which only one is even plausible. We could perhaps discuss these in another post. -
RickG at 08:38 AM on 10 March 2011Examining Hansen's prediction about the West Side Highway
JR, I think its pretty well understood when climatologists talk about a doubling of CO2 they are referencing a doubling of the pre-industrial amount of 280 to 560. -
Jesús Rosino at 08:25 AM on 10 March 2011Examining Hansen's prediction about the West Side Highway
According to the quotes above, they just said "with doubled CO2" or "assuming CO2 doubled in amount". They didn't say "from pre-industrial levels". Thus it could be even taken as doubling from 1988 levels. -
Albatross at 07:58 AM on 10 March 2011Climate Emergency: Time to Slam on the Brakes
Regarding model predictions, I think this is what the "skeptics" is trying to distract people from: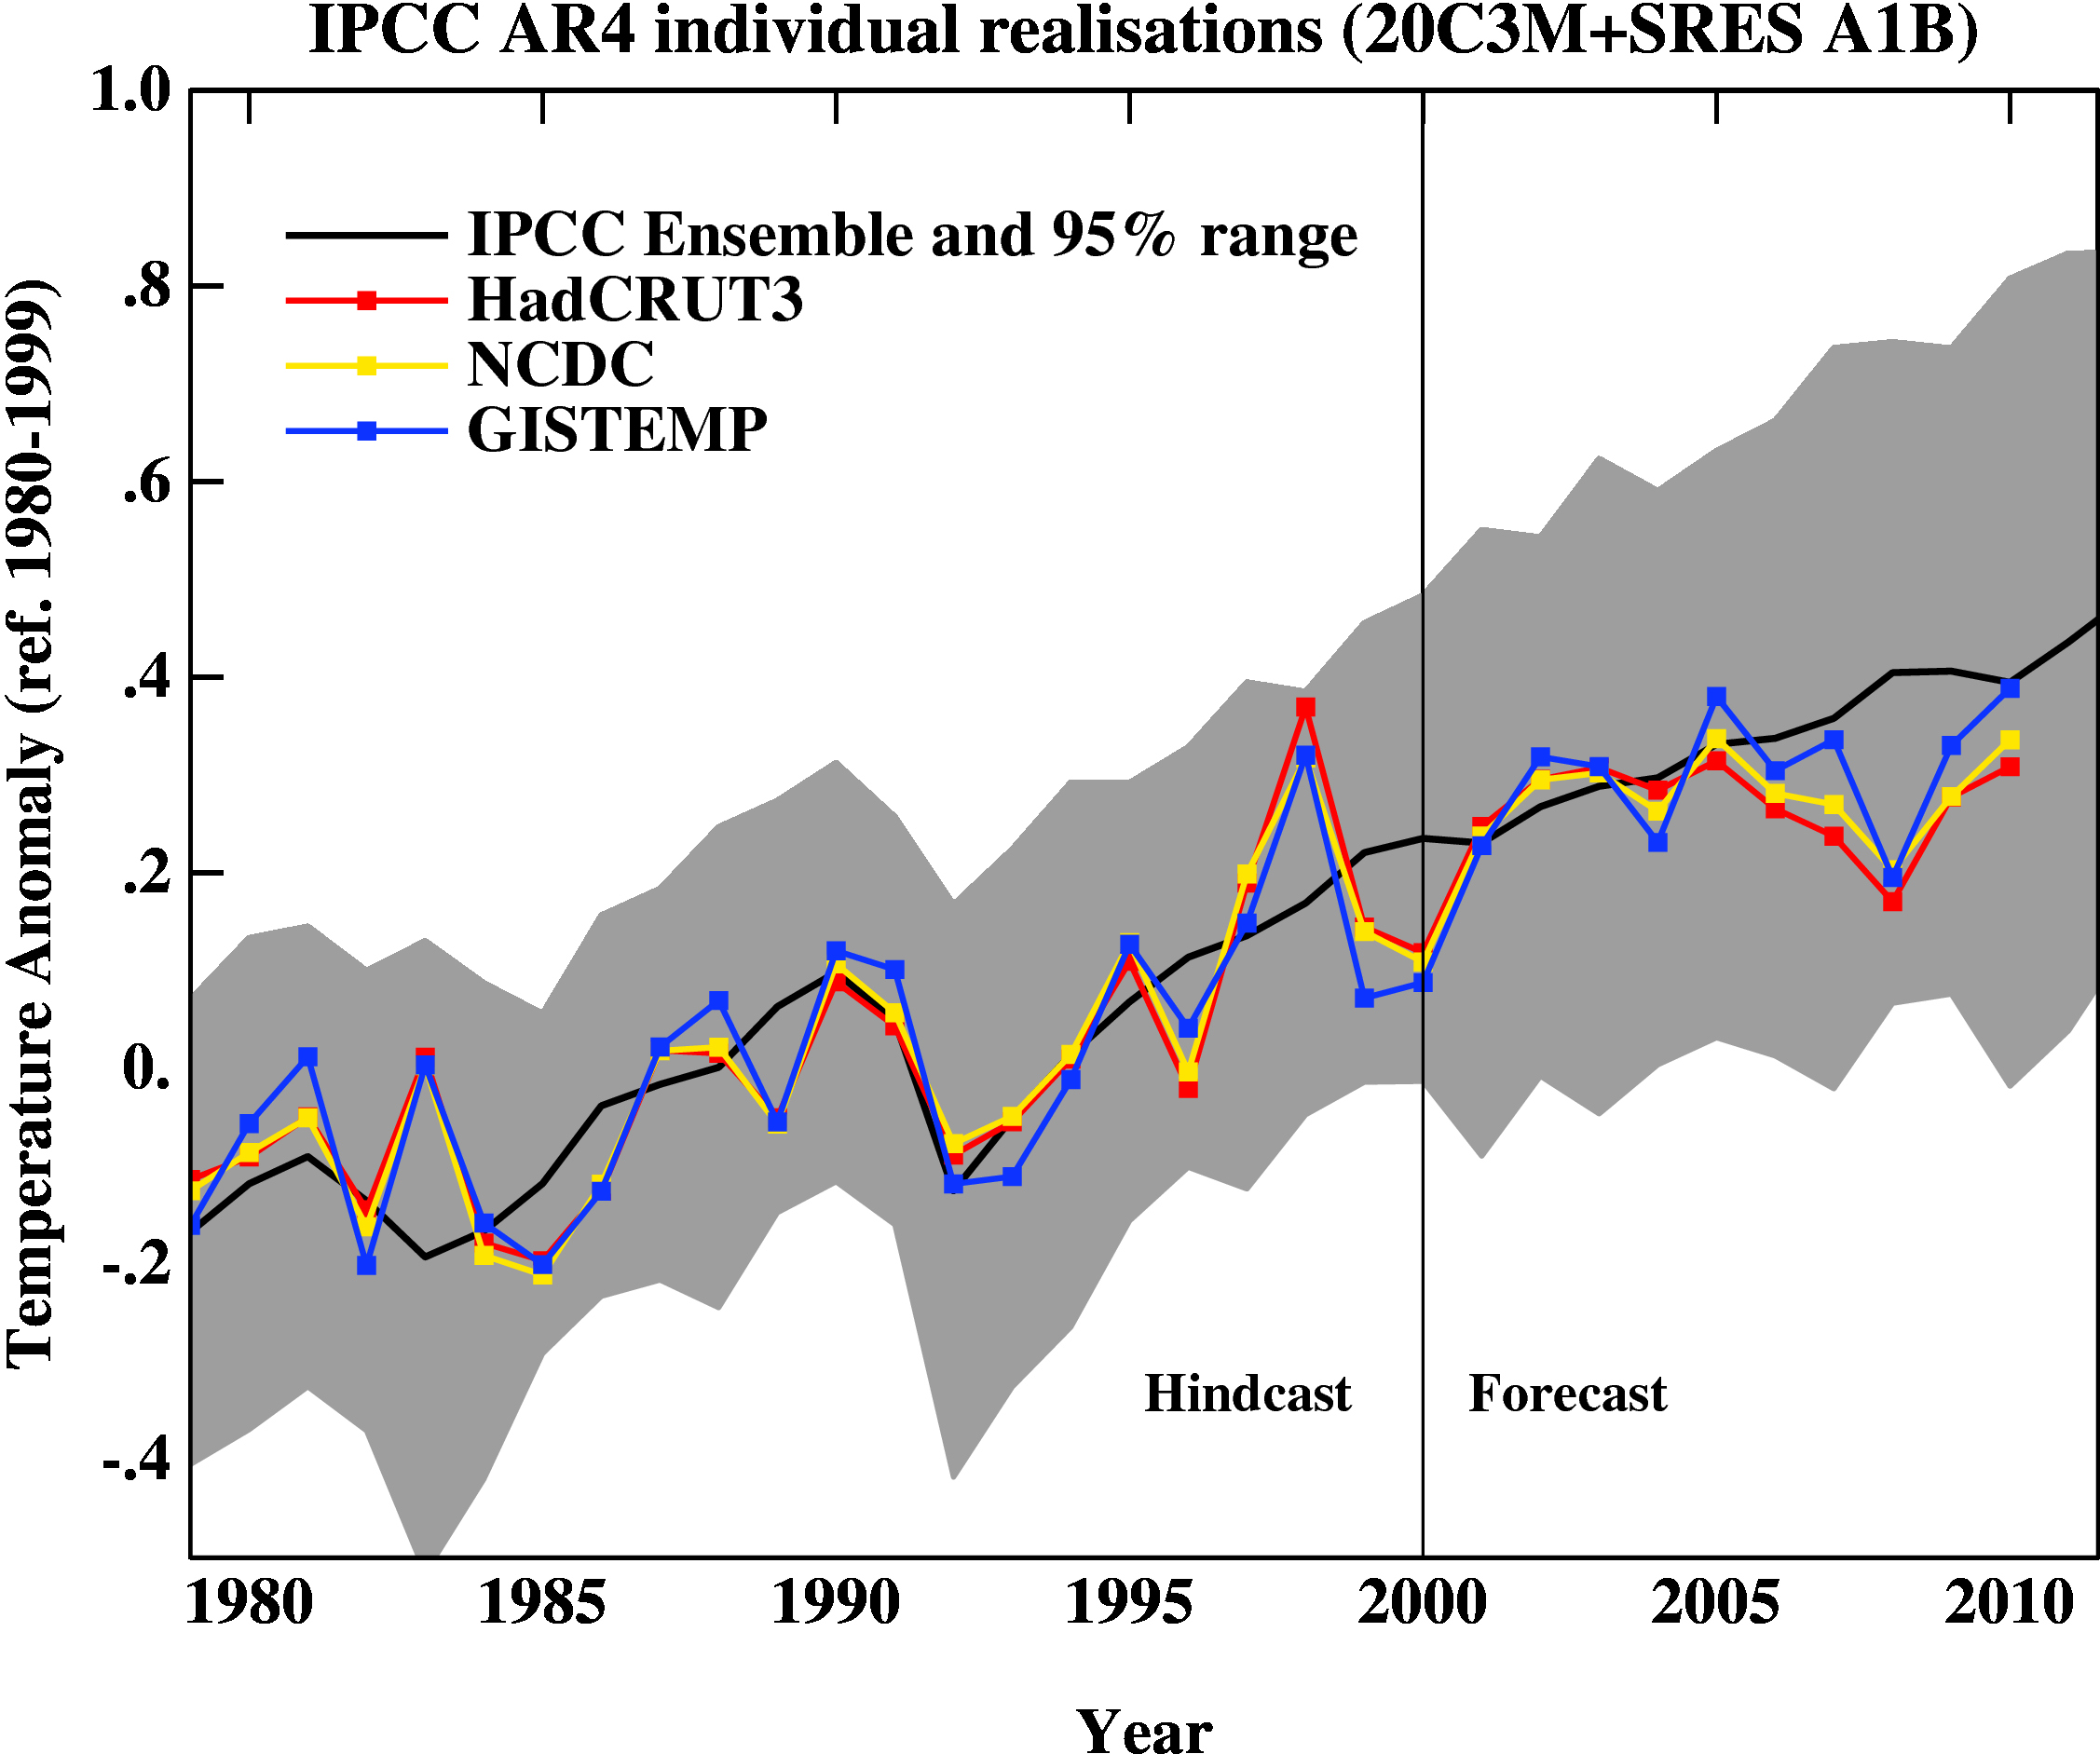 [Source here]
Time to start applying the breaks.
[Source here]
Time to start applying the breaks.
-
chrisd3 at 07:50 AM on 10 March 2011Examining Hansen's prediction about the West Side Highway
@NewYorkJ #6: I'm not sure how prone this particular highway is to flooding. Didn't Hansen's conversation in 1988 precede a major reconstruction of the West Side Highway? I had heard that at least part of the reason for this was that it was flood-prone. But I haven't lived in NY since the 60s, so maybe I heard wrong. -
chrisd3 at 07:46 AM on 10 March 2011Examining Hansen's prediction about the West Side Highway
Don't we have to wait 40 years after a doubling of CO2? -
Phila at 07:42 AM on 10 March 2011Examining Hansen's prediction about the West Side Highway
One climate myth found on the internet, propagated by Anthony Watts Is there a climate myth found on the Internet that isn't propagated by Anthony Watts?
Prev 1853 1854 1855 1856 1857 1858 1859 1860 1861 1862 1863 1864 1865 1866 1867 1868 Next


