


 Arguments


Recent Comments
Prev 1856 1857 1858 1859 1860 1861 1862 1863 1864 1865 1866 1867 1868 1869 1870 1871 Next
Comments 93151 to 93200:
-
Rovinpiper at 06:23 AM on 9 March 2011Renewables can't provide baseload power
Is there a thread that discusses the potential for systems that are already well-established to be a part of a carbon-neutral power grid. Examples would be nuclear power fossil fuels with Carbon Capture and Sequestration? -
hank at 06:19 AM on 9 March 2011Climate sensitivity is low
oh, and on the first link -- I point it out as one that needs to be looked at carefully on the question of climate sensitivity. The 'discussion' page is going to be very attractive to self-identified skeptics; it may be in the same ballpark as Spencer's "yes Virginia" or Curry's "Sky Dragon" attempts to explain the basic science in a way that will draw in people who don't want to believe there could be a problem. It may be well presented stuff with a denier core -- hard to say without reading every bit: http://www.barrettbellamyclimate.com/page46.htm But this doesn't look good (sigh) they're "Teaching the Controversy" (TM Doonesbury) on ocean pH, leaving out the rates of change and the observed results so far: http://www.barrettbellamyclimate.com/page50.htm -
Paul Magnus at 06:16 AM on 9 March 2011Climate Emergency: Time to Slam on the Brakes
Alan @ 8, I am afraid your interpretation is probably right. As a civilization we are basically toast. Add in peak oil for sting in the wound. We are in the beginning of a ME event right now and the biosphere is going to take a hit for a long time also. Ocean acidification is going to be nasty too, and theres not much we can do about that now. Its basically 'the end of the world' . Its a reset. We have to keep fighting for the best path through this though. Its all about survival. -
mspelto at 06:15 AM on 9 March 2011Crux of a Core, Part 2 - Addressing Dr. Bob Carter
To be a participating scientist in the advancement of our collective science knowledge one is constantly accountable for being accurate in referencing other scientists, peer reviewing others research, and in the the reporting of your own research. If one is not then they will not be part of the enterprise of advancing science in the long term and their career as a scientist will be limited. If one's career diverges from being a scientist than you may prosper as a former scientist, by not acting as accountable to science. -
arch stanton at 06:12 AM on 9 March 2011Crux of a Core, Part 2 - Addressing Dr. Bob Carter
So…Besides representing data in a misleading way, it would appear that Carter has lost the ability to make a proper citation; something that (hopefully) was a (minimal) equirement of his earning his doctorate... -
Albatross at 06:12 AM on 9 March 2011Crux of a Core, Part 2 - Addressing Dr. Bob Carter
Rob, Nice work. Do not sell yourself short. Also, you are in excellent company and on the side of science, not ideology. That matters. -
Bibliovermis at 06:05 AM on 9 March 2011Climate Emergency: Time to Slam on the Brakes
Do you realize the fallacy of using a regional temperature to counter the global temperature average? if the temperature record had not increased relatively sharply after the 19seventies, no-one would have taken AGW seriously. True. If [physical effect] didn't occur, no would take [scientific theory describing effect] seriously. How is that tautology relevant? -
Geo77 at 05:59 AM on 9 March 2011Climate Emergency: Time to Slam on the Brakes
It's puzzling that discussions of burning our fossil fuels don't seem to consider a time period going out beyond a couple of centuries. But then given a culture that is captivated by quarterly reports, annual earnings and that can't seem to plan more than a couple of years into the future I suppose that's not too surprising. Unless we see homo sapiens as a flash in the pan, doomed to go down in flames in the next couple thousand years - then the question arises what's our strategy once we start creeping back into an ice age? At that point wouldn't it be helpful to have fossil fuels to burn in a controlled manner to try to cancel out the cooling effects that are coming? If we're concerned about humanity's ultimate future shouldn't we be saving/stockpiling those fossil fuels for the many generations to come who could use them much more beneficially? So aside from the fact that reducing fossil fuel usage through alternative energy production is: 1) economically beneficial (an economy dependent on a depleting energy source is a doomed economy as prices eventually skyrocket with increased demand and reduced supply) and 2)the most reasonable way to mitigate the potentially disasterous effects of AGW - it also makes sense in the long, long run if we're really concerned with the future of our species. But then our track record for thinking rationally about our future is nothing short of abysmal.Moderator Response: (DB) On the bright side, we've probably skipped the next ice age en toto; BAU for another 20-30 years and we skip the next 5. -
ClimateWatcher at 05:40 AM on 9 March 2011The Climate Show Episode 8: Kevin Trenberth
#16. Trenberth meant that it's a travesty that we can't adequately track the heat energy in the climate system. Right. That means we cannot ascribe the observed warming to anything because the current budget cannot account for where the energy is going. Difference between 1997 and 2009? How about 12 additional years of intensive research. Science advances to create better understanding. Unfortunately, the numbers from '09 are significantly different from numbers in IPCC scenarios and a host of other published papers. Do you understand what he's saying about "turning around the null hypothesis?" He means it is clearly shown by the research that we are warming the planet. The evidence is overwhelming. No. AGW theory postulates that output will decline until surface warming boosts output back to match input. We don't know the input. We don't know the output. Therefore, we don't know if the theory is correct. -
logicman at 05:38 AM on 9 March 2011Icing the Medieval Warm Period
Re: my comment #78 - html link fixed, thanks. The profile needs a no tags url, unlike the comments pages. By putting in tags, I seem to have provoked your site's software into adding a no-follow. -
Fred Staples at 05:36 AM on 9 March 2011Climate Emergency: Time to Slam on the Brakes
Why, Bibliovermis, 38? Because it is a long, reasonably self-consistent record. It demonstrates the essential point about AGW very clearly. Which is that, if the temperature record had not increased relatively sharply after the 19seventies, no-one would have taken AGW seriously. You can see the same effect in all the other long-run records. HardCru3, quotes global temperatures over 161 years from 1850 - the period when the globe emerged from the Little Ice Age. The warming trend overall is just 0.45 degrees C per century, with 95% confidence limits between 0.4 and 0.5 degrees C. Most of that warming has appeared in the last 35 years (1.7 degrees per century). From 1850 to 1975 the trend was a very modest 0.25 degrees C per century, with 95% confidence limits between 0.19 and 0.3 degrees per century. Most of the explanations of AGW (and there are many) are not even plausible, but it is difficult to persuade non-physicists of that fact. It it easier to demonstrate that, if the AGW effect exists, it waited until the Western industrial revolution was over before making an appearance. -
ClimateWatcher at 05:17 AM on 9 March 2011The Climate Show Episode 8: Kevin Trenberth
#18 Alexandre, the errors of measurement ( as reflected by the range of published values ) of outgoing longwave and alebdo are each greater than the ~3W/m^2 modeled for CO2 doubling. The uncertainty of one quarter of Solar radiance is less but still large 1 W/m^2. Trenberth knows this - it is the travesty and it is borne out by his '97 and '09 papers which vary greatly, much more greatly than the 0.9 W/m^2 imbalance proclaimed by the '09 paper. CO2 should be causing a forcing, but we don't know this from observation because the measurements lack both the precision and accuracy. At its core, AGW theory is that outgoing IR will be reduced until the earth heats up and again balances output with input. But our measurements don't even reflect this. The outgoing longwave actually shows an increasing trend: Undoubtedly there are problems with the measurements ( all the NOAA satellite data series strung together with orbital issues, etc. ) But that's what the measurements indicate.
Greater problems exist with albedo. Particularly since albedo has directional components and variation. Ranges of about 8W/m^2 exist in published estimations of what albedo is today and no one knows how albedo may have varied over the past.
CO2 should cause warming, but we do not know this from observation of the energy balance.
Undoubtedly there are problems with the measurements ( all the NOAA satellite data series strung together with orbital issues, etc. ) But that's what the measurements indicate.
Greater problems exist with albedo. Particularly since albedo has directional components and variation. Ranges of about 8W/m^2 exist in published estimations of what albedo is today and no one knows how albedo may have varied over the past.
CO2 should cause warming, but we do not know this from observation of the energy balance.
-
RickG at 05:14 AM on 9 March 2011Climate Emergency: Time to Slam on the Brakes
Just got through watching the "House Climate Science Committee". I am deeply saddened. -
garythompson at 05:12 AM on 9 March 2011Climate Emergency: Time to Slam on the Brakes
Thanks muoncounter in #33 for the reply. Even when looking at yearly averages instead of monthly averages I still see the period of 'flatness' in the last 11 years and the graph is shown below. I think the reason for this is the heat buildup in the oceans as this post alludes to so my point in posting this comment was to poll the team here and find out when this heat is going to be released.
-
Bibliovermis at 05:01 AM on 9 March 2011Climate Emergency: Time to Slam on the Brakes
Fred (#28), Why are you using Central England temperatures to counter global temperatures? Globally, 2010 tied with 2005 as the warmest year on record; 1880 to present. December 2010 was the coolest since 2000 and 1982 & 1994 for 17th warmest on record. State of the Climate | Global Analysis | Annual 2010 -
Rob Honeycutt at 04:16 AM on 9 March 2011A Real-World Example of Carbon Pricing Benefits Outweighing Costs
Gilles #96... If you kept up with this topic (electric cars) you'd understand that pretty much every car company is developing an electric right now. Nissan and Chevy are out in front with the launch of their first new generation EV's. Nissan sold out their entire first year of production in very short order. Tesla has now teamed up with Toyota to reopen the NUMMI plant in Fremont CA to produce their luxury EV. Freaking sweet car! 300 mile range. 0-60 in under 6 secs. Mini has an electric in the works.
Smart has an electric in the work...
The list is growing very very quickly.
Mini has an electric in the works.
Smart has an electric in the work...
The list is growing very very quickly.
-
ranyl at 04:12 AM on 9 March 2011Climate Emergency: Time to Slam on the Brakes
"Here we quantify the median γ as 7.7 p.p.m.v. CO2 per °C warming, with a likely range of 1.7–21.4 p.p.m.v. CO2 per °C." http://www.nature.com/nature/journal/v463/n7280/full/nature08769.html Arkadiusz Semczyszak From the paper you quoted and therefore my “... that some models suggest that the CO2 that gone into the sinks will be released and there is of course the climate warming CO2 feedback with gives out about 10-20ppm per 1C”; is as per that very same paper although it should have been 5-20ppm as their are very skewed. More from the paper, they constructed a temeprature ensemble of ensembles and found; "The warmest pre-anthropogenic period (1071–1100) was 0.38 uC warmer than 1601–1630, suggesting that recent anthropogenic influences have widened the last-millennium multi-decadal temperature range by ,75% and that late twentieth century warmth exceeds peak temperatures over the past millennium by 0.31 uC." The 80% comment needs to be read carefully as it is saying that as the CO2 rise per 1C is less by at least half and this reduces the amplifiaction of temperature rise due to this feedback by 80% less not that CS is any less at all just not due to CO2 release feedback and 80% seems high as previous CO2 per K feedback estimates were 40ppm. http://www.sciencemag.org/content/321/5896/1642.full#F1 So the 80% isn't is that climate sensitivity to a rise in CO2 is less in any way, just not to accelerating CO2 atmospheric concentrating. In Pliocene temepratures were 3-5C hotter compared to pre-industrial and CO2 was about 350-400ppm, which is a CO2 release/ storage of about 14-40ppm, which is probaly about right considering the values in the papers and the skewed graph in Frank's paper meaning higher CO2 per 1C are more possible. So the Frank paper wasn't looking at CS for temperature it was looking at how sensitive the world is at releasing CO2 per 1C rise in temprature which is a very different thing. It also taken in a time period when temepratures were colder than now and the possibility of large releases of CO2 from frozen ground and sea floor were a lot less. With CO2e hoovering at 450-60ppm (0.7 of a doubling) aren't you just a little concerned that 2C is a distinct possibility even if all CO2 emissions stopped today? -
dana1981 at 03:47 AM on 9 March 2011A Real-World Example of Carbon Pricing Benefits Outweighing Costs
daisym #92:"Wind, solar, etc. won’t do the job."
Sorry, this is wrong. As the moderator noted, please see the rebuttal to the myth Renewables can’t provide baseload power (which coincidentally, I also wrote)."If as you say, California rates have increased as per capita consumption has decreased, you and I implicitly agree on these very dynamics"
Only one problem - that's not what I said. What I said was that California per capita consumption has remained flat while the rest of the country's has increased, yet our rates are not significantly higher than the national average."Let’s not forget that Californians are not paying the full cost for renewable energy, thanks to massive Federal subsidies."
As muoncounter noted in #93, every energy source in the USA gets federal subsidies, including oil and coal."I still insist that the “threat to humanity” is an overblown alarmist cry."
Insist all you want. As muoncounter also noted, insistance without evidence isn't worth much. I suggest you peruse this site to learn about the scientific evidence that global warming is a major threat. It's a great resource. Gilles #96:"You may imagine that electric cars could replace it, but they don't develop"
I'm not sure what you're trying to say here. Electric cars are already being developed, even by major car companies (see the Nissan Leaf and Chevy Volt, for example). I already own an electric motorcycle. You're saying that something which exists doesn't exist. There's a word for that. It starts with the letter "D"."BTW , the electricity is mainly made from fossil fuels in the world, so even electric cars wouldn't change the CO2 production"
This statement is totally wrong. -
michael sweet at 03:45 AM on 9 March 2011A Real-World Example of Carbon Pricing Benefits Outweighing Costs
GC, Hansen has proposed tax and dividend to get around your proposal for allowing bureacrats to spend all the money. If we dividend all the carbon tax to the people they can spend it on anything they wamt to. Why are you so insistant that we should give it all to bureacrats? Skeptics like you are against anything and do not care what has actually been proposed. find out what has been proposed before you are against it.Moderator Response: [DB] GC's comment was again deleted due to repeated violations of the comments policy. If you recognize comments containing obvious violations, keep in mind that replies to comments getting deleted are normally deleted also. DNFtT. -
JMurphy at 03:39 AM on 9 March 2011Climate Emergency: Time to Slam on the Brakes
For those 'worrying' about India and China - don't : they are well ahead of you and actually doing things while you 'worry' about them : Renewable Energy in China, India To Hit $53.0 Billion, $14.4 Billion Respectively by 2016 The report ‘Renewable Energy Investment in China, India and Brazil’ concludes with a viewpoint on why there is no end to investment in the renewable energy market. India has a flourishing nuclear power program and plans to have 20,000 MWe of nuclear capacity on line by 2020. China has electricity demand growing at 20% per year and a rapidly-expanding nuclear power program. Nuclear capacity of at least 40,000 MWe is planned by 2020. India is already self-sufficient in reactor design and construction and China has become so for second-generation units, but is importing Generation-3 plants. India's uranium resources are limited, so it is focusing on developing the thorium fuel cycle to utilise its extensive reserves of thorium. China's uranium resources are modest and it is starting to rely on imported uranium. -
JMurphy at 03:31 AM on 9 March 2011Climate Emergency: Time to Slam on the Brakes
Harry Seaward wrote : "Until (read when and if) solar, wind, wave, or other forms of "clean" energy become reliable and readily available, fossil fuels are going to rule the roost." I can almost hear a voice from the 19th Century proclaiming : "Until (read when and if) oil becomes reliable and readily available, coal is going to rule the roost." And, before that : "Until (read when and if) coal becomes reliable and readily available, horse-power is going to rule the roost." See how things can change, given enough backing ? Fred Staples wrote : "But if annual temperatures fall back from an average of 10.36 in the decade ending 2009 to the 9.54 average in the decade ending 1979, the AGW alarm will fall silent. Last year the average temperature was 8.83 degrees C, the 90th coldest year in the record, exactly the same as the temperature in the first year of the record, 1659. December, 2010, was the second coldest December." If, if, if. Does that mean anything, when the year so far (Jan and Feb) is showing a higher average anomaly than last year ? Do you believe the anomalies are going to continue to show negative, or are going to be all less than last year ? And why would you think that this decade is going to fall back to the levels seen in the 70s, when every decade since has been higher than the previous ? What are you expecting to cause those cool temperatures ? Will you fall silent if it doesn't ? Also, what do you think you can prove from single years, or even months ? -
Gilles at 03:10 AM on 9 March 2011Climate Emergency: Time to Slam on the Brakes
32 Actually thoughtful : again, you should explain that carefully to chinese and indian people. They don't seem to get it. -
muoncounter at 03:05 AM on 9 March 2011Climate Emergency: Time to Slam on the Brakes
garyt, CO2 has an annual cycle, so your monthly graph is drowning in this noise. The graph in question should be one of annual temperature and average annual CO2: -- from Grumbine, March 2009
And that's well before 2010 was tied for the hottest year on record, with CO2 in the high 380s. But whatever, its just a correlation and we all know that doesn't mean much these days.
-- from Grumbine, March 2009
And that's well before 2010 was tied for the hottest year on record, with CO2 in the high 380s. But whatever, its just a correlation and we all know that doesn't mean much these days.
-
actually thoughtful at 02:55 AM on 9 March 2011A Real-World Example of Carbon Pricing Benefits Outweighing Costs
Gilles, How about the introduction of agriculture into our civilization. Care to comment on the relationship between that development and temperature? I think your final paragraph goes miles past what the science shows us. -
actually thoughtful at 02:50 AM on 9 March 2011Climate Emergency: Time to Slam on the Brakes
Gilles at 6 - regarding your differential equation - you are assuming dC is based on cheap fossil fuel. You are incorrect. It is based on cheap energy. And fossil fuels, after you factor in global warming and other pollutions (asthma, the ravages of extraction, particulate matter from burning, etc.) are the most expensive fuels we have. Given renewables are, in reality, cheaper, you don't actually have an argument. -
Kevin C at 02:35 AM on 9 March 2011Roy Spencer’s Great Blunder, Part 3
Now that Arthur has shown us that the relationship between Spencer's forcing term (for which he uses the PDO) and his temperature series is a convolution, we can go the other way and predict what forcing would be required to produce a given temperature series, using a method called deconvolution. There is a slight difficulty in the deconvolution can be a bit unstable, however if we stick to reconstructing a smoothed temperature series rather than trying to fit every annual variation, then it is fairly easy. So here is the HADCRUT2v data back to 1856, supplemented by the CRUTEMP2v data back to 1781. I used the smoothed data from here. I've predicted Spencer's forcing required to fit the data, and then re-run it through Arthur's version of Spencer's model to produce the temperature series. Here's the result: What forcing is required to produce this temperature series? Here is the forcing, compared to the actual PDO (11 year smooth) over the last century:
 There are a few interesting features: The match in the mid 20thC is reasonable as you would expect. A much higher forcing is required to reproduce all of the steep rise after 1970.
More interesting is the beginning of the 20thC. We see the strong and prolonged negative PDO up to 1900 required to produce the cooler temperatures of the late 19th and early 20th century. Not only is this an exceptionally deep PDO (unlike anything in the measured period), it also bears no relation to the measured data from 1900 to 1920.
Going back further to pre-1950 we see wild fluctuations in the smoothed PDO, to produce the sharp changes in the instrumental temperature record. However the record back then is based on only a few stations, so these ripples may not be genuine.
There are a few interesting features: The match in the mid 20thC is reasonable as you would expect. A much higher forcing is required to reproduce all of the steep rise after 1970.
More interesting is the beginning of the 20thC. We see the strong and prolonged negative PDO up to 1900 required to produce the cooler temperatures of the late 19th and early 20th century. Not only is this an exceptionally deep PDO (unlike anything in the measured period), it also bears no relation to the measured data from 1900 to 1920.
Going back further to pre-1950 we see wild fluctuations in the smoothed PDO, to produce the sharp changes in the instrumental temperature record. However the record back then is based on only a few stations, so these ripples may not be genuine.
-
newcrusader at 02:34 AM on 9 March 2011Climate Emergency: Time to Slam on the Brakes
Hansen feels that by 2100- 5 meters is a reasonable number. -
Yvan Dutil at 02:33 AM on 9 March 2011Climate Emergency: Time to Slam on the Brakes
I dont know were you take your data but those are certainly not global.Moderator Response: Hansen et al accounted for their data not being global by multiplying by the probable ratio. They assumed temperature changes in ice core data were twice the global average. They assumed changes in deep ocean temperature were two-thirds the global average in the late Cenozoic, and allowed for the possibility that it was higher in the early Cenozoic. - James -
muoncounter at 02:29 AM on 9 March 2011A Real-World Example of Carbon Pricing Benefits Outweighing Costs
Gilles, "You may imagine that electric cars could replace it, but they don't develop even if the barrel hit 150 $" As usual, you've offered an authoritative-sounding opinion without evidence to back it up. In this case, there is evidence to the contrary from Scott et al 2007: ... analysis of purchasing decisions shows that at existing average residential electricity rates and over a range of gasoline prices, prospective vehicle purchasers could afford to pay a premium of up to a few thousand dollars over the cost of either a standard 27.5-mpg and/or high-efficiency 35-mpg vehicle and still break even on the life-cycle cost of purchasing and operating a PHEV (plug-in hybrid electric vehicle). The range of gasoline prices analyzed (in 2007) was $2-3.50 per gallon; we've just blown past those prices, making PHEV look even more economic. Couple that analysis with this news: China Announces Plans to Make 1 Million Electric Cars Per Year By 2015 and the game changes yet again. Perhaps its time to offer some facts instead of mere opinion-based pronouncements. "ALL facts show that our way of life is totally dependent on FF consumption, and NO fact shows that it depends strongly on average temperature." A very revealing declaration. I suppose that is partially true, depending on where you live. There are a number of threads here at SkS you can look at if you are interested in facts to fill in the supposed 'NO fact'-based void. But since you've made such a strong statement of denial, I'm guessing that facts aren't such a valuable commodity. -
garythompson at 02:26 AM on 9 March 2011Climate Emergency: Time to Slam on the Brakes
So if I read this post correctly, the reason there appears to be no correlation (over the recent past) between atmospheric CO2 concentration and Temperature anomoly when CO2 is above 370ppm is because "there is further warming in the pipeline". The oceans are storing up all this heat and once it is released there will be at least a doubling of the warming that the fast feedbacks are producing. When will this release occur? You state that if the current CO2 level remains at the 390ppm level that we'll experience sea level increases of 25 meters. We will most certainly be at and above that CO2 concentration for the forseeable future so what is the predicted year we'll see that 25 meters of sea level rise? There are many dire predictions in this post but they are all many decades out and very ambiguous on when they will happen. Can you be more specific with regard to time scales of say 5 years out?
Moderator Response: We don’t have a good knowledge of the timeframe; that’s one of the scary parts. The question is how fast can the ice sheets respond? On the upside, a 25 meter sea level rise wouldn’t happen overnight; it would probably take at least a few centuries. On the downside, there is a possibility of a few metres of sea level rise this century, and that possibility is looking increasingly likely. Even if Hansen’s ice sheet feedback doesn’t get us, there are still greenhouse gas feedbacks… – James
The oceans are storing up all this heat and once it is released there will be at least a doubling of the warming that the fast feedbacks are producing. When will this release occur? You state that if the current CO2 level remains at the 390ppm level that we'll experience sea level increases of 25 meters. We will most certainly be at and above that CO2 concentration for the forseeable future so what is the predicted year we'll see that 25 meters of sea level rise? There are many dire predictions in this post but they are all many decades out and very ambiguous on when they will happen. Can you be more specific with regard to time scales of say 5 years out?
Moderator Response: We don’t have a good knowledge of the timeframe; that’s one of the scary parts. The question is how fast can the ice sheets respond? On the upside, a 25 meter sea level rise wouldn’t happen overnight; it would probably take at least a few centuries. On the downside, there is a possibility of a few metres of sea level rise this century, and that possibility is looking increasingly likely. Even if Hansen’s ice sheet feedback doesn’t get us, there are still greenhouse gas feedbacks… – James -
hank at 02:13 AM on 9 March 2011Climate sensitivity is low
The prior suggestions are 1) poptech redefining the laws of physics, a notorious outlier shows his stuff everywhere 2) Isaac Held has a blog, finally. If you don't know his name, read some of his papers and look for his rare posts at other climate blogs about his work. Very good news to see him start writing more for the public in this blog form. 3) Stoat on Spencer on climate sensitivity: Spencer thinks he can't possibly be wrong, and given that assumption, what else can explain why he's so alone? -
Fred Staples at 02:12 AM on 9 March 2011Climate Emergency: Time to Slam on the Brakes
Harry Seaward is quite right. The West in general, and the UK in particular, have enjoyed the benefits of an industrial revolution, which the East now seeks to emulate. It might be interesting to compare the direct evidence, the atmospheric temperature and CO2 records to see if it likely that China and India (or Amrica for that matter) might be persuaded to abandon carbon fuels. The Central England Temperature, measured by thermometers, illuminates the AGW argument. Anyone looking at he overall plot will be struck by the very modest rise in overall temperatures from 1659 to 1979, 320 years. In that time the CO2 concentratiom increased from 280 ppm to 350ppm, with almost no discernible increase in temperature. A linear regression actually gives the rate of increase at 0.19 degrees C per century - per century, not per decade. Between 1980 and 2010 the rate increased very sharply, to almost 3 degrees C per century, while CO2 increased from 350 to 385 ppm. The AGW alarm sounded and has reverberated ever since in blogs like this. Now statistics as a subject is silent about the future, and we cannot project either of these two rates. But if annual temperatures fall back from an average of 10.36 in the decade ending 2009 to the 9.54 average in the decade ending 1979, the AGW alarm will fall silent. Last year the average temperature was 8.83 degrees C, the 90th coldest year in the record, exactly the same as the temperature in the first year of the record, 1659. December, 2010, was the second coldest December. -
hank at 02:09 AM on 9 March 2011Climate sensitivity is low
wups, lost the comment part, sorry. Suggesting a look at this site, which is trying a grade-school-level approach (well, for a very scientifically literate grade school population). Worth a look given the amount of confusion shown in the comments. "... ... we explain what a greenhouse gas does. The two spectra are crucial to the understanding of the role of greenhouse gases in the atmosphere..... ... ... The next simulated spectra are those for 380 ppmv and 760 ppmv of CO2 respectively looking down from an altitude of 70 km and hopefully show the slight broadening of the 'well' that is crucial to the understanding of why more CO2 leads to a little more warming, even though such warming might not be measureable...." -
RickG at 02:07 AM on 9 March 2011Climate Emergency: Time to Slam on the Brakes
Gilles, Have you not been directed to the thread, "CO2 lags temperature"? I suggest reading the Intermediate article and trying to understand its content. CO2 can be both a forcing and an feedback. -
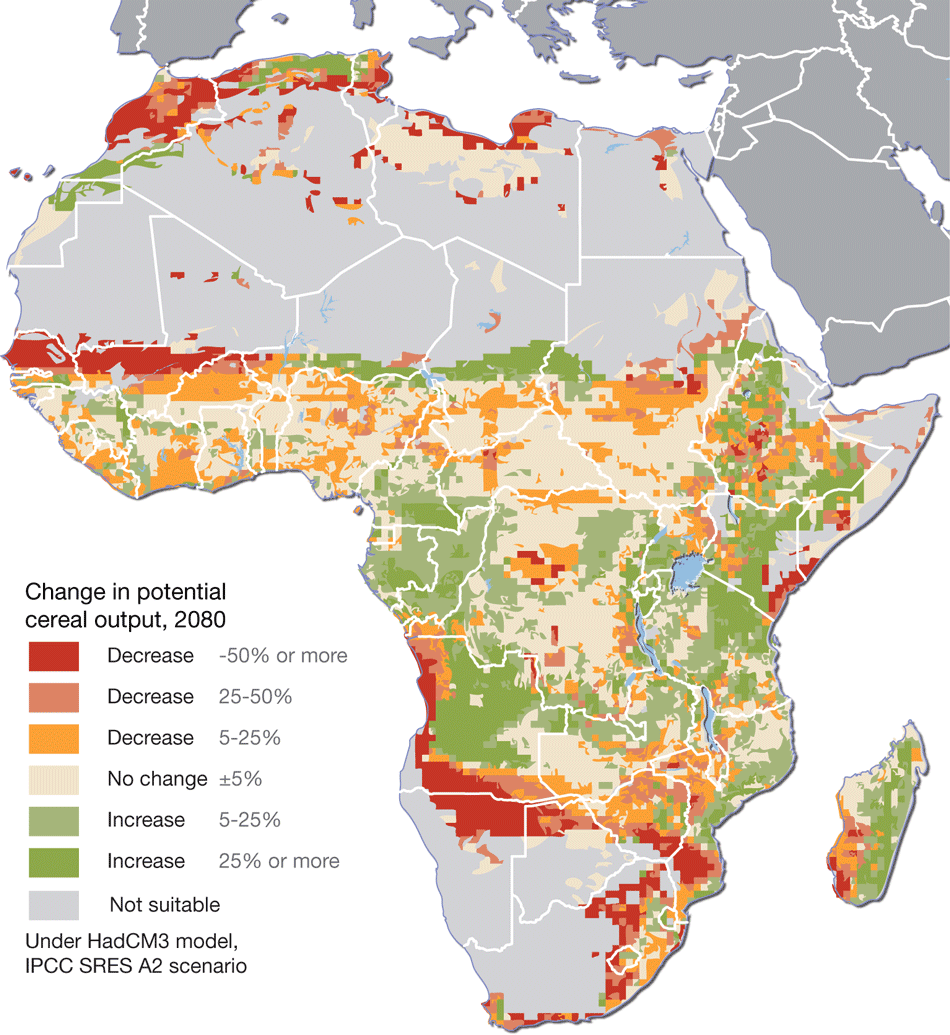
muoncounter at 02:02 AM on 9 March 2011Interactive animation of the climate change impact on agriculture
johnd "were derived from enclosure studies conducted approximately 20 years ago." Note the word 'studies.' "the "food for thought" is really all about the adequacy or otherwise of the models being used as benchmarks." You are picking out the word 'models' and objecting to it without noting that there are data from long-term studies behind those models. I'm neither a farmer nor a botanist (and the squirrels got most of last summer's tomatoes), but I quickly found 2 papers (refs above) casting doubt on the accuracy of greenhouse-based yield projections against actual performance in the open fields. The Ville came up with another. Thus it cannot be conclusively said that increased CO2 is a good thing; perhaps the simplest statement on the question of CO2 means higher plant yield is: 'the science isn't settled.' -
Harry Seaward at 01:58 AM on 9 March 2011Climate Emergency: Time to Slam on the Brakes
The industrialized nations rely on fossil fuels to a large degree. It is a convenient form of portable power. Developing nations are also increasingly become dependent on fossil fuels as they develop infrastructure to improve the quality of life for their citizens. Until (read when and if) solar, wind, wave, or other forms of "clean" energy become reliable and readily available, fossil fuels are going to rule the roost. Nuclear has been maligned to the point that it will take major changes in public perception to put in place. -
Gilles at 01:52 AM on 9 March 2011Climate Emergency: Time to Slam on the Brakes
RickG, do you mean that the poles can experience a 6°C decrease in temperature (e.g. between -140 000 and -120 000 BP) , without any change in the global temperatures ? Interesting ... but still CO2 hasn't decreased in this period, so what did change in the forcings ? if you look in detail, you will see many periods lasting several centuries during which temperature and CO2 varied in opposite ways; this is obviously contradictory with "Temperature can vary only through a change in forcings AND CO2 is the main driver for these changes AND the relaxation timescale is less than one century". -
RickG at 00:20 AM on 9 March 2011Climate Emergency: Time to Slam on the Brakes
#23 Gilles, Note what was said, "at the poles", not global. We are already seeing that much increase in the high latitudes. -
Bob Tisdale at 23:57 PM on 8 March 2011Blaming the Pacific Decadal Oscillation
The Moderator replied, "[Daniel Bailey] If you feel Tamino used the wrong dataset why have you not corrected him? I note, having read the entire post Tim linked to for you, you were absent from the discussion therein." Most of my comments are deleted at Tamino's OpenMind. You continued, "By definition, Kaplan is THE dataset to use for NA SST's." Kaplan SST data is “A” Sea Surface Temperature anomaly dataset, not “THE” dataset. The ESRL uses Kaplan North Atlantic SST data (0-70N, 80W-0) to create their AMO dataset, similar to JISAO using the obsolete UKMO and obsolete Reynolds OI.v1 and the current Reynolds OI.v2 SST data for their PDO data. In some respects it’s similar to the Met Office using Hadley HADSST2 for their HADCRUT product, and similar to GISS using a combination of HADISST/Reynolds SST for their LOTI product. The ESRL selected a SST dataset to use for their AMO product. They could have used any long-term SST dataset. A question: If you wanted to determine the global sea surface temperature anomaly contribution to the global GISS LOTI data would you use Kaplan SST or the datasets GISS uses? The multidecadal variability of the Kaplan SST data is different than the SST datasets used by GISS and those differences biased Tamino's results. They gave him the result he was looking for, but they were wrong results because he used the wrong SST dataset. I illustrated that error very clearly in the post that I linked earlier. Here’s the address again: http://bobtisdale.blogspot.com/2011/02/comments-on-taminos-amo-post_03.htmlModerator Response: [DB] When it comes to climate-related time series data analysis I trust those who not only do it for a living, but those who's work has proven to not only withstand the tests of time and other research, but who have established gold standards for accuracy and understanding of the underlying physical processes the analysis' represents. Tamino's body of work has long been regarded as the de facto standard in climate data analysis. So a choice between Tamino or you is a non-choice. As to issues with moderation on Tamino's blog, he has come to have little tolerance for those unwilling to learn, but has demonstrated great patience with those trying, but struggling, to do so. -
Gilles at 23:52 PM on 8 March 2011Climate Emergency: Time to Slam on the Brakes
iana@16 : so do you agree that what alan_marshall said : " The pattern is consistent. An increase in CO2 from 180 to 280 ppm is associated with a rise in temperature at the poles of more than 10°C. The increase in CO2 is less than double, yet the increase in temperature is greater than projected for doubled CO2 in medium-term models. I see this as evidence the estimates for climate sensitivity derived from such models are likely to be conservative." is incorrect, since there must be OTHER forcings ? iana@17 : my comment is the following : you can read here http://www.grida.no/publications/other/ipcc%5Fsr/?src=/climate/ipcc/emission/ "No judgment is offered in this report as to the preference for any of the scenarios and they are not assigned probabilities of occurrence..." so can you explain me how to compute probabilistic forecast without any a priori probability distribution of scenarios ? -
newcrusader at 23:47 PM on 8 March 2011Climate Emergency: Time to Slam on the Brakes
One of the uncertainties I have read as a non scientists is 'climate inertia' or the time it will take for ice and the atmosphere to respond to the 390>PPM CO2 now measured by the NOAA in HI. I read Dr. Hansen's book- he speaks of this inertia- regarding ice melting- it a slow process, but once it starts there is little chance for stopping it. And this melting is going to accelerate at around 400ppm CO2. The OP talks about the urgency we now face- with C02 at such high levels as today- and rising rapidly. Have we passed into the zone of 'Dangerous climate change'- Hansen feels we have- can we stop 'extremely dangerous climate change?' Just my OP- we are in deep deep trouble- and the world seems totally aloof.Moderator Response: [Daniel Bailey] Salient points, all.For those paying attention, the demise of Multi-Year (MY) Arctic Sea Ice currently ongoing (expect to see seasonal open water at the pole by 2012 at summer melt maximum, this summer if weather conditions are more conducive). With the albedo-flip kicking in, the energy poured into killing off millennia-old MY ice will then go into the warming of the Arctic Ocean itself, with the result of longer and longer melt seasons each year & a corresponding ramp-up of ice loss from both the Greenland Ice Sheet and the West Antarctic Ice Sheet. More Polar Amplification to come (in the pipeline).
Is the pot in the red danger zone if the steam is blowing the lid off the pot?
Not that the world is fiddling while Rome is burning; more like just Wubbling down (since I missed the good doctor's birthday last week).
-
DebfromTN at 23:28 PM on 8 March 2011Climate Emergency: Time to Slam on the Brakes
In response to the prior comments about how politicians need persuasion to pay attention to the scientific data and take action now, I would like to request permission to share this link all over the place, i.e. C-Span. There is a discussion there now inviting comments about whether or not President Obama should open our oil reserves in a hope to reduce the prices at the pump. I would like to share this link there. As you know, I do not have a scientific educational background to be able to offer any intelligent discussion to this link, but I do have common sense and it tells me I should pay attention to the scientific data and open my mind to the discussions among the experts. I know Mother Earth is pretty resiliant, but what I take away from this article, is that even she has her limits and her sustainability for human existence will turn on us eventually if we don't start changing now. Convincing the consumers consumed with consumption will be the tricky part.Moderator Response: [Daniel Bailey] Welcome to Skeptical Science! Feel free to link to any article posted here.To get the most out of this educational site, we recommend that Newcomers, Start Here and then learn The Big Picture. I also recommend watching this video on why CO2 is the biggest climate control knob in Earth's history.
Further general questions can usually be be answered by first using the Search function in the upper left of every Skeptical Science page to see if there is already a post on it; odds are, there is. If you still have questions, use the Search function located in the upper left of every page here at Skeptical Science and post your question on the most pertinent thread.
Remember to frame your question in compliance with the Comments Policy and lastly, to use the Preview function below the comment box to ensure that any html tags you're using work properly. Thanks for taking the time to post your comment!
-
Arkadiusz Semczyszak at 23:14 PM on 8 March 2011Climate Emergency: Time to Slam on the Brakes
@ranyl “... that some models suggest that the CO2 that gone into the sinks will be released and there is of course the climate warming CO2 feedback with gives out about 10-20ppm per 1C.” Ensemble reconstruction constraints on the global carbon cycle sensitivity to climate, Frank et al., 2010.: “But themagnitudeof theclimate sensitivityof theglobal carboncycle (termed c), and thus of its positive feedback strength, is under debate, giving rise to large uncertainties in global warming projections.” “Our results are incompatibly lower (P,0.05) than recent pre-industrial empirical estimates of 40 p.p.m.v. CO2 per 6C (refs 6, 7), and correspondingly suggest 80% less [!!!] potential amplification of ongoing global warming.” -
Arkadiusz Semczyszak at 22:36 PM on 8 March 2011Interactive animation of the climate change impact on agriculture
Sorry, The beginning of my post should be something like the following: @Chris G “... increased warmth in Russia lead to higher yields last year.” This comment is ... -
Arkadiusz Semczyszak at 22:34 PM on 8 March 2011Interactive animation of the climate change impact on agriculture
This comment is ... But first, arguments - later opinion. Once again, the drought in Eastern and Central Europe is linked to the sharp change in ENSO from LN to LN - rapid drop (June - July) in temperature of the oceans (typical for the past two decades). This phenomenon causes changes in atmospheric circulation - effects ? - such as droughts in China. Just as in 2003 and 2006 - violent La Nina (need not be a big change - as the 2007 / 8, but it must be quick - rapid change) = drought in many areas of NH. Warming = warm winters. 1. I am eng. agro-meteorologist. 2. Generally, both the higher concentration of CO2 and temperatures favor most crops. It is textbook knowledge. Any cause of climate change in some areas of decline in the growth of other cereal production. The most visible example of this in Africa. “Projected impacts relative to current production levels range from −100% to +168% in econometric, from −84% to +62% in process-based, and from −57% to +30% in statistical assessments.” (Climate change risks for African agriculture, Müller et al., 2011.) Model Mann & Babb is too simple, would be real ... -
MarkR at 21:31 PM on 8 March 2011Climate Emergency: Time to Slam on the Brakes
"I wonder if SkS should switch entirely to how we move public opinion and therefore the politicians? The scientific case is iron-clad (despite the protestations of a few posters)." I completely disagree with that... Very few sites provide SkS' level of analysis with such accessibility. IMO SkS is about using the scientific method to cut through the rubbish. That's been done very well for the physical science: SkS has clearly pointed out that it's not the Sun causing global warming, but on the other hand that 7 metres of sea level rise isn't going to happen tomorrow. In terms of actions, it's a lot harder. But taking the approach of explaining the effects of different policies based on peer reviewed work so that those with a political bent can make informed decisions is where SkS should be IMO. That's what James' article here is about: explaining the evidence behind claims of climate sensitivity and why this should be factored into any risk analysis for the future. -
johnd at 21:29 PM on 8 March 2011Interactive animation of the climate change impact on agriculture
The Ville at 21:08 PM, the claimed low rate of correlation of growth versus CO2 is very much reminiscent of trying to find trees whose tree-ring measurements reflected temperature driven growth. What percentage of trees in what percentage of sites worldwide have been able to provide suitable trees? Would it be that the same problem affects those trees as that which Briffa found with his trees and his divergence problem. -
ranyl at 21:25 PM on 8 March 2011Climate Emergency: Time to Slam on the Brakes
Not sure that paleoclimatic records support CS is 3C...they seem to point to it being somewhat higher! "Together, it is clear that during the Cretaceous and Paleogene climate sensitivity commonly exceeded 3°C per CO2 doubling." "Fossil soils constrain ancient climate sensitivity" Dana L. Royer1, PNAS | January 12, 2010 | vol. 107 | no. 2 | 517–518, Birgit Schneider and ralph Schneider "Global warmth with little extra co2" nature geoscience | VOL 3 | JANUARY 2010 |pg 6, "The conclusion of a high Earth system sensitivity5,13 is particularly worrying if there is a potential for the hitherto slow components of the climate system to respond more quickly in the face of rapidly increasing CO2 emissions." In this paper the CS long term (1000yr say) with all natural variation taken into account is ~8-12C, "If changes in carbon dioxide and associated feedbacks were the primary agents forcing climate over these timescales, and estimates of global temperatures are correct, then our results imply a very high Earth-system climate sensitivity for the middle (3.3 Myr) to early (4.2 Myr) Pliocene ranging between 7:1 +/- 1:0C and 8:7 +/-1:3 C per CO2 doubling, and 9:6=+/-1:4 C per CO2 doubling, respectively." "High Earth-system climate sensitivity determined from Pliocene carbon dioxide concentrations" Mark Pagani1*,NATURE GEOSCIENCE j VOL 3 j JANUARY 2010 "The surface in our PE control simulation is on average 297K warm and ice-free, despite a moderate atmospheric CO2 concentration of 560 ppm. Compared to a pre-industrial reference simulation (PR), low latitudes are 5 to 8K warmer, while high latitudes are up to 40K warmer." Warm Paleocene/Eocene climate as simulated in ECHAM5/MPI-OM M. Heinemann, Clim. Past, 5, 785–802, 2009 On average the PE was 9.4C hotter with large polar amplification and a CO2 basically double, so that makes CS 9.4C. It must be remembered that 1000yr CS from Paleo data is higher than the 100CS used in models, the 100CS is about 60% of the 1000yr. So for the long term 9.4C that is 5.64C and so on, "If the temperature reconstructions are correct, then feedbacks and/or forcings other than atmospheric CO2 caused a major portion of the PETM warming." "Carbon dioxide forcing alone insufficient to explain Palaeocene–Eocene Thermal Maximum warming" Richard E. Zeebe1, Nat. Geo. PUBLISHED ONLINE: 13 JULY 2009 | DOI: 10.1038/NGEO578 In this one the CS is about 9-12C again, but as in the quote the authors feel the CO2 CS is a definitive and thus say another factor is necessary rather than CS being higher. There are plenty more of these and the recent article in science again suggesting CS is underestimated and the article last year by Gavin Schmidt saying it was 30-40% down. It does seem to make no sense to me that the CS is going to a standard figure all the time, as it is dependent on multiple none-linear feedbacks the size of which varies depending on the initial conditions. How can Earth with no ice albedo feedback have the same CS to GHG as one with loads of ice? One with no permafrost have the same CS as one with ,lots melting? At present we have a polar ocean melting, and lots of permafrost to melt. It also clear form this paper that temeprature changes can be dramatic and tipping point in nature, ("Another look at climate sensitivity" I. Zaliapin1 and M. Ghil2,3 Nonlinear Processes in Geophysics), so trying to get a statistical CS from paleodata isn't going to easy as the CS is dependent on initial conditions, and many studies suggest it is higher than thought or modelled, it is more likely that the PDF of CS should be a range humps and bumps ranging long twerm from 6-12C. Which hump the world is currently at is hard ot say, but with polar sea ice to go and permaforst etc, it is likely to be on the high side of things probably. "The conclusion from this analysis—resting on data for CO2 levels, paleotemperatures, and radiative transfer knowledge—is that Earth’s sensitivity to CO2 radiative forcing may be much greater than that obtained from climate models ( 12– 14)." "Lessons from Earth’s Past " Jeffrey Kiehl;14 JANUARY 2011 VO 158 L 331 SCIENCE SO yeah things are urgent very very urgent, for a CS as high as suggested from the past means 350ppm gives a 95% probability spread of temperautre rise by 2100 of 1.8-3C. Now how are we going to get 40ppm of CO2 out of the atmopshere, especially considerign that some models suggest that the CO2 that gone into the sinks will be released and there is of course the climate warming CO2 feedback with gives out about 10-20ppm per 1C. How high can CO2 go before the accumulation of heating is too much for 2C not be a definitive, 400ppm peak, even that seems risky buisness considering. Of course the present CO2 is 390ppm, so to peak at 400ppm would mean only adding another 5 year or less carbon into the atmosphere, divide that up fairly arround the world and it means the west has 1 year of emissions to play with for a carbon budget, so not much and considering all the adaptation that will be needed not much at all. Does anyone think that this is in anyway doable? If bold plans like ZeroCarbonBritain by 2030, cause peak CO2 of 434ppm and that isn't counting all the extra carbon needed to replace everything (cars with electric cars, power infra-structure, all white goods for efficient ones, changing the face of farming etc). And also remember the biosphere basically are only hope of drawing CO2 down (carbon cpature is a ruse to keep using fossil fuels and there isn't enough energy in the world to run special CO2 exchange machines and where do we put the carbondioxide for it seems to leaking from the all sites it has been burioed at so far!!). Is a fossil fuel free society even possible anymore? For that would take changing the whole economic system as the current system has to grow and the only way for that to occur is by using fossil fuels. The only way to get CO2 out the atmosphere quickly is to stop putting in quickly and the only way to do that is stop using power. -
Paul D at 21:08 PM on 8 March 2011Interactive animation of the climate change impact on agriculture
Camburn: "Each study I have read concerning co2 and plants results in a higher level of co2 being benifical for plant growth." Then your reading is biased. Read wider. Do trees grow to infinity by continually adding CO2? http://www.uoguelph.ca/news/2010/10/forests_arent_t.html "Studying archived tree-ring measurements held by the National Oceanic and Atmospheric Administration in the United States, they found CO2 fertilization spurred faster tree growth at only about 20 per cent of sites worldwide, despite the fact that the gas typically accelerates growth in plants." -
Paul D at 21:04 PM on 8 March 2011Interactive animation of the climate change impact on agriculture
adrian smits: "As a farmer I know that you need heat units to grow crops and the corn belt in north America has been moving north for years.We consider this a blessing that allows us to grow crops with higher yield and it gives us a greater choice as to what we can grow." God bless America and screw everyone else! What sort of choices are there in deserts? As I said, humanity needs biodiversity, just as much as corn and wheat.
Prev 1856 1857 1858 1859 1860 1861 1862 1863 1864 1865 1866 1867 1868 1869 1870 1871 Next


