


 Arguments


Recent Comments
Prev 1860 1861 1862 1863 1864 1865 1866 1867 1868 1869 1870 1871 1872 1873 1874 1875 Next
Comments 93351 to 93400:
-
johnd at 09:03 AM on 7 March 2011Blaming the Pacific Decadal Oscillation
Tom Curtis at 01:37 AM, re "For a start, during El Ninos, the water surrounding Australia is cooler than normal, yet Australia tends to be hotter than normal." The conditions in Australia are very much subject to what is occurring in the Indian Ocean, perhaps more so, as is evident when trying to find correlation between droughts and the conditions in the oceans surrounding Australia. -
johnd at 08:55 AM on 7 March 2011Blaming the Pacific Decadal Oscillation
RW1 at 08:20 AM, the water vapour having removed heat from the surface, rises to the point where condensation begins, resulting in a nett cooling effect on the atmosphere at that point as the water droplet receives the heat carried by the water molecule. That effect continues on upwards until all moisture in the air has been removed at the highest level where clouds form. The only way to determine the bottom line of the process would be to measure the amount of heat being liberated from the surface by evaporation against the amount of heat that is returned to the surface by rain. -
muoncounter at 08:50 AM on 7 March 2011Blaming the Pacific Decadal Oscillation
RW1, "I don't find them convincing at all" The conclusions in Yeh et al (ref above), are from "calculations based on historical El Nin˜o indices" augmented by "the six climate models with the best representation of the twentieth-century ratio of CP-El Nin˜o to EP-El Nin˜o". Doesn't get much more more convincing than that. "All I'm saying is if natural oscillations can cause ... " Nope, you're ducking that question. What natural forces are these? Are they already accounted for in existing forcing calculations? Are they global? What physical phenomena can be measured to determine their efficacy? It is high time that the 'natural forces' gambit is held to the same level of scrutiny as GHGs. And note that the warming of concern is that rapid rise since circa 1970: 0.15C per decade, not 0.6C in a century.
-
muoncounter at 08:33 AM on 7 March 2011A Real-World Example of Carbon Pricing Benefits Outweighing Costs
Gilles: "why are you looking at EIA's predictions ... They can't predict decreasing energy supplies, it's not politically correct." Your source for this analysis is the blog of an independent journalist? Note that EIA's energy from coal curve does indeed decrease for the next 5 years. "do the maths. 15% of the richest part of the world use 50% of the energy" That is exactly the problem. We are the ones who can best afford to explore technology needed to make meaningful reductions. "the net result of improving all the techniques and economy will most probably INCREASE the overall amount of burnt fossil fuels" You seem to be arguing against doing anything because in your opinion, nothing will be an equitable fix. It would help advance the discussion if you provided some real evidence, rather than these sweeping, opinion-based generalizations. -
RW1 at 08:22 AM on 7 March 2011Blaming the Pacific Decadal Oscillation
Moderator, "Moderator Response: Fixed open italics tag." Thank you! -
RW1 at 08:20 AM on 7 March 2011Blaming the Pacific Decadal Oscillation
RickG, Yes water vapor is tied to temperature - meaning higher temperatures are associated with increased water vapor/evaporation. But the whole cycle of surface water -> water vapor -> clouds -> precipitation -> surface water is what's driving the whole water based feedback mechanism and the energy balance - not just the water vapor alone. That was my point. "As for clouds, those with small water droplets (lighter clouds) tend to reflect light while those with larger water droplets (darker clouds) tend to absorb more light. Am I wrong?" I'm not sure. -
Riduna at 08:12 AM on 7 March 2011A Real-World Example of Carbon Pricing Benefits Outweighing Costs
Marcus has noted that a common argument advanced by those opposed to pricing carbon by way of a carbon tax/levy or cap and trade system is that in doing so we deprive ourselves of the cheapest, most efficient and transportable energy sources known to man. Inevitably, this must result in damage to the economy. Others have pointed out that the price we pay for energy is relatively cheap compared with energy produced from renewable sources because of our failure to develop technology needed to produce competitively priced energy from renewables and because of the subsidies paid to the producers – and sometimes the users – of fossil fuels. Some have reminded us that oil is a finite commodity and that having reached peak oil, probably in 2008, making the future for oil-based fuels is one of decreasing availability and increasing price. Eventually, probably over the next 30 years, the point will be reached when it becomes unaffordable even for mass transport. But there is quite a different price on the use of fossil fuels which will be and already is being exacted on every man, women and child on this planet. That is the price we are all going to pay in terms of the effects of increasing CO2 emissions, the most notable of which are: • On-going and accelerating rise in global surface temperatures • continued, faster melting of the polar ice caps and sea-ice • dangerous sea level rise and coastal flooding • melting of land based snow and ice, contributing to • shortage of water in densely populated areas • loss of capacity to produce food for rapidly growing populations • extinction of flora and fauna dependent on cooler climates • increased risk of fire and flood destroying valuable assets • spread of potentially fatal diseases into areas now free of them • ocean acidification endangering marine life forms • increased incidence and severity of climate events • increased water vapor in the stratosphere causing further warming • melting clathrates releasing methane, making global warming faster. To varying degrees these effects have already become evident but they do not pose an obvious danger – yet. This is because their development is prolonged and slow but it is inexorable. We either price carbon now and curb our CO2 emissions or we shall pay a much, much higher price – one which can threaten our survival as a species on this planet. -
RickG at 08:07 AM on 7 March 2011Blaming the Pacific Decadal Oscillation
RW1: But water vapor is tied directly to clouds and precipitation, which ultimately remove the water vapor from the air and return it to the surface. Forming clouds from the water vapor reflect incoming sunlight and precipitation is typically cooler than the surface, so both counter act negative feedbacks to water vapor. Really! I thought water vapor was tied to temperature. As for clouds, those with small water droplets (lighter clouds) tend to reflect light while those with larger water droplets (darker clouds) tend to absorb more light. Am I wrong? -
dana1981 at 07:58 AM on 7 March 2011A Real-World Example of Carbon Pricing Benefits Outweighing Costs
For the record, I own an electric motorcycle, and it's freaking awesome. daisym #68 -"we must find a new energy source to replace carbon fuels. Period. So, why aren't we looking?"
We are looking. There's solar (PV and concentrated thermal), wind (offshore and onshore), geothermal, tidal, etc. etc."Making "investments" in energy saving things has little economic benefit, except for the early investors"
That's not true. Californians use less per capita energy than most of the rest of the USA, but our rates aren't significantly higher than the average."Because government isn't looking for this replacement energy source, I wonder if carbon fuels are really the threat to humanity we've been told."
Two major problems with this question: 1) It's based on a false premise. As noted above, we most certainly are looking for replacements. And as noted in the article, the RGGI states spent 11% of their carbon funds on renewable energy. 2) The scientific evidence is what it is, and it clearly shows that carbon is a threat to humanity. Whether governments choose to act on it or ignore it does not change the science. The fact that we have rather shortsighted politicians in charge who either don't understand the threat or are unwilling to act on it doesn't change the existence or magnitude of threat. -
RW1 at 07:50 AM on 7 March 2011Blaming the Pacific Decadal Oscillation
dhogaza (RE: 48), "Warmer air will hold more water vapor, regardless of the sources of warmth, and this is a large positive feedback that is not an "extraordinary claim", as it's been known for ages." I don't dispute that the water vapor feedback, by itself, is positive. But water vapor is tied directly to clouds and precipitation, which ultimately remove the water vapor from the air and return it to the surface. Forming clouds from the water vapor reflect incoming sunlight and precipitation is typically cooler than the surface, so both counter act negative feedbacks to water vapor. "The extraordinary claim is that negative feedbacks will be large enough to offset this and other (relatively minor) positive feedbacks." Virtually every natural system, micro or macro, is dominated by net negative feedback, especially those stable enough to support life. The human body is good example. When the internal body temperature starts to cool down, internal feedback mechanism kick in that warm it up and vice versa - keeping a relatively constant internal temperature. Net postive feedback is the extraordinary claim. "As it turns out, reality, including that described by physics and other sciences, is often "illogical" and unintuitive." Sometimes, yes, but highly doubtful in this case, especially given that varying incoming solar power is clearly opposed by the system rather than re-enforced and the response of the system to solar power is so much less.Moderator Response: Fixed open italics tag. -
dhogaza at 07:27 AM on 7 March 2011Blaming the Pacific Decadal Oscillation
The bottom line, for me at least, is net positive feedback is an extraordinary claim that requires extraordinary proof, especially since solar energy is not amplified to anywhere near such an extent
Warmer air will hold more water vapor, regardless of the sources of warmth, and this is a large positive feedback that is not an "extraordinary claim", as it's been known for ages. The extraordinary claim is that negative feedbacks will be large enough to offset this and other (relatively minor) positive feedbacks.net negative feedback is far, far more logical for a system stable enough to support life as the Earth is.
As it turns out, reality, including that described by physics and other sciences, is often "illogical" and unintuitive. -
daisym at 07:20 AM on 7 March 2011A Real-World Example of Carbon Pricing Benefits Outweighing Costs
I think everyone is missing the point. The point is, we must find a new energy source to replace carbon fuels. Period. So, why aren't we looking? What good are all of the carbon tax schemes in the world, if we don't spend the tax money on R&D for a full time replacement energy source? Making "investments" in energy saving things has little economic benefit, except for the early investors. Over a short period of time, energy costs must rise. The electric company requires a "fixed" revenue stream to maintain the grid, regardless of reductions in consumption. If its customers use less electricity, then this fixed cost forces an offsetting rate increase levied on the reduced consumption. Similarly, the U.S. Post Office continues to raise postal rates to replace revenues lost to electronic mail. Until email was invented, we had to rely on the Postal Service to carry the mail. Until a 24/7 alternative to carbon fuels is invented, we will continue to rely on carbon fuels. Because government isn't looking for this replacement energy source, I wonder if carbon fuels are really the threat to humanity we've been told. -
Marcus at 06:58 AM on 7 March 2011A Real-World Example of Carbon Pricing Benefits Outweighing Costs
Gilles, I don't need an electric car, as I use buses & trains to get everywhere-so my own transportation based CO2 footprint is already extremely low. -
RW1 at 06:56 AM on 7 March 2011Blaming the Pacific Decadal Oscillation
muoncounter (RE: 40), "Now you are making a major assumption with the contention that all of ENSO is an entirely natural oscillation. From Yeh et al 2009:" The conclusions in that paper are highly presumptuous given that relatively little is known about what actually causes ENSO to occur. I don't find them convincing at all. "Here you're assuming that such slow oscillations exist at all, let alone in sufficient amplitude to 'cause' any such change. Then you'd have to explain why 'slow' oscillations cause rapid temperature increase in a pattern that accelerates (increases in rate of change) towards the Arctic." Not really. All I'm saying is if natural oscillations (variations) can cause up to 0.5 C of temperature change in one year, why couldn't natural forces cause most of the 0.6 C of warming over the whole of 20th century? "It would be interesting indeed if you applied the same zeal that you've shown for testing forcing theory to Spencer's calculations referenced in the context of Figure 3 of this post. That would be the skeptical thing to do. I haven't yet read Spencer's post, but I will take a look at it and possibly comment. The bottom line, for me at least, is net positive feedback is an extraordinary claim that requires extraordinary proof, especially since solar energy is not amplified to anywhere near such an extent and since net negative feedback is far, far more logical for a system stable enough to support life as the Earth is. -
Gilles at 06:40 AM on 7 March 2011A Real-World Example of Carbon Pricing Benefits Outweighing Costs
Marcus, how is your own electric car working? Muoncounter : why are you looking at EIA's predictions that have repeatedly proven to be wrong in the last years? http://petrole.blog.lemonde.fr/files/2010/11/eiaieooilprojections2000-2010.1290092704.png the falling curves that suddenly increase again in the next years are simply not reliable. Official agencies have persistently underestimated the peaking of production of many countries : US, north sea, mexico. They can't predict decreasing energy supplies, it's not politically correct. others: I am not saying that energy conservation is impossible, nor of course that it shouldn't be done. I say first that it is probably of limited value since the fossil fuel production will eventually vanish, and the productivity won't go to infinity. So energy conservation can mitigate partly the decline of energy, but not completely offset it. Second, even if you reduce the consumption of energy in OECD, how can you justify to prevent the poorest people to use it? do the maths. 15 % of the richest part of the world use 50 % of the energy, so a ratio 6 to 1 compared to the poorest. Even if they halved their energy consumption (going to 3 to 1) this would only correspond to an increase of 50 % for the poorest. How can you prevent them to raise to 1,5 , still one half of the richest? so you can't prevent poor people to use the energy you're sparing (I am not saying this shouldn't be done : it's a fair thing to make our world more equitable. I'm just saying this will not reduce the overall consumption. And it won't either reduce the total amount of fossil fuels that we can extract : usually, a more efficient economy is still more efficient to get scarer resources - so the net result of improving all the techniques and economy will most probably INCREASE the overall amount of burnt fossil fuels... -
Albatross at 06:33 AM on 7 March 2011The Climate Show Episode 8: Kevin Trenberth
I am very much looking forward to listening to this episode. -
dana1981 at 05:22 AM on 7 March 2011A Real-World Example of Carbon Pricing Benefits Outweighing Costs
actually thoughtfull #62 - I think your numbers are off a bit there. As I recall, over 90% of daily driving in the USA is under 40 miles. Gilles #53 - you're missing the fact that with a carbon price, it creates a revenue stream which can be used to fund energy efficiency programs, as we saw in the RGGI case. When these programs are made more readily available to the public, people will be more likely to take advantage of them. For example, my local electrical utility has a program to make low income homes more energy efficient at no cost. Several years ago when I qualified, I took advantage of the program, and now my home is much more energy efficient. -
Timothy Chase at 05:08 AM on 7 March 2011Blaming the Pacific Decadal Oscillation
It might help if we know what the notation means, eh? From the essay:The greenhouse effect can be defined as ([equations] 8-10)
Ga = σ(SST)4 - F+ ([equation] 1)
According to the Stefan Boltzmann law, σ(SST)4 is the infrared black body emission by the surface at temperature SST, σ=5.67 X 10⁻⁸ Wm-2 K-4 is the Stefan Boltzmann constant, and F+ is the outgoing infrared radiation flux at the top of the atmosphere. -
Blessthefall at 04:57 AM on 7 March 2011A Real-World Example of Carbon Pricing Benefits Outweighing Costs
@Rob: Regarding the graph of food prices you provided - http://www.globaldashboard.org/2011/03/03/did-we-say-feed-the-future-oh-we-meant-feed-car-engines/ -
Gordon1368 at 04:44 AM on 7 March 2011The Climate Show Episode 8: Kevin Trenberth
I watched the entire show, it is very good, and it was a pleasure to see and hear some of the people I have been reading about lately. John Cook's explanation of the misuse of the term "hide the decline" was concise and clear, and I wonder if stevee (Post #1, possibly already deleted) even bothered to watch it before posting his reaction to seeing the name "Trenberth" in the tile. My thanks to the people who provide this site, and also to the many contributors who take on the thankless task of responding to the endless stream of willful deniers. I understand questioning the science, in order to deepen understanding, but I am tired of the stream of people who treat it like a rhetorical game, in which debating points can be scored by clever misinterpretation and a degree of facility with scientific terminology. -
Blessthefall at 03:51 AM on 7 March 2011A Real-World Example of Carbon Pricing Benefits Outweighing Costs
@Rob: Regarding the food prices, I think you're suggesting that weather extremes cause food prices to go up... whether it be a heat wave in Russia or the recent cold snap in Mexico. Gotta run now, but i'll respond to your other points later. -
Timothy Chase at 03:30 AM on 7 March 2011Blaming the Pacific Decadal Oscillation
Tom Curtis wrote in 42:A very good point, that I did not think of. (That's the advantage of not being an expert - I get to make silly mistakes every now and then.)
I make a fair number of mistakes, too. You have to be willing to make mistakes if you wish to learn since almost inevitably part of the process. And I am not an expert, either. Just a philosophy major turned computer programmer -- who will often preface what he is about to say with, "As I understand it..." Tom Curtis wrote in 42:However, I am still not happy with the story that the increase in mean global temperatures is just due to atmospheric heat transport from the warm El Nino waters. For a start, during El Ninos, the water surrounding Australia is cooler than normal, yet Australia tends to be hotter than normal. That is probably due to reduced cloud cover, but that means feedback effects can still be a significant factor.
There are feedbacks, but they are part of the El Nino itself, not something that happens afterwards as some sort of lagged feedback that causes global temperatures to rise after the El Nino. One of the more interesting feedbacks is referred to as a clear sky "super greenhouse effect" that occurs over tropical ocean where downwelling radiation increases more rapidly than upwelling radiation -- which is a result of increased water vapor. Please see: Valero, F. P. J., W. D. Collins, P. Pilewskie, A. Bucholtz and P. J. Flatau (1997) Direct Radiometric Observations of the Water Vapor Greenhouse Effect Over the Equatorial Pacific Ocean, Science, 275, 1773–1776. From the abstract:Airborne radiometric measurements were used to determine tropospheric profiles of the clear sky greenhouse effect. At sea surface temperatures (SSTs) larger than 300 Kelvin, the clear sky water vapor greenhouse effect was found to increase with SST at a rate of 13 to 15 watts per square meter per Kelvin. Satellite measurements of infrared radiances and SSTs indicate that almost 52 percent of the tropical oceans between 20°N and 20°S are affected during all seasons. Current general circulation models suggest that the increase in the clear sky water vapor greenhouse effect with SST may have climatic effects on a planetary scale.
... and from the paper itself:Satellite studies (8–10) have found that for clear skies and SSTs above 298 °K, the spatial variation of Ga with SST, dGa/d(SST), exceeds the rate of increase of sea surface emission, ds(SST)4/d(SST) = 4σ(SST)3. For a tropical SST of 300 °K, 4σ(SST)3 ~ 6.1 W m-2K-1. This effect, termed the "super greenhouse effect" (11), occurs in both hemispheres during all seasons. It is also observed for interannual variations of Ga with SST during the El Nino in the tropical Pacific (12). Observations in the tropical Atlantic ocean (11) show that the clear sky downwelling infrared flux incident on the surface (Fa-) also increases faster than the surface emission with increasing SST. The net result is further warming of the surface, which in turn induces additional heating of the atmosphere column above.
However, what you are describing is a bit different -- and in terms of the effects at least the inverse of what we see up in the Seattle area. In Seattle we have warmer waters just off the coast, but this is only over a thin strip of water. Cool air blows in off of the cooler than normal North Pacific Ocean. In the case of Australia, however, I believe what is happening is the result of a decrease in moist air convection. With less precipitation there is less evaporation and the moist air convection by which the surface normally loses much of its excess heat. The same thing is supposed to dry out the continental interiors in the decades to come. Land warms more quickly than ocean due to the differences in thermal inertia. Warmer ocean temperatures will imply a higher absolute humidity over the ocean surface and over land, but as temperatures are higher in the continental interiors the humidity of saturation will be still higher inland and during the summers the relative humidity will drop more as you move inland. Therefore there will be less precipitation and reduced moist air convection carrying heat away from the surface. Thus during the summer months, when you need the cooling effects of moist air convection the most, it will be reduced, causing temperatures to rise still further. -
Tom Curtis at 03:05 AM on 7 March 2011The Good, The Bad and The Ugly Effects of Climate Change
Berényi Péter @84, this study shows that the ideal temperature (for the Dutch) is 16.5 degrees C, with mortality increasing 1.75 times as fast for each degree over as it does for each degree under (on average) but still showed more deaths from cold than from heat. Presumably this is because in Holland, the coldest days are much further below the safe level than the hottest days are above it, although different heat responses to different diseases may also be relevant. Similar studies in England and the US show varied effects. In England the cold related mortality is higher, whereas in the US, with a mixture of temperate and subtropical cities, it was found that there are no cold related deaths in subtropical cities, although there are heat related deaths. There are both heat and cold related deaths in temperate cities. The obvious conclusion is, firstly, that you estimate that 26.74 degrees C is the temperature that minimizes temperature related effects on mortality is in significant error. Even if it were not, such temperatures are typical of mean summer temperatures in the tropics. Further, for the majority of the world's population (who live in the tropics and subtropics) heat is a potential killer, but cold is not. Your equation that we should go for higher temperatures to reduce mortality only makes sense if the deaths of people of the tropics and subtropics is inconsequential compared to those of people in temperate zones. Even in temperate Holland, Business As Usual scenarios will raise temperatures sufficiently as to turn around the proportion of those killed, so that heat becomes the major killer rather than cold. Arguably, the reduction in cold related deaths will compensate for the increase in heat related deaths. But in that case the equation for increased temperatures is no significant change in temperature related deaths in temperate zones; but a significant increase of them in the tropics and sub tropics.We conducted the study described in this paper to investigate the impact of ambient temperature on mortality in the Netherlands during 1979–1997, the impact of heat waves and cold spells on mortality in particular, and the possibility of any heat wave- or cold spell-induced forward displacement of mortality. We found a V-like relationship between mortality and temperature, with an optimum temperature value (e.g., average temperature with lowest mortality rate) of 16.5°C for total mortality, cardiovascular mortality, respiratory mortality, and mortality among those ≥ 65 year of age. For mortality due to malignant neoplasms and mortality in the youngest age group, the optimum temperatures were 15.5°C and 14.5°C, respectively. For temperatures above the optimum, mortality increased by 0.47, 1.86, 12.82, and 2.72% for malignant neoplasms, cardiovascular disease, respiratory diseases, and total mortality, respectively, for each degree Celsius increase above the optimum in the preceding month. For temperatures below the optimum, mortality increased 0.22, 1.69, 5.15, and 1.37%, respectively, for each degree Celsius decrease below the optimum in the preceding month. Mortality increased significantly during all of the heat waves studied, and the elderly were most effected by extreme heat. The heat waves led to increases in mortality due to all of the selected causes, especially respiratory mortality. Average total excess mortality during the heat waves studied was 12.1%, or 39.8 deaths/day. The average excess mortality during the cold spells was 12.8% or 46.6 deaths/day, which was mostly attributable to the increase in cardiovascular mortality and mortality among the elderly. The results concerning the forward displacement of deaths due to heat waves were not conclusive. We found no cold-induced forward displacement of deaths. Key words: cold spells, heat waves, mortality, mortality displacement, Netherlands, temperature. Environ Health Perspect 109:463–470 (2001). [Online 3 May 2001]
-
andthorne at 02:58 AM on 7 March 2011Blaming the Pacific Decadal Oscillation
Below is an edited email that I sent to NOAA almost four years ago telling them that I thought that El Nino and La Nina were caused by the actions of methane hydrates. At the time I did not know that the name for the conversion of the organic bedrock "shale" via liquid CO 2 was called the "retorting of shale oil" and I got some other things- not so much wrong as incomplete. I had only been reading about the topic for about six months;but the basic theory that I put forth that El Nino and La Nina are probably cause by the heat trapping cabilbities of the hydrates must be looked into. The year 2007 is also the year i first started to contact bee researchers and the USDA to tell them our problem with the bees was formaldehyde gas in excess in our atmosphere due to rising levels of ethane which oxidzes to the deadly gases of formaldehyde and carbon monoxide before proceeding to CO2. Shortley thereafter the light bulb went on that our excess CO2 was from methane oxidation, not our cars and factories. Andrea Silverthorne ----- Original Message ----- From: "Newstar Realty" -
muoncounter at 02:56 AM on 7 March 2011The Good, The Bad and The Ugly Effects of Climate Change
BP: "monthly mortality data for the UK from the Office for National Statistics for the period January 2006 - January 2011." Interesting choice of both time period and locale. The UK was at the edge of the 2010 heatwave: The same could be said for 2007:
 At least those events were within your time sample. Perhaps going back to the 2003 heatwave would be appropriate; although reported mortality in France and Germany was 10x that of the UK.
 "if human lives are to be saved, we should clearly go for higher temperatures. "
Health professionals take this question seriously, so we do not have to rely on ad hoc analysis. From Ippoliti et al 2010:
The effect of heat waves showed great geographical heterogeneity among cities. Considering all years, except 2003, the increase in mortality during heat wave days ranged from +7.6% in Munich to +33.6% in Milan. The increase was up to 3-times greater during episodes of long duration and high intensity. ... The highest effect was observed for respiratory diseases and among women aged 75-84 years.
"if human lives are to be saved, we should clearly go for higher temperatures. "
Health professionals take this question seriously, so we do not have to rely on ad hoc analysis. From Ippoliti et al 2010:
The effect of heat waves showed great geographical heterogeneity among cities. Considering all years, except 2003, the increase in mortality during heat wave days ranged from +7.6% in Munich to +33.6% in Milan. The increase was up to 3-times greater during episodes of long duration and high intensity. ... The highest effect was observed for respiratory diseases and among women aged 75-84 years.
-
RW1 at 02:55 AM on 7 March 2011Blaming the Pacific Decadal Oscillation
Tom (RE: 36), "If it was not a feedback mechanism, the global temperature effects would exactly coincide with the temperature effects on the surface of the pacific ocean, and would equal the surface temperature effects on the tropical pacific divided by the area effected. As it happens, the maximum global temperature effect lags the maximum surface temperature effect in the Pacific, and is larger than the proportional change in SST. Because the global temperature response lags ENSO, the causal direction must be ENSO -> global temperature response, rather than the other way round. Hence, it is a feedback." What you are describing here is a Time Constant (a lag between an initial change and final effect) - not a feedback. Feedback is a separate mechanism that opposes or amplifies the change. "No assumptions. The increase of globally averaged specific humidity with El Ninos (and decrease with La Ninas) is a well known phenomenon. The 1998 spike in humidity is as obvious as the spike in temperature. Further, the connection between high humidity and high temperatures is also well established by theory and observation. El Ninos and La Ninas are caused by variations in the strength of the Walker circulation, which are in turn driven by changes in the relative temperature between the Eastern and Western tropical pacific. So, the Walker circulation in effect acts as a feedback mechanism to that variation. What causes the initial variations is more dubious, with a number of factors implicated (and it is unlikely to be a single factor)." Well, what causes the initial variations is the key, isn't? Is it an internal or external forcing? Again though, you're mistaking a Time Constant for a feedback mechanism. "Again, I know that it is a positive feedback because of the relative magnitude of the response. The maximum area affected by an El Nino is approximately one ninth of the Earth's surface. This excludes those parts of the Pacific that are cooled in an El Nino, which if included would weaken the calculated initial response (and hence strengthen the calculated feedback). The minimum area warmed is about 1/27th of the Earth's surface. It is difficult to estimate the total area warmed, but with very high confidence it lies between these two extremes. So, 2 degrees over one ninth of the Earth's surface, globally averaged is 0.22 degrees, much less than the 0.5 degree global increase. Hence the feedback must be positive. And that is the very conservative estimate, as it allows the maximum possible warming extent, and does not consider the cooling at other regions." But what percentage of the Earth's thermal mass is warmed? That's a more difficult question, but one that would need to be answered, especially since only 2/3rds of the planet is ocean and the ocean is most of the thermal mass. Also, the phenomenon doesn't seem well understood enough to know that the area you cite in the Pacific is solely responsible for the full globally averaged warming effect. "Again the caveat, this is beer coaster mathematics, and only indicates ball parks. It is certainly accurate enough to show the sign of the feedback, but not accurate enough to narrow the magnitude significantly. None-the-less, the correlation does hold that the stronger the effect of ENSO on global temperatures, the stronger the positive feedback involved, and hence the stronger the positive feedback from CO2 induced warming. @ 34: Perhaps it will make it easier when you remember that a positive feedback enhances both warming from an initial warming, and cooling from an initial cooling. The return of Pacific SSTs to normal values after an El Nino is a cooling, of equal magnituded to the initial warming. It will therefore generate a cooling feedback of equal magnitude to the initial warming feedback, thus cancelling it out." This doesn't make sense to me. A forcing that causes a warming and then ceases or fully subsides is not an equal and opposite cooling effect - it's a simply a cessation of the forcing that caused the warming. In order to get an equal and opposite effect, you would need a forcing that causes cooling below the initial state prior to the warming forcing. Positive feedback is defined as feedback that amplifies or reinforces change. If the feedback is net positive, in the case of warming, then the feedback causes more warming above and beyond the initial intrinsic warming. If or when the intrinsic warming stops, the amount of warming above and beyond from the feedback remains. Why doesn't the net positive feedback continue to amplify the remaining warming? Clearly this doesn't happen. -
actually thoughtful at 02:48 AM on 7 March 2011A Real-World Example of Carbon Pricing Benefits Outweighing Costs
To further the advantage of electric cars- 8 normal sized solar panels (3 foot by 5 foot - ~1.7 square meters) will charge that electric car for its 100 mile range (Nissan Leaf). 100 miles covers over 60% of Americans average daily driving. You may need a 2nd car - gas guzzler - for long trips. I run a plumbing business with a service area of 250 square miles - I RARELY exceed 100 miles in a given day. And if I do - I know I am going to so I can either take a different vehicle, or I can borrow some electrons along the way. -
muoncounter at 02:20 AM on 7 March 2011Icing the Medieval Warm Period
RickG, "aerosols being very short-lived in the atmosphere certainly would not be as prevalent in the southern latitudes " Good point. In addition, those graphs illustrate that claims of 'flattening and 'no sign of significant acceleration since 1970' are utterly devoid of contact with observations. -
Berényi Péter at 02:07 AM on 7 March 2011The Good, The Bad and The Ugly Effects of Climate Change
"Warmer winters would mean fewer deaths, particularly among vulnerable groups like the aged. However, the same groups are also vulnerable to additional heat, and deaths attributable to heatwaves are expected to be approximately five times as great as winter deaths prevented." The proposition in bold above may actually be true. It depends on who is supposed to expect such a thing. If it refers to those who don't bother having a look at actual data, it's fine. However, a slightly modified version of this proposition like "[number of] deaths caused by heatwaves will be approximately five times as great as winter deaths prevented" is certainly false. It just emphasizes the importance of avoiding language of marketing when talking about science. We can get monthly mortality data for the UK from the Office for National Statistics for the period January 2006 - January 2011. We can also get monthly temperature data from the Met Office for the same epoch for stations scattered evenly above the UK. From these it is easy to calculate a scatter plot of average daily mortality rate as a function of monthly mean temperature and we can do a least square fit of a quadratic function on it. It turns out this quadratic has a minimum at 26.74°C, that is, as annual average temperature of the UK is currently under 10°C, any conceivable warming would decrease mortality there, even in summertime (warmest month in this period was July 2006 with 18.4°C).
What is more, there are very few places on the entire globe where monthly mean temperature exceeds 26.74°C for any month of the year.
Therefore if human lives are to be saved, we should clearly go for higher temperatures. That's not to say a heat wave can't kill, but as global average temperature is below 15°C, in a warming world number of lives saved from death by cold would always exceed the number killed by heat as long as we don't have more than 10°C increase in global average temperature. And no one is projecting that much under any reasonable scenario.
It turns out this quadratic has a minimum at 26.74°C, that is, as annual average temperature of the UK is currently under 10°C, any conceivable warming would decrease mortality there, even in summertime (warmest month in this period was July 2006 with 18.4°C).
What is more, there are very few places on the entire globe where monthly mean temperature exceeds 26.74°C for any month of the year.
Therefore if human lives are to be saved, we should clearly go for higher temperatures. That's not to say a heat wave can't kill, but as global average temperature is below 15°C, in a warming world number of lives saved from death by cold would always exceed the number killed by heat as long as we don't have more than 10°C increase in global average temperature. And no one is projecting that much under any reasonable scenario.
-
muoncounter at 02:06 AM on 7 March 2011A Real-World Example of Carbon Pricing Benefits Outweighing Costs
Gilles: "Peak oil is not due to the lack of oil, it is due to the lack of CHEAP oil." Wow, that's a deja vu. In the late 70s, we said 'there's plenty of $50 oil;' during the 1985 price collapse, there was 'plenty of $20 oil.' If you believe that all it takes is higher prices and there's suddenly plenty of oil, you fundamentally do not understand the oil business. To think, 'now that the price is higher, oil companies will just go get all the rest of that oil,' is a bit like telling the starving giraffe that he would have plenty of food if only he could grow a longer neck. That's a 'Drill, baby, drill' level of misconception. The problem is not that peak oil came and went; the problem is that peak energy demand has not. Here is an energy production forecast from USEIA: Total energy production continues its unabated rise, with an optimistic view of liquids: "Production increases are expected from onshore enhanced oil recovery (EOR) projects, shale oil plays, and deepwater drilling in the Gulf of Mexico."
But the worst aspect of this forecast is the inexorable increase in energy produced (primarily for generation of electricity) from coal. To go with that is their CO2 emissions forecast:
Total energy production continues its unabated rise, with an optimistic view of liquids: "Production increases are expected from onshore enhanced oil recovery (EOR) projects, shale oil plays, and deepwater drilling in the Gulf of Mexico."
But the worst aspect of this forecast is the inexorable increase in energy produced (primarily for generation of electricity) from coal. To go with that is their CO2 emissions forecast:
 After falling 3 percent in 2008 and nearly 7 percent in 2009, largely driven by the economic downturn, energy-related CO2 emissions do not return to 2005 levels (5,980 million metric tons) until 2027.
As if that was good news.
After falling 3 percent in 2008 and nearly 7 percent in 2009, largely driven by the economic downturn, energy-related CO2 emissions do not return to 2005 levels (5,980 million metric tons) until 2027.
As if that was good news.
-
RickG at 02:03 AM on 7 March 2011Icing the Medieval Warm Period
Tom, If I may add in support of your graph (NZ temp. anomaly), the NASA/GISS temp anomaly's for 3 distinct latitudes. The leveling or slight decline of temperatures in the northern hemisphere from 1940 to 1970 is attributed to uncontrolled sulfate aerosol emissions. Those aerosols being very short-lived in the atmosphere certainly would not be as prevalent in the southern latitudes and would not mask the CO2 effects of increasing CO2 nearly as much.
-
Tom Curtis at 01:37 AM on 7 March 2011Blaming the Pacific Decadal Oscillation
Timothy Chase @39: "The temperature isn't suddenly going to jump up to its Charney equilibrium. The warming due to greenhouse gases is the result of a net, small imbalance in rate at which energy in the form of radiation enters the system. Greenhouse gases -- such as water vapor -- will reduce the rate at which energy escapes to space, but the rise in temperature due to water vapor feedback would -- like the warming due to carbon dioxide -- take years." A very good point, that I did not think of. (That's the advantage of not being an expert - I get to make silly mistakes every now and then.) However, I am still not happy with the story that the increase in mean global temperatures is just due to atmospheric heat transport from the warm El Nino waters. For a start, during El Ninos, the water surrounding Australia is cooler than normal, yet Australia tends to be hotter than normal. That is probably due to reduced cloud cover, but that means feedback effects can still be a significant factor. -
Tom Curtis at 01:26 AM on 7 March 2011Icing the Medieval Warm Period
DB @66, may I suggest you leave it up until WB posts his screenshot at his blog, then I can post a screen shot of your response at his blog. -
Tom Curtis at 01:24 AM on 7 March 2011Icing the Medieval Warm Period
Gilles @65, yes, that is exactly what I would expect. New Zealand temperatures, after being flat for the first part of the 20th century started to rise in the 1930's. Glaciers do not care what causes the temperature to rise, they only respond to that rise.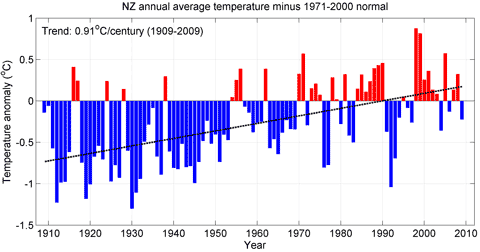 Further more, in 1930, the CO2 concentration was 306.6 (Law Dome), generating a total additionaly forcing in excess of 1750 levels of 0.54 w/m^2, or half that in 1980 (or a third that in 2000). For comparison, the net incease in solar forcing from its lowest point in the 19th century to its highest in the twentieth is just over 0.3 w/m^2.
Once again, the claim that because global temperatures do not fall out of the confidence interval of natural forcings alone until after 1980, that therefore anthropogenic forcings are inconsequential before that is a fallacy, and shows the person making the claim does not know what a confidence interval is. In fact, it is transparently a fallacy because the models also show that:
1) The temperature does not fall outside the confidence interval of combined anthropogenic and natural forcings over the same period;
2) The combined anthropogenic and natural forcings predict a higher temperatures than natural forcings alone (thus shown the anthropogenic forcings to be significant); and
3) The temperature tends to lie near the center of the anthropogenic and natural forcings, but on the extreme limit of the confidence interval of natural forcings alone.
Further more, in 1930, the CO2 concentration was 306.6 (Law Dome), generating a total additionaly forcing in excess of 1750 levels of 0.54 w/m^2, or half that in 1980 (or a third that in 2000). For comparison, the net incease in solar forcing from its lowest point in the 19th century to its highest in the twentieth is just over 0.3 w/m^2.
Once again, the claim that because global temperatures do not fall out of the confidence interval of natural forcings alone until after 1980, that therefore anthropogenic forcings are inconsequential before that is a fallacy, and shows the person making the claim does not know what a confidence interval is. In fact, it is transparently a fallacy because the models also show that:
1) The temperature does not fall outside the confidence interval of combined anthropogenic and natural forcings over the same period;
2) The combined anthropogenic and natural forcings predict a higher temperatures than natural forcings alone (thus shown the anthropogenic forcings to be significant); and
3) The temperature tends to lie near the center of the anthropogenic and natural forcings, but on the extreme limit of the confidence interval of natural forcings alone.
 The natural interpretation of that is that, on the evidence:
1) Both anthropogenic and natural forcings are significant in the early part of the 20th century;
2) Natural forcings have a 5% or less chance of explaining early twentieth century temperature alone;
3) Natural forcings have virtually no chance of explaining temperatures in the late twentieth century alone;
4) Anthropogenic forcings combined with natural forcings have a better than 66% chance of explaining temperatures across the whole twentieth century without involving any other factor;
5) There is a 33% chance or less that some other factor is involved, but it must explain only a small part of the variation; and
6) Anthropogenic forcings are dominant in the late 20th century.
Once you accept these 6 facts, you will find you no longer need to distort science to accommodate your world view.
The natural interpretation of that is that, on the evidence:
1) Both anthropogenic and natural forcings are significant in the early part of the 20th century;
2) Natural forcings have a 5% or less chance of explaining early twentieth century temperature alone;
3) Natural forcings have virtually no chance of explaining temperatures in the late twentieth century alone;
4) Anthropogenic forcings combined with natural forcings have a better than 66% chance of explaining temperatures across the whole twentieth century without involving any other factor;
5) There is a 33% chance or less that some other factor is involved, but it must explain only a small part of the variation; and
6) Anthropogenic forcings are dominant in the late 20th century.
Once you accept these 6 facts, you will find you no longer need to distort science to accommodate your world view.
-
RickG at 01:03 AM on 7 March 2011Blaming the Pacific Decadal Oscillation
A Google Scholar search using the words "El Nino humidity" reveals a plethora of papers discussing the relationship. -
Alexandre at 00:07 AM on 7 March 2011A Real-World Example of Carbon Pricing Benefits Outweighing Costs
Marcus #58 I'm interested about that algae biofuel price you mentioned. Do you have some reference or link? -
muoncounter at 00:06 AM on 7 March 2011Blaming the Pacific Decadal Oscillation
RW1: "if a mere natural 'oscillation' can cause as much as a 0.5 C spike in global average temperatures in one year ... " Now you are making a major assumption with the contention that all of ENSO is an entirely natural oscillation. From Yeh et al 2009: Using calculations based on historical El Nin˜o indices, we find that projections of anthropogenic climate change are associated with an increased frequency of the CP-El Nin˜o compared to the EP-El Nin˜o. ... the occurrence ratio of CP-El Nin˜o/EP-El Nin˜o is projected to increase as much as five times under global warming. "why couldn't slower natural oscillations cause most of the 0.6 C warming in the 20th century? " Here you're assuming that such slow oscillations exist at all, let alone in sufficient amplitude to 'cause' any such change. Then you'd have to explain why 'slow' oscillations cause rapid temperature increase in a pattern that accelerates (increases in rate of change) towards the Arctic. It would be interesting indeed if you applied the same zeal that you've shown for testing forcing theory to Spencer's calculations referenced in the context of Figure 3 of this post. That would be the skeptical thing to do. -
Ken Lambert at 23:27 PM on 6 March 2011Climate Sensitivity: The Skeptic Endgame
#96 BP So how does your analysis relate to the purported TOA warming imbalance currently about 0.9W/sq.m? Does it increase with projected levels of CO2 from a 'do nothing emissions scenario going forward? Or does it start to decrease from herein? What would be your suggestion of the surface temperature increase at equilibrium?? -
Marcus at 22:40 PM on 6 March 2011A Real-World Example of Carbon Pricing Benefits Outweighing Costs
Oh, to give you an inkling of why electric cars are better than conventional ones. An average electric car gets uses 15kw-h of electricity per 100km of travel (though most current models use closer to 10-12kw-h). In Australia, electricity currently costs $0.30c per kw-h. So an electric car here would cost about $4.50 per 100km of travel. By contrast, a petrol powered vehicle consumes about 9L of petrol per 100km of travel (assuming highway travel) & petrol currently costs about $1.30 per liter. So a conventional vehicle would cost about $11.70 per 100 km of travel. Not hard to see which is the cheaper alternative-especially as the price of oil continues to rise. -
Marcus at 22:34 PM on 6 March 2011A Real-World Example of Carbon Pricing Benefits Outweighing Costs
"It's just more and more expensive, and the economy cannot afford a 100 ou 200 $ barrel without a strong recession. Replacing an expensive resource by another expensive resource is obviously hardly an "opportunity"." Man, there are so many things wrong with this comment I really don't know where to begin. Peak oil is *exactly* the reason why we shouldn't be wasting what oil we have left on inefficiently transporting people, 1 person to a car, using the most inefficient form of transportation currently available-cars propelled by internal combustion engines. If we're going to use conventional oil at all, it should *only* be in those parts of the economy where nothing else will suffice. In the rest of the transportation network, we should be looking at switching people to mass transit and/or vehicles that run on electricity-preferably supplied from renewable sources. Of course electric vehicles are currently far less expensive to run than petrol powered vehicles, due to lower maintenance costs & better "fuel" efficiency of the former. As to algal biomass derived bio-diesel-test bed facilities in the US have already proven that bio-diesel derived from algal biomass can be achieved at significantly lower cost than from conventional oil-with prices as low as $20 per barrel once commercial scale operations are achieved. Of course this is easy to believe when you consider that the oil is being produced from waste emissions-so are not costing any extra money, & that the energy required to extract & process the oil in algae is far, far less than that required to extract & refine conventional oil. So, yes, I do see a cap-&-trade system as an opportunity, given that it will provide us with the opportunity to *finally* make our transport network more efficient & less carbon-intensive. -
Gilles at 21:25 PM on 6 March 2011A Real-World Example of Carbon Pricing Benefits Outweighing Costs
"You see, every so-called problem is really just an opportunity in disguise." Rob : I know, peak of conventional oil has probably already occurred - unconventional "all liquids" may still have a small margin for progression however. marcus : Peak oil is not due to the lack of oil, it is due to the lack of CHEAP oil. There is still plenty of oil underground. It's just more and more expensive, and the economy cannot afford a 100 ou 200 $ barrel without a strong recession. Replacing an expensive resource by another expensive resource is obviously hardly an "opportunity". -
Marcus at 20:50 PM on 6 March 2011A Real-World Example of Carbon Pricing Benefits Outweighing Costs
"I'm sure most people are aware that oil is a necessary component of both food transport and industrialized farming methods (heavy machinery, artificial fertilizer production etc)." Well of course there is a fairly obvious solution. High Density Vertical growth chambers filled with algae can be used to sequester the CO2 & NO2 generated from the production of electricity from natural gas. This algae can then be used as both a source of bio-diesel & a natural fertilizer or high-protein feed for animals-thus the agricultural sector with carbon neutral versions of its key requirements-thus avoiding the need for higher food prices. Also, if farmers want to earn extra income under a cap-&-trade system, they can do so by (a) planting trees, (b) allowing some of their land to be set aside for Wind Turbines or PV panels & (c) using crop & animal waste to produce methane-methane that can be used to provide electricity & heat for towns & cities. You see, every so-called problem is really just an opportunity in disguise. -
Rob Painting at 20:02 PM on 6 March 2011A Real-World Example of Carbon Pricing Benefits Outweighing Costs
Gilles - Note : FAO food index is much better correlated with the price of oil than with the average temperature of the world. I'm sure most people are aware that oil is a necessary component of both food transport and industrialized farming methods (heavy machinery, artificial fertilizer production etc). Of course there's going to be some correlation. if peak oil happens soon Done & dusted Gilles. It happened in either 2005 or 2006 (depending on which official estimate you choose). Peak oil refers to the peak rate of extraction, it doesn't refer to the price of oil. -
williambaskerville at 19:57 PM on 6 March 2011Icing the Medieval Warm Period
@ Moderator [ - Complaining about moderation removed - ]Moderator Response: [Daniel Bailey] As it was pointed out to you previously, it is not ad hominem to show an argument as being silly, which was done in relation to your statements. Complaining about having to comply with the Comments Policy adds nothing to the dialogue here & thus begs for moderation. I will leave this up for a time so you have a chance to see it & will then remove it. No one wants to stifle dialogue that's on-topic and complies with the Comments Policy. Thanks! -
Paul D at 19:49 PM on 6 March 2011A Real-World Example of Carbon Pricing Benefits Outweighing Costs
"Strikes me whatever the evidence CO2 emissions aren't stopping any time soon unless some miracle happens so all these discussions really are academic. Suspect it is probably prudent to start planning adaptation, with clear goals of carbon sequestration (this would a miracle or an enigma size effort), rapid transformation to a low energy use none fossil fuel society." You do both. Cut emissions and plan to adapt for current warming. In that respect the discussion is not academic. The fact that discussions focus on one aspect do not mean people and governments ignore the wider issues. The UK is put together adaptation plans as well as plans to cut emissions. -
Timothy Chase at 19:20 PM on 6 March 2011Blaming the Pacific Decadal Oscillation
RW1 wrote in 28:"Temperatures after the '98 el Nino were the same as they were going in. No net heat increase. Oscillations have no input to the trend." Why not? Why doesn't the increase in temperatures set off the 'positive feedbacks' and make temperatures go higher and stay higher? If water vapor and cloud feedbacks, which operate on the order of days to weeks (or even hours), are positive as claimed by the AGW hypothesis, why did the temperatures come back down so quickly?
Ok, you raise temperatures and this causes water to evaporate, and like the greenhouse gas that it is (as you can see here) it reduces the rate at which energy escapes the top of the atmosphere. Now what? The temperature isn't suddenly going to jump up to its Charney equilibrium. The warming due to greenhouse gases is the result of a net, small imbalance in rate at which energy in the form of radiation enters the system. Greenhouse gases -- such as water vapor -- will reduce the rate at which energy escapes to space, but the rise in temperature due to water vapor feedback would -- like the warming due to carbon dioxide -- take years. And likewise you won't have the full rise in water vapor from increased levels of carbon dioxide right away. Part of the increase in levels of water vapor in the atmosphere is a response to higher temperatures that are themselves the result of higher levels of water vapor. Unlike the spike in temperature that results from an El Nino, much of the carbon dioxide that we emit will remain in the atmosphere for years, decades and even millenia. Raise the temperature of an object and it will emit more radiation. The warm water of the El Nino emits thermal radiation a higher rate than cooler ocean water. But it doesn't reduce the rate at which energy leaves the system. Carbon dioxide does -- and it will continue to do so until the system warms up, increasing the rate at which radiation is emitted so that the system achieves equilibrium at a higher temperature. However, the equilibrium due to carbon dioxide alone is lower than the equilibrium of carbon dioxide plus water vapor. And if the system cools down due to the negative feedback where a warmer object emits more radiation, increasing the rate at which it cools (the Planck feedback) then this will bring temperatures down before temperature has the chance to rise significantly due to increased water vapor. When the temperature drops this reduces the humidity of saturation and the extra water vapor will fall out of the atmosphere in the form of precipitation. RW1 asked:Also, please explain how global temperature spikes coming down so quickly, such as those that occur during el Nino events, is inconsistent with net negative feedback operating on the climate system?
It isn't. And you do have a negative feedback: Planck feedback. A hot object emits radiation proportional to the absolute temperature raised to the fourth power. That happens pretty much right away. Increased levels of carbon dioxide due to higher temperatures reducing the capacity of the ocean to hold carbon dioxide? That would take centuries. In the absence of a long-term forcing such as that due to the Milankovitch cycle or higher levels of carbon dioxide due to the emissions of some supervolcano Planck feedback wins. But once carbon dioxide is in the atmosphere much of it tends to stay there for a long time. Now you tell me: if you don't have the full water vapor, cloud or sea ice response to an increase in temperature until several decades after the imposition of a new forcing to the climate system, what does the rate at which at which the climate system cools off after an El Nino have to say about whether there is a net positive or negative feedback? Beyond the Planck feedback, whatever the feedback (water vapor, clouds or melting sea ice) it really hasn't had a chance to affect the system since such feedbacks result in only a small imbalance in radiation entering the system over radiation escaping the system and the heat content and temperature of the system will rise only gradually, significantly only if this imbalance is maintained. -
Timothy Chase at 19:03 PM on 6 March 2011Blaming the Pacific Decadal Oscillation
Tom Curtis wrote in 30:As I understand it, global temperatures peak sometime after the peak of the El Nino or La Nina they are associated with. That lag shows the effect of the El Nino or La Nina is not just the effect of the change of Sea Surface Temperatures on the global average. There must be a feed back involved.
The strength of the El Nino is measured by temperature in the tropics. However, just because the temperature in the tropics begins to drop precipitously doesn't mean that the water from the El Nino is losing all of its heat to the atmosphere. The warm water spreads out, circulating beyond the tropics, raising the temperature of the ocean beyond the tropics (which figures into the average global land and ocean temperature) and increasing the surface area that is exposed to the atmosphere, raising the temperature of the atmosphere over the ocean, and due to atmospheric circulation raising the temperature of the atmosphere over land as well. We really aren't talking feedback at this point. Somewhat higher levels of water vapor? Sure. But for the full feedback and effects of this to be felt from a new forcing that forcing must be maintained over a substantial period of time. And the full rise in the levels of water vapor will take essentially the same length of time. -
Gilles at 18:57 PM on 6 March 2011Icing the Medieval Warm Period
Tom : "So, what I can find is not a trend downward that starts in 1998, but an overall 50% loss of NZ glacier mass balance starting in the early 1930's. Out of that massive decline, you were only able to find a few cherry picked upward slopes, the longest of which is less than 10 years long. " But this is NOT what you would expect, if this decrease were caused by the anthropic forcings that are supposed to exceed significantly the natural ones only after 1970 ? about flattening : what is certain is that there is no sign of significant acceleration since 1970. Do you have an idea of how much acceleration is needed before the warming becomes "dangerous" ?
Moderator Response: [DB] Enabled inline graphic.
about flattening : what is certain is that there is no sign of significant acceleration since 1970. Do you have an idea of how much acceleration is needed before the warming becomes "dangerous" ?
Moderator Response: [DB] Enabled inline graphic. -
Chief Hydrologist at 18:35 PM on 6 March 2011Blaming the Pacific Decadal Oscillation
It should rather be the Interdecadal Pacific Oscillation -because it is a basin wide multidecadal phenomenon that acts through modulation of the intensity and frequency of ENSO. Cloud cover changes in the tropical and subtropical regions are most strongly influenced by sea surface temperature. SST is most strongly influenced by ENSO+PDO. Observational evidence shows cloud cover and optical depth decreasing following the great Pacific climate shift in 1976/1977 to the late 1990's and increasing thereafter (Burgmann et al 2008, Clements et al 2009, Norris 2005) - consistent with these multidecadal changes in SST. These changes are consistent with the trends of ERBS, ISCCP and HIRS radiative flux data showing a decreasing trend in reflected shortwave and an increase in emitted longwave from the mid 80's to the late 1990's. There seems to have been a decrease in Pacific cloud cover in the late 1970's and an increase in the late 1990's - which if you anywhere near accept the quantum of the satellite data dominated warming in the period. I do have a recent post here - http://judithcurry.com/2011/02/09/decadal-variability-of-clouds/ -
Tom Curtis at 18:27 PM on 6 March 2011Blaming the Pacific Decadal Oscillation
RW1 @33: "How do you figure a lag means there must be a feedback involved? Let alone positive feedback?" If it was not a feedback mechanism, the global temperature effects would exactly coincide with the temperature effects on the surface of the pacific ocean, and would equal the surface temperature effects on the tropical pacific divided by the area effected. As it happens, the maximum global temperature effect lags the maximum surface temperature effect in the Pacific, and is larger than the proportional change in SST. Because the global temperature response lags ENSO, the causal direction must be ENSO -> global temperature response, rather than the other way round. Hence, it is a feedback. "You're making an awfully lot of assumptions here. What causes the SST cooling and warming (i.e. what causes El Ninos and La Ninas?)?" No assumptions. The increase of globally averaged specific humidity with El Ninos (and decrease with La Ninas) is a well known phenomenon. The 1998 spike in humidity is as obvious as the spike in temperature. Further, the connection between high humidity and high temperatures is also well established by theory and observation. El Ninos and La Ninas are caused by variations in the strength of the Walker circulation, which are in turn driven by changes in the relative temperature between the Eastern and Western tropical pacific. So, the Walker circulation in effect acts as a feedback mechanism to that variation. What causes the initial variations is more dubious, with a number of factors implicated (and it is unlikely to be a single factor). "Again, you're making a HUGE number of assumptions here. How do you know that the response of EL Nino SO wouldn't be even stronger if were not for negative feedbacks opposing it? If you claim a +2 C over about one third of the planet caused a 0.5 C global average warming, how is that consistent with positive feedback? One third of 2 C is 0.67 C - more than the 0.5 C that occurred." Again, I know that it is a positive feedback because of the relative magnitude of the response. The maximum area affected by an El Nino is approximately one ninth of the Earth's surface. This excludes those parts of the Pacific that are cooled in an El Nino, which if included would weaken the calculated initial response (and hence strengthen the calculated feedback). The minimum area warmed is about 1/27th of the Earth's surface. It is difficult to estimate the total area warmed, but with very high confidence it lies between these two extremes. So, 2 degrees over one ninth of the Earth's surface, globally averaged is 0.22 degrees, much less than the 0.5 degree global increase. Hence the feedback must be positive. And that is the very conservative estimate, as it allows the maximum possible warming extent, and does not consider the cooling at other regions. Again the caveat, this is beer coaster mathematics, and only indicates ball parks. It is certainly accurate enough to show the sign of the feedback, but not accurate enough to narrow the magnitude significantly. None-the-less, the correlation does hold that the stronger the effect of ENSO on global temperatures, the stronger the positive feedback involved, and hence the stronger the positive feedback from CO2 induced warming. @ 34: Perhaps it will make it easier when you remember that a positive feedback enhances both warming from an initial warming, and cooling from an initial cooling. The return of Pacific SSTs to normal values after an El Nino is a cooling, of equal magnituded to the initial warming. It will therefore generate a cooling feedback of equal magnitude to the initial warming feedback, thus cancelling it out.
Prev 1860 1861 1862 1863 1864 1865 1866 1867 1868 1869 1870 1871 1872 1873 1874 1875 Next


