


 Arguments


Recent Comments
Prev 1861 1862 1863 1864 1865 1866 1867 1868 1869 1870 1871 1872 1873 1874 1875 1876 Next
Comments 93401 to 93450:
-
Gilles at 18:16 PM on 6 March 2011A Real-World Example of Carbon Pricing Benefits Outweighing Costs
yes but ... the fossil fuel prices will increase anyway, since unconventional resources can become profitable only with much higher prices. So there is a real paradox here : carbon tax is supposed to be efficient to avoid an increase of fossil fuel consumption, which could happen only if prices get higher ... much higher than any reasonably acceptable tax , actually. So why the natural increase of the resource price would not be enough? actually if peak oil happens soon, it seems that IT IS. Modern economy relies on cheap FF, and it may well be that it can simply not afford to high prices. Note : FAO food index is much better correlated with the price of oil than with the average temperature of the world. -
actually thoughtful at 17:39 PM on 6 March 2011A Real-World Example of Carbon Pricing Benefits Outweighing Costs
The biggest failure of the anti Cap-and-Trade crowd is they assume that Americans will not respond to the increased price. So they assume Americans will just pay more for energy, instead of being motivated, by the increased savings in energy money, to reduce their costs. Indeed, the best way to motivate my fellow Americans is to explain they can avoid a "tax" by becoming more energy efficient. You will unleash the most powerful economic force in the history of civilization on earth: Americans desire to avoid taxes. The truth is there is some low lying fruit. A lot of of it. Inertia, and "cheap" fossil fuel keep that fruit rotting on the vine. Increase the marginal cost of fossil fuel, and people will be motivated to take action. The ACTUAL effect of increased energy prices is 1) more jobs and 2) people pay LESS for energy. This is somewhat counter-intuitive, but the trick to understanding it is to realize how much we can do. Look at your own home. Are windows R-5 or higher? Do you use the sun to heat your home and water? Do you use the sun or wind to create electricity? Are the walls insulated to R25 or higher and ceiling to R-40 or higher? Have you planted trees to shade the home in summer, and allow sunlight in during winter? Are all appliances Energy Star rated? Lightbulbs CFL or LED? All those energy conservation things pay for themselves in under 5 years. The active systems yield bigger paybacks, but also cost more and tend to take between 10 and 20 years to payoff (no subsidies). Active system life is 40+ years. After you factor in OPM (other people's money) the payback time is greatly reduced. You might think that OPM has its limits, but governments are well positioned to recognize the savings in things they pay for (healthcare, subsidized food, subsidized oil, wars for oil, etc.) and reward behavior changes in the energy sector and still be better off. This is yet another case where the narrative has been seized by people who can't or won't think things through beyond the very first move (a tax increases costs). If they thought about what happens in the 3rd iteration (lower costs to building owners, lower pollution=lower costs to government, higher employment) they would run out of rational objections. But that is not how policy makers think on this subject. We have master of tiddlywinks, when Chess or better thinkers are required. -
dana1981 at 17:30 PM on 6 March 2011A Real-World Example of Carbon Pricing Benefits Outweighing Costs
Agnostic, the article says RGGI only applies to the power sector. Unfortunately it's not a very ambitious system. -
Blaming the Pacific Decadal Oscillation
RW1 > One third of 2 C is 0.67 C - more than the 0.5 C that occurred. He said "less than one ninth" not one third. -
RW1 at 17:24 PM on 6 March 2011Blaming the Pacific Decadal Oscillation
Tom (RE: 32), "Assume an initial warming of the ocean has caused in increase in water vapour, and hence an enhanced greenhouse effect. The total amount of water vapour in the atmosphere will be the product of both the initial warming of the ocean, plus the feedback. If that initial warming is then removed by a change in the oscillation, the water vapour will now reduce to the amount appropriate for just the feedback warming. But that reduces the feedback, and hence the amount of water vapour, and so on. Consequently the temperature will relax back to the equilibrium state." I don't get it. I do understand that if an 'oscillation' causes an increase in temperature and then the 'oscillation' subsides or ceases, the temperature would decrease some, but I don't understand how with net positive feedback, why temperatures would decrease back to pre-oscillation - let alone decrease back so quickly. Furthermore, if a mere natural 'oscillation' can cause as much as a 0.5 C spike in global average temperatures in one year, why couldn't slower natural oscillations cause most of the 0.6 C warming in the 20th century? -
RW1 at 17:07 PM on 6 March 2011Blaming the Pacific Decadal Oscillation
Tom (RE: 30), "As I understand it, global temperatures peak sometime after the peak of the El Nino or La Nina they are associated with. That lag shows the effect of the El Nino or La Nina is not just the effect of the change of Sea Surface Temperatures on the global average. There must be a feed back involved." How do you figure a lag means there must be a feedback involved? Let alone positive feedback? "However, El Ninos,ie, the condition with warm tropical Pacific SSTs is associated with warmer global temperatures. In contrast, La Ninas, with their cool SSTs, are associated with cool global temperatures. Therefore the feedback must be positive. The most likely cause would be increased water vapour during El Nino's driving increased heat by an enhanced greenhouse effect, and decreased water vapour during La Ninas having the opposite effect. The effect is short lived because the conditions that drive the feedback are short lived. After the SSTs return to normal, water vapour levels return to normal, and with it the the variation in the greenhouse effect. This picture is at least partly complicated by cloud albedo effects, with temperature variations in Australia in particular being driven by cloud albedo rather than water vapour feedback. You're making an awfully lot of assumptions here. What causes the SST cooling and warming (i.e. what causes El Ninos and La Ninas?)? "Denier's should be very worried about this pattern. IN 1997 an average 2 degree anomaly over less than one ninth of the Earth's surface caused a 0.5 degree excursion in the Global Mean Temperature. An equivalent excursion to a forcing causing a 1.2 degree increase in global temperatures (ie, a doubling of CO2) would cause a global temperature increase of between 2.7 and 8.1 degrees C. That is a very rough calculation of climate sensitivity, but it shows that appealing to El Ninos should give deniers no cause for comfort. The stronger the climate response to the EL Nino Southern Oscillation, the stronger the climate response to CO2 forcing." Again, you're making a HUGE number of assumptions here. How do you know that the response of EL Nino SO wouldn't be even stronger if were not for negative feedbacks opposing it? If you claim a +2 C over about one third of the planet caused a 0.5 C global average warming, how is that consistent with positive feedback? One third of 2 C is 0.67 C - more than the 0.5 C that occurred. -
Tom Curtis at 17:03 PM on 6 March 2011Blaming the Pacific Decadal Oscillation
RW1: "If the feedback is positive in response to temperature increases, why doesn't that keep temperatures higher?" Assume an initial warming of the ocean has caused in increase in water vapour, and hence an enhanced greenhouse effect. The total amount of water vapour in the atmosphere will be the product of both the initial warming of the ocean, plus the feedback. If that initial warming is then removed by a change in the oscillation, the water vapour will now reduce to the amount appropriate for just the feedback warming. But that reduces the feedback, and hence the amount of water vapour, and so on. Consequently the temperature will relax back to the equilibrium state. The equilibrium state is determined by the balance of energy coming in by radiation from the sun, and the energy going out by IR radiation (along with energy flows between regions for regional temperatures). -
RW1 at 16:45 PM on 6 March 2011Blaming the Pacific Decadal Oscillation
Bibliovermis (RE: 29), "The oscillations do not add energy to the system, but merely move it around. This is why global feedback effects are not relevant." How do you figure? And how do you know that 'the oscillations', such as el Ninos, are not the result of energy being added to the system? The point is temperatures do spike and clouds and water vapor operate in response to temperature changes - do they not? If the feedback is positive in response to temperature increases, why doesn't that keep temperatures higher? -
Tom Curtis at 16:39 PM on 6 March 2011Blaming the Pacific Decadal Oscillation
RW1: As I understand it, global temperatures peak sometime after the peak of the El Nino or La Nina they are associated with. That lag shows the effect of the El Nino or La Nina is not just the effect of the change of Sea Surface Temperatures on the global average. There must be a feed back involved. However, El Ninos,ie, the condition with warm tropical Pacific SSTs is associated with warmer global temperatures. In contrast, La Ninas, with their cool SSTs, are associated with cool global temperatures. Therefore the feedback must be positive. The most likely cause would be increased water vapour during El Nino's driving increased heat by an enhanced greenhouse effect, and decreased water vapour during La Ninas having the opposite effect. The effect is short lived because the conditions that drive the feedback are short lived. After the SSTs return to normal, water vapour levels return to normal, and with it the the variation in the greenhouse effect. This picture is at least partly complicated by cloud albedo effects, with temperature variations in Australia in particular being driven by cloud albedo rather than water vapour feedback. Denier's should be very worried about this pattern. IN 1997 an average 2 degree anomaly over less than one ninth of the Earth's surface caused a 0.5 degree excursion in the Global Mean Temperature. An equivalent excursion to a forcing causing a 1.2 degree increase in global temperatures (ie, a doubling of CO2) would cause a global temperature increase of between 2.7 and 8.1 degrees C. That is a very rough calculation of climate sensitivity, but it shows that appealing to El Ninos should give deniers no cause for comfort. The stronger the climate response to the EL Nino Southern Oscillation, the stronger the climate response to CO2 forcing. -
Bibliovermis at 16:22 PM on 6 March 2011Blaming the Pacific Decadal Oscillation
RW1, The oscillations do not add energy to the system, but merely move it around. This is why global feedback effects are not relevant. -
RW1 at 15:48 PM on 6 March 2011Blaming the Pacific Decadal Oscillation
muoncounter (RE: 22) "Temperatures after the '98 el Nino were the same as they were going in. No net heat increase. Oscillations have no input to the trend." Why not? Why doesn't the increase in temperatures set off the 'positive feedbacks' and make temperatures go higher and stay higher? If water vapor and cloud feedbacks, which operate on the order of days to weeks (or even hours), are positive as claimed by the AGW hypothesis, why did the temperatures come back down so quickly? Also, please explain how global temperature spikes coming down so quickly, such as those that occur during el Nino events, is inconsistent with net negative feedback operating on the climate system? -
Riduna at 15:48 PM on 6 March 2011A Real-World Example of Carbon Pricing Benefits Outweighing Costs
Alexandre @ 4 In some ways, a carbon tax (CT) may be preferable to cap and trade (ETS) but a CT is less cost efficient and effective in reducing CO2 emissions, which is the primary purpose of pricing carbon. 1. With a CT, the price of carbon is set by government (bureaucrats) rather than by the market. Why is market pricing more important? Because as the level of CO2 reduction increases and becomes more difficult to achieve, the carbon price fluctuates and increases. This continuing change in the price of carbon is best determined by an informed market than by government. 2. By itself, a CT does no more than “encourage” CO2 emitters and energy users to reduce emissions, except a desire to avoid paying a CT. There is no “compulsion” for them to do so, nor is government required to set a reduction target and act to achieve that target. An ETS is just the opposite. It does require government to publicly state annual and longer term emission reduction targets and it does require emitters to reduce their emissions or bear the cost of purchasing market-priced emission licenses to cover any shortfall in meeting the annual target. 3. An ETS gives certainty that CO2 emissions will be reduced, by how much, how fast and over what period - and it forces government and emitters to plan and set targets With a CT there is no such certainty, indeed the only certainty is the level of tax – and even that can be changed by a new government. 4. A CT can be made just as opaque as a poorly designed ETS scheme by being selectively applied, by paying off-setting subsidies to emitters, allowing tax rebates and other discriminatory practices. Some of these measures are applied with ingenuity and it was their proposed use which contributed to the defeat of Australian government proposals to price carbon in 2009/10. 5. Finally, is a Carbon Tax really a tax given that it is only levied on and paid by those directly responsible for CO2 emissions? It is not paid by any others earning a taxable income, though its effects in terms of higher energy bills may be paid by everyone. However, those least able to afford higher bills can be (and usually are) assisted by government. Perhaps a Carbon Tax would more accurately be described as a Carbon Levy or an Emissions Fee? -
Riduna at 15:41 PM on 6 March 2011A Real-World Example of Carbon Pricing Benefits Outweighing Costs
Dana: Thanks for an interesting article. However, it is difficult to determine how successful it has been in its primary purpose – reducing CO2 emissions – since the article does not tell us what emitters are subject to the RGGI. Does it include all industrial emitters and transport? Is RGGI applied uniformly by all participants? Which, if any direct CO2 emitters are excluded from the scheme? What adverse effects has the cap and trade scheme had and how have these been dealt with? Without this info, it is difficult to evaluate its success in terms of its effects on energy bills, employment and other effects on the economy, particularly any movement of businesses out of participating states (carbon leakage), which is not reported on. What is clear is that CO2 emissions are being reduced, revenue is being earned and applied to employment in new businesses, notably those which increase the efficiency with which energy is used by consumers. It should come as no surprise that cap and trade has been introduced by RGGI participants without bringing about the economic damage which critics of pricing carbon so loudly warn us of – usually without substantiating their claims. For the last 6 years, the European Union has shown that introduction of properly designed and administered mechanisms for pricing carbon does reduce CO2 emissions without damaging their economies. There is of course a difference between introduction of cap and trade in a state of the Union and in a country, such as Australia, Canada or the USA as a whole. Countries may find it necessary to include in the design of a cap and trade scheme, introduction of a “carbon tariff”, to protect domestic industry from unfair competition of imports produced in countries which do not effectively abate CO2 emissions. Although European countries have not felt a need to introduce a carbon tariff (yet), my prediction is that it will be introduced by those countries which are effectively reducing CO2 emissions as a protective measure against countries which are not. Such a tariff has the added benefit of persuading errant countries to curb their CO2 emissions, while protecting complying countries from carbon leakage. -
johnd at 15:33 PM on 6 March 2011Blaming the Pacific Decadal Oscillation
Riccardo at 00:36 AM, frequency would only be irrelevant if the situation you originally described was the case, that being "Whatever the impact of one phase might be, the opposite phase would have the opposite effect and after a full cycle the system would be brought back to where it was at the beginning.", however that would be to assume opposite phases to be mirror images of each other. The PDO, or any other such ocean atmosphere systems are based around geographic distribution of warmer and cooler SST's, and the difference between each phase is the relative location of the warmer waters versus the cooler waters. In addition there is also the relative location to adjoining land masses. In addition, within each phase there is also a "front" and a "back" where the system also manifests itself in different ways. Perhaps the easiest way to illustrate this is to consider that what El-Nino means to those on the eastern rim of the Pacific is what La-Nina means to those on the western rim. What then has to be also taken into account is that the surface of the planet is an irregular surface, with a very uneven distribution of land masses, and different ocean conditions, meaning that when the systems change phase, the physical environment also alters which then influences how the system interacts with the local and adjoining regions, thus determining how it ultimately manifests itself, and how that then controls the liberation or conservation of heat as it transfers between the ocean and the atmosphere, which then feeds into whether the ocean is gaining or losing heat in that particular location, during that particular phase. If identical circumstances were in play at either side of each phase, then perhaps I could see how things may balance out. But I suspect that they are not, and if that means things do not return to balance as each cycle completes, then a changing frequency becomes relevant. -
KR at 15:22 PM on 6 March 2011Blaming the Pacific Decadal Oscillation
TIS - Keep in mind, "It's just a jump to the left, then a step to the right". Oscillations don't add energy; they just move it around. The PDO is a redistribution, not an added amount of total energy such as we see in global warming. -
jyyh at 14:52 PM on 6 March 2011Blaming the Pacific Decadal Oscillation
An odd thought, while it's clear PDO (or AMO for that matter) cannot explain GW, could it relate to the speed of arctic amplification? This claim would base itself to the Bering strait flows, which at least in the summer are going mostly north for the warmer waters of the Pacific. Years back I thought that this PDO thing was somehow cleverly modified derivative of the overall GW signal, but looks like there is something else too, at least on regional (well continental) level. But still, if there's no predictive model there's not much use to an index. -
Marcus at 14:01 PM on 6 March 2011Blaming the Pacific Decadal Oscillation
Yes, Muon & Timothy, the point I meant was that the various ocean oscillations move heat energy around-both from one part of the ocean to another, & also between the ocean & the surrounding atmosphere-& vice versa. The point is that this heat energy isn't being created out of nothing-its heat energy that has already been added from another source. As an example, the 1998 El Nino was simply releasing a large amount of stored heat from the oceans into the atmosphere-probably accumulated over the previous decade or two-it didn't *create* that heat. Hope that makes more sense. -
Timothy Chase at 13:52 PM on 6 March 2011Blaming the Pacific Decadal Oscillation
The Inconvenient Skeptic wrote:In the 1998 event the average global temperature increased by more than 0.5C. That energy was not simply moved around the surface of the Earth. The La Nina did not create the energy, but it added energy to the surface and the atmosphere that wasn't at the surface before. So these events do add (or take) energy to the system.
If one's idea of "the climate system" is limited to the first couple of meters of the atmosphere and the first few centimeters of ocean, then yes, of course these events can add energy to "the system." However I doubt that this is what Marcus was thinking of when he posted his comment. By "climate system" I would assume he meant at least the first ten kilometers of atmosphere and more importantly the ocean that extends well below those first 10 centimeters where the temperature of the ocean is usually measured. On average the ocean goes down to a depth of over 2.6 miles and at its deepest 6.85 miles -- and unless you've found a wormhole its a pretty safe bet that the only way the ocean is going to heat up is if the rate at which energy is entering the climate system through the top of the atmosphere is greater than the rate at which energy is leaving the climate system through the top of the atmosphere. This is called "radiation balance theory" since the only way energy is going to enter or leave is as radiation. It is a cornerstone of climate science. But in terms of the balance of energy you can think of it as the principle of conservation of energy -- which Marcus alluded to when he said that climate oscillations cannot create energy -- they can only move it about. We know of course that other than the ups and downs of the solar cycle solar irradiance has been flat to falling since at least 1962. So it doesn't look like what explains the net increase of energy in the system lies with the rate at which energy is entering the system. So we have to look at the other side of the equation: the rate at which energy leaves the system. And we have a pretty good idea of what is happening there. Now if you are a regular here you have undoubtedly run into the essay Did global warming stop in 1998? (intermediate) which shows that more than 20X as much of the excess heat that has entered the climate system has gone into the ocean. Sometimes some of that heat comes back to the surface -- but as Marcus points out the climate oscillation didn't create that heat. The temperature of the ocean is increasing, including the deep ocean. And in fact the ocean is where the vast majority of the heating is taking place. If you just look at the surface or the atmosphere you are harboring a rather superficial view of the climate system. If so, you should probably venture a little further away from land some time. -
muoncounter at 13:51 PM on 6 March 2011A Real-World Example of Carbon Pricing Benefits Outweighing Costs
Blessthefall, "what good is it doing when China and India's emissions continue to rise?" US emissions are still 4x China and 10x India on a per capita basis. We have short memories. Fifty years ago the western US had terrible air pollution problems; thirty years ago it was eastern block Europe's Black Triangle. Both have cleaned up through tough emissions standards. If China et al admit that their Brown Clouds are a problem they can get started cleaning up, it will make the US even more unpopular. -
muoncounter at 13:25 PM on 6 March 2011Blaming the Pacific Decadal Oscillation
TIS "La Nina did not create the energy, but it added energy to the surface and the atmosphere that wasn't at the surface before. So these events do add (or take) energy to the system." That's just plainly untrue, as even a Spencer graph shows: Temperatures after the '98 el Nino were the same as they were going in. No net heat increase. Oscillations have no input to the trend.
-
The Inconvenient Skeptic at 12:50 PM on 6 March 2011Blaming the Pacific Decadal Oscillation
Marcus, Consider a strong La Nina event. The atmosphere starts neutral and the ocean starts to warm. As the SST increases and the area affected also increases the atmosphere starts to warm from convective and latent heat transfers. In the 1998 event the average global temperature increased by more than 0.5C. That energy was not simply moved around the surface of the Earth. The La Nina did not create the energy, but it added energy to the surface and the atmosphere that wasn't at the surface before. So these events do add (or take) energy to the system. I will also add that MacDonald's study was a tree-ring study that used results during a mega-drought. I would much rather trust a corral reconstruction for something like SST's. -
Marcus at 11:59 AM on 6 March 2011Blaming the Pacific Decadal Oscillation
As far as I understand it, the point here is that the PDO-like the NAO & the AO-cannot actually *create* energy within the system-all they do is move that energy around. If that is the case, then the PDO can't really be a *cause* of warming-it must surely be responding to another source of energy entering the system. -
Marcus at 11:49 AM on 6 March 2011A Real-World Example of Carbon Pricing Benefits Outweighing Costs
@BTF. If you will keep repeating the same fallacies-in multiple threads-over & over again, like an obstinate 5-year old, then that's exactly how I'm going to speak to you. That said, I didn't speak to you that way when I tried-very calmly-to explain why your claims are fallacious. You keep telling us that Coal, Oil & Nuclear are "cheap & efficient", yet at the end of the day all 3 energy sources consume a relatively expensive, non-renewable resource in a extremely thermally inefficient manner in order to generate energy. Given that the fuel sources also involve expensive & highly destructive extraction techniques-not to mention the extremely toxic by-products that their consumption generates-it becomes easy to see how your claims of "cheapness & efficiency" simply don't stack up. If they are so "efficient", then why is the majority of the fuel consumed without producing anything useful? (The most efficient Coal power stations only convert 35% of the energy released from the coal into electricity-the rest being lost as waste heat. The most efficient Nuclear Power stations (highly experimental gas-cooled varieties) only convert 50 % of the energy released into usable electricity. The most efficient Internal Combustion Engines only convert 20% of the energy released from petrol into forward momentum-the rest being lost as waste heat). If they're so cheap, then why do all 3 industries still demand massive subsidies from tax-payers-60-150 years after the technologies were first introduced? Modern Renewable Energy technologies have been around for as little as 30 years yet-with only a small fraction of the Government Support enjoyed by your "cheap & efficient" technologies-they've managed to achieve massive strides in efficiency, reliability & cost per kw-h. Now its true that some Oil companies might publicly promote a "belief" in AGW, or support for renewable energy technologies-but this is purely for PR purposes. Behind the scenes, the oil & coal industries are the biggest financial backers of those organizations most vociferously promoting "skepticism" about both AGW & the usefulness of renewable energy & energy efficiency measures-because whatever they might say publicly, they'll all do whatever it takes to protect their massive profit margins. -
Tom Curtis at 11:02 AM on 6 March 2011A Real-World Example of Carbon Pricing Benefits Outweighing Costs
ranyl @43, the increased price of oil is driven primarily the increased demand from India, and especially China. The increased prices will put a dent in that demand, but won't eliminate the factors that are driving it. However, if you think that it does not effect car purchases, consider this graph:
-
Rob Honeycutt at 10:59 AM on 6 March 2011A Real-World Example of Carbon Pricing Benefits Outweighing Costs
Blessthefall @ 38 said... "Rob, I don't see how one country reducing emissions will do anything if the rest of the world goes unchecked. It doesn't make any sense. Some say it's a "good place to start," but what good is it doing when China and India's emissions continue to rise?" I know this was for another Rob, but you might take note that China is putting huge amounts of money into renewable sources. Vastly more than we are. They want to develop those technologies so that they can sell them to us. We need to be doing the same in order to sell them the technologies they need. That's what we're good at but we're rapidly slipping in that area. Look, this is all a no-brainer. In coming decades the entire world will be involved in pricing carbon. Pricing it enables us to develop technologies for the future. By avoiding this we are risking our future standing as the leader of the modern economic world. -
Tom Curtis at 10:38 AM on 6 March 2011Icing the Medieval Warm Period
Williambaskerville @59, to answer my question of the prior post - evidently not. Trust you when shown the overall temperature trend once the influences of the solar cycle and ENSO to show the raw figures, and cherry pick the bit between the largest El Nino on record and a near record La Nina and talk about flattening. -
Tom Curtis at 10:32 AM on 6 March 2011Icing the Medieval Warm Period
williambaskerville, you may well like to look up the definition of "ad hominen". My comments indicated that a certain argument was silly, not that a particular person was. I also indicated that a particular activity was foolish. It is not ad hominen to say it is foolish to bang your head against the wall, even in the presence of somebody who is doing it. It is of course open to anybody to judge the foolishness or wisdom of that man if, after you have reminded them how foolish their activity is, they do not stop. Now on to your head banging ... The chart may only start in 1977, but you already have the comment of scaddenp @30 that the glacier's are in long term retreat. Also the comment of nigelj @45 (after your cherry picking post, but before your futile attempt to defend it) that, "Over the last 100 years the trend is most glaciers are retreating, or a nett decrease in ice mass. From NIWAS website." And, of course, and most crucially, you had from NIWA at the link provided with the graph where you foolishly cherry picked the upward trends, the comment that, " NIWA’s snowline surveys show an overall decrease in the glacier mass balance", and that:2. Despite the sensitivity of New Zealand glaciers to changes in both precipitation and temperature, the volume of ice in the Southern Alps dropped by roughly 50% during the last century. New Zealand’s temperature increased by about 1 °C over the same period. I would also point out that as you are trying to find an equivalent case to that studied by Koch & Clague, you needed a case in which there was wide spread regional glacier growth over the course of the century (such as they found in the MWP), and should yourself have checked whether NZ's glacier growth was century long, or just a few years or decades. Had you done so, you would have found out about the overall retreat of NZ glaciers:
 So, what I can find is not a trend downward that starts in 1998, but an overall 50% loss of NZ glacier mass balance starting in the early 1930's. Out of that massive decline, you were only able to find a few cherry picked upward slopes, the longest of which is less than 10 years long.
Do you think it might be wise to stop banging your head yet?
So, what I can find is not a trend downward that starts in 1998, but an overall 50% loss of NZ glacier mass balance starting in the early 1930's. Out of that massive decline, you were only able to find a few cherry picked upward slopes, the longest of which is less than 10 years long.
Do you think it might be wise to stop banging your head yet?
-
adelady at 10:24 AM on 6 March 2011A Real-World Example of Carbon Pricing Benefits Outweighing Costs
ranyl@43 "But as oil prices have jumped since 2006, and fossil fuel use hardly blinked an eye...." Oil and total fossil fuel are not the same thing. Oil use is mainly related to transport and to rising living standards allowing more people to use cars rather than other transport. Fossil fuel used for power generation rises with increases in industrial activity and, with luck, associated improvements in domestic living standards. The balance of these factors is pretty well settled for advanced economies. But in developing economies, the increases in power generation precede the improvements in living standards (at least those that involve more use of oil based fuels.) -
Rob Honeycutt at 10:15 AM on 6 March 2011Blaming the Pacific Decadal Oscillation
dana1981 at 13, responding to thingadonta #3: "these 3 coupled periods (sun+-PDO) correspond better than c02 does in the 20th century...implying that climate sensitivity to c02 is low." Dana: "Sorry no, you don't calculate climate sensitivity by looking at correlations." That was my thought as well, Dana. "CO2 alone" is one of the more firmly agreed upon figures for climate sensitivity at 1C. -
ranyl at 10:04 AM on 6 March 2011A Real-World Example of Carbon Pricing Benefits Outweighing Costs
"ranyl @3, while a carbon price will not significantly reduce demand for energy, to which we are adicted, it will significantly change the best means of sourcing that energy. The only way this is not true is if alternative power sources are so inefficient as to by not commercially viable at any reasonable price (contrary to the claims of their advocates)." Hi Tom, But as oil prices have jumped since 2006, and fossil fuel use hardly blinked an eye, what evidence is there that a higher price unless much higher will make any difference to use really? Strikes me whatever the evidence CO2 emissions aren't stopping any time soon unless some miracle happens so all these discussions really are academic. Suspect it is probably prudent to start planning adaptation, with clear goals of carbon sequestration (this would a miracle or an enigma size effort), rapid transformation to a low energy use none fossil fuel society. Not sure renewables are the all saving grace, wind farms do heat and dry the land as well several other things, solar panels are associated with tri-nitro_floride release and rare metal mining, large dams casue huge CO2 releases from ecological effects and so on. Not using energy is in a real challenge but surely not worth taking the risk of CO2 levels over 400ppm for? -
Timothy Chase at 09:34 AM on 6 March 2011Blaming the Pacific Decadal Oscillation
Bob Tisdale wrote:The difference in the multdecadal variability of ENSO (NINO3.4 SST anomalies as a proxy) and the PDO should be a function of North Pacific Sea Level Pressure...
It's not eye balling as they use statistics, but you might be interested in Di Lorenzo et al. (2010 ) ENSO and the North Pacific Gyre Oscillation: an integrated view of Pacific decadal dynamics (presented at AGU 2010 Ocean Sciences Meeting) nevertheless. -
Bob Tisdale at 08:55 AM on 6 March 2011Blaming the Pacific Decadal Oscillation
Timothy Chase: The difference in the multdecadal variability of ENSO (NINO3.4 SST anomalies as a proxy) and the PDO should be a function of North Pacific Sea Level Pressure, with the SLP altering the strength of the gyre spin-up into the KOE. -
mspelto at 07:49 AM on 6 March 2011Icing the Medieval Warm Period
The variations of the Donne Glacier, Tasman Glacier and Murchison Glacier in New Zealand highlight the general response of NZ glaciers. -
scaddenp at 07:32 AM on 6 March 2011Icing the Medieval Warm Period
"If at 5pm tonight, you were provided with Peer reviewed, non-cherry picked, Scientific evidence that there is no mad made global warming...Would you be a)Happy ? or b) Angry ?" Well first I would be skeptical, because a claim that strong would need the evidence tested rigourly by other workers. Then I would be ecstatic. Who wouldn't be? But what has this got to do with glaciers and MWP? -
Timothy Chase at 07:21 AM on 6 March 2011Blaming the Pacific Decadal Oscillation
Sometimes I think the language used to describe "climate oscillations" is somewhat unfortunate. To many the term "oscillation" suggests periodic behavior. This is compounded by references to "climate oscillation's" "period." But the behavior of climate oscillations is generally not periodic. Instead there is a characteristic time scale that appears to be associated with a form of bistability where the system tends to be in either one state or the other. Your reference to "atmospheric noise" is suggestive of the nonperiodic nature of the Pacific Decadal Oscillation's non-periodic, or alternatively, quasi-periodic behavior. The Pacific Decadal Oscillation has a couple of characteristic time scales. Atmoz gives a detailed explanation of the correlation between PDO and global temperature in which he mentions two different characteristic time scales:Sometimes, it's said that the PDO has a characteristic time scale, hence the word decadal in the acronym. The UW website states that "Shoshiro Minobe has shown that 20th century PDO fluctuations were most energetic in two general periodicities, one from 15-to-25 years, and the other from 50-to-70 years." To evaluate this, we can look at a wavelet analysis of the PDO with trend derived in the first part of this post. On the Relationship between the Pacific Decadal Oscillation (PDO) and the Global Average Mean Temperature Atmoz, 3 Aug 2008 http://atmoz.org/blog/2008/08/03/on-the-relationship-between-the-pacific-decadal-oscillation-pdo-and-the-global-average-mean-temperature(emphasis added)
The longer characteristic time scale is comparable to that which presumably exists for the Atlantic Multidecadal Oscillation. Please see:Michael E. Mann, associate professor of meteorology and geosciences, Penn State, and Kerry A. Emanuel, professor of atmospheric sciences, MIT, looked at the record of global sea surface temperatures, hurricane frequency, aerosol impacts and the so-called Atlantic Multidecadal Oscillation (AMO) — an ocean cycle similar, but weaker and less frequent than the El Nino/La Nina cycle. Although others have suggested that the AMO, a cycle of from 50 to 70 years, is the significant contributing factor to the increase in number and strength of hurricanes, their statistical analysis and modeling indicate that it is only the tropical Atlantic sea surface temperature that is responsible, tempered by the cooling effects of some lower atmospheric pollutants. Climate change responsible for increased hurricanes Tuesday, May 30, 2006 http://live.psu.edu/story/18074(emphasis added)
Shorter characteristic time scales would be suggestive of oscillators associated with shallower ocean ocean phenomena that would be more easily influenced by interactions between the atmosphere and ocean whereas longer characteristic time scales suggest that bistability involves changes in deepwater ocean circulation. In addition to the correlation between PDO and ENSO phases over time you have the fact that the two are virtually identical in spatial distribution but for the fact that PDO is strongest in the North Pacific whereas ENSO is strongest in the Equatorial Pacific. But during their warm phases both are cool in the North Pacific and warm in the Equatorial Pacific. You can see this here: Figure 1 Warm Phase PDO and ENSO. http://cses.washington.edu/cig/figures/pdoensoglobe_BIG.gif... from: The Pacific Decadal Oscillation http://cses.washington.edu/cig/pnwc/aboutpdo.shtml So there is a bit more to go on than simply a temporal correlation between two scalar values. What we have is an areal and temporal correlation between two two-dimensional fields that vary over time. Essentially, over the entire area of an ENSO, the warm phase of the PDO would appear to result in constructive interference with the warm phases of ENSO and destructive interference with ENSO’s cool phases, whereas the cool phase of PDO results in deconstructive interference with the warm phases of ENSO and constructive interference with ENSO’s cool phases. So it shouldn’t be any surprise at all that El Ninos are typically stronger, longer and more frequent during the warm phase of PDO and La Ninas are typically stronger, longer and more frequent during the cool phase of PDO. Spatial destructive interference might also help to explain the existence of a lead-lag relationship where an El Nino will tend to cause the Pacific Decadal Oscillation to tip from its negative phase to its positive phase. Feedbacks, both positive and negative, are part of an integrated theory of ENSO put forward in: Chunzai Wang (March 2001) On the ENSO Mechanisms, Advances in Atmospheric Sciences (Special Issue) Such feedbacks no doubt result in much of the observed quasi-stability of PDO states and would help to explain the observed lead-lag relationship between El Nino and the Pacific Decadal Oscillation, e.g., an El Nino weakening or overwhelming the negative phase of the Pacific Decadal Oscillation, making it easier for the latter to switch to its positive phase. Positive feedbacks no doubt help to explain the quasi-stability of the two states of the Pacific Decadal Oscillation. An El Nino may weaken or even overwhelm the negative phase of the Pacific Decadal Oscillation, making it easier for the mode to slip from its negative phase to its positive phase. PDO lags ENSO on the scale of several months:ENSO also leads the PDO index by a few months throughout the year (Fig. 1d), most notably in winter and summer. Simultaneous correlation is lowest in November–March, consistent with Mantua et al. (1997). The lag of maximum correlation ranges from two months in summer (r ~ 0.7) to as much as five months by late winter (r ~ 0.6). Matthew Newman et al (1 Dec 2003) ENSO-Forced Variability of the Pacific Decadal Oscillation, Journal of Climate, Vol 16, No 23
... and several years:There is potential a lead-lag relationship between the time variability of PDV2(i.e., the PC time series of PDV2) and N34Var although it does not exceed a statistical significance test. Figure 5c shows the lagged correlations of N34Var with the PC of PDV2. Note that the thick line indicates the 95% significant level and negative lags indicate the N34Var preceding the PC of PDV2. The maximum correlation occurs at lags of approximately 3~4 years with positive correlation. This indicates that the N34Varleads the variability of PDV2, suggesting that the Pacific mean state, which is identified by the PDV2, is due to a residual associated with larger or small ENSO amplitude. Sang-Wook Yeh and Ben P. Kirtman (May, 2004) Pacific Decadal Variability and ENSO Amplitude Modulation
-
dhogaza at 07:13 AM on 6 March 2011Icing the Medieval Warm Period
"If at 5pm tonight, you were provided with Peer reviewed, non-cherry picked, Scientific evidence that there is no mad made global warming...Would you be a)Happy ? or b) Angry ?" I'd wonder why my CO2 laser still works, personally. -
williambaskerville at 07:05 AM on 6 March 2011Icing the Medieval Warm Period
@ DB Actually a bit "flattening":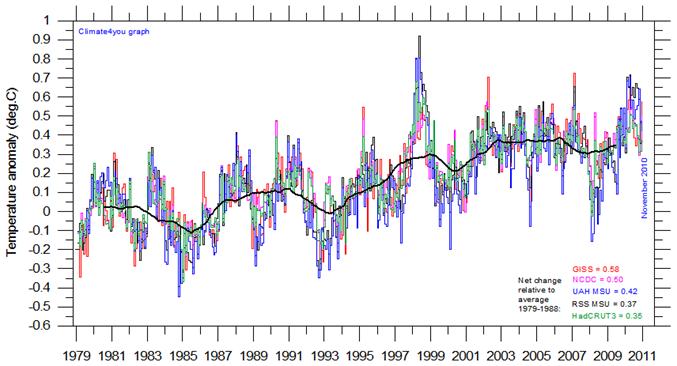 For example UAH Satellite-Based Temperatures until Feb. 2011:
Moderator Response: [Dikran Marsupial] Images (hopefully) fixed. BTW, the difference is the "exogenous factors" that Daniel's caption mentioned. The article by Tamino is well worth reading.
For example UAH Satellite-Based Temperatures until Feb. 2011:
Moderator Response: [Dikran Marsupial] Images (hopefully) fixed. BTW, the difference is the "exogenous factors" that Daniel's caption mentioned. The article by Tamino is well worth reading. -
stevee3906 at 07:05 AM on 6 March 2011Icing the Medieval Warm Period
My question..was deleted !! If at 5pm tonight, you were provided with Peer reviewed, non-cherry picked, Scientific evidence that there is no mad made global warming...Would you be a)Happy ? or b) Angry ? Why was there cooling in the 70's, the C02 models demand that temp rise with C02, yet they did not, as you stated. http://en.wikipedia.org/wiki/File:Holocene_Temperature_Variations.png Why stop at 2,000 years, try the period in the above link. Why are the Polar Ice caps on Mars melting ? Solar Activity.Moderator Response: [Dikran Marsupial] I would be delighted. However it might be a good idea if you were to acquaint yourself with the responses to common skeptical arguments already documented on this site. Firstly models do not demand temperature rises with rising CO2 because CO2 is not the only driver of climate, you also might want to look at Why did climate cool in the mid-20th Century?. Secondly, we know it has been warmer in the past, see What does past climate change tell us about global warming? . Lastly, the climate change on Mars is thought to be due to changes in albedo, see Global warming on Mars, ice caps melting . It is unlikely to be solar activity, see the response to the number one skeptic argument it's the sun. The reason your question was deleted was that, again, it violated the comments policy, for the same reason your previous post was deleted. -
scaddenp at 07:03 AM on 6 March 2011Icing the Medieval Warm Period
On various periods of ice expansion in NZ. Is this because NZ got colder? No. The alps perpendicular to the predominantly westerlie flow (same in Argentina). A warmer Tasman sea increases snowfall and hence the advance. But the terminus warms too so this doesnt go on forever. In a Franz Josef response study, it was calculated that needed in long term to increase precipitation by 40% for each 1 degree of temperature rise in ablation zone (from memory - paper at work). Again, read glacial data with care. -
Rob Painting at 07:03 AM on 6 March 2011A Real-World Example of Carbon Pricing Benefits Outweighing Costs
Blessthefall @ 38 - Rob, I don't see how one country reducing emissions will do anything if the rest of the world goes unchecked. It doesn't make any sense. If one of the main polluters, like the US, decides to curb greenhouse gas emissions, others will follow suit. If the US proves it can be done without crippling their economy why wouldn't others do the same?. Mind you this is highly hypothetical, your political system seems to be in the thrall of the Sith. What doesn't make any sense is continuing to rely on a limited and severely polluting energy resource. Peak oil occurred around 5 years ago, so there's only one way the price of oil is headed and that is up,up,up. Not making the transition to renewables, is going to be one of the defining blunders of the 21st century. If you want to talk environmental costs, that's something completely different. Different in that the true cost doesn't have to be borne by those damaging the environment. Passing the buck to future generations will not be appreciated by said future generations. Or even current generations, when you factor in that the extra 4% of global water vapor and the extra heat that fossil fuel combustion has bought about. To pay their fair share, fossil fuel companies would have to cover a proportion of all damaging weather events around the globe. See what I mean about expensive?. Economists simply ignore this stuff and give it a fancy name "externalizing". Blaming global warming for food shortages is a non-sequitur. No, actually it's fact. Don't you remember the Russian heatwave last year?. You know where they banned exports of grain after huge losses from the heatwave?. And that's just one major event. I've argued for a long time on other blogs that the first consequence of global warming will be expensive food prices from weather extremes (principally drought). Joe Romm over at Climate Progress has been hammering home that point for a while now. And after experiencing the warmest wettest year on record (2010) global food prices are at an all-time high. You should keep an eye on the FAO index, sure there will be ups and downs, but long-term that is going to skyrocket too.
-
Alexandre at 06:30 AM on 6 March 2011A Real-World Example of Carbon Pricing Benefits Outweighing Costs
Suggestion for a future post: fossil fuel subsidies. -
Camburn at 06:21 AM on 6 March 2011A Real-World Example of Carbon Pricing Benefits Outweighing Costs
Rob: If you think food prices are rising now, enact a co2 tax and you will see reallllll rises in food prices. -
Eric (skeptic) at 05:56 AM on 6 March 2011Blaming the Pacific Decadal Oscillation
Riccardo, you're right, you did. Sorry about that. Perhaps Spencer did indirectly consider the early 20th TSI increase in the sense that it is reflected in the PDO index. -
williambaskerville at 04:43 AM on 6 March 2011Icing the Medieval Warm Period
@ stevee I personally think that talking about a 'Medieval Climate Anomaly' does not really make sense. What does it mean to say this is a normal this an abnormal state of climate? We do not have the "view from nowhere" to do so. If we take the last 2000 years for example, than we find in some places evidence for a so called "Roman Warm Period" in most places evidence for a "Medieval Warm Period" in almost every places evidence for a "Little Ice Age" and at least a "Current" Warming (WP), starting something about 1850. Example: Are these periods anomalies? If we take a look on the last 100 years we see a warming from 1910 until 1940, a cooling until the 70s and a warming until the "peak" 1998, then a flattening of the curve.
 So I am convinced it is better to talk about a MWP and not a MCA.
Moderator Response: [DB] Actually, not-so-flattened:
So I am convinced it is better to talk about a MWP and not a MCA.
Moderator Response: [DB] Actually, not-so-flattened: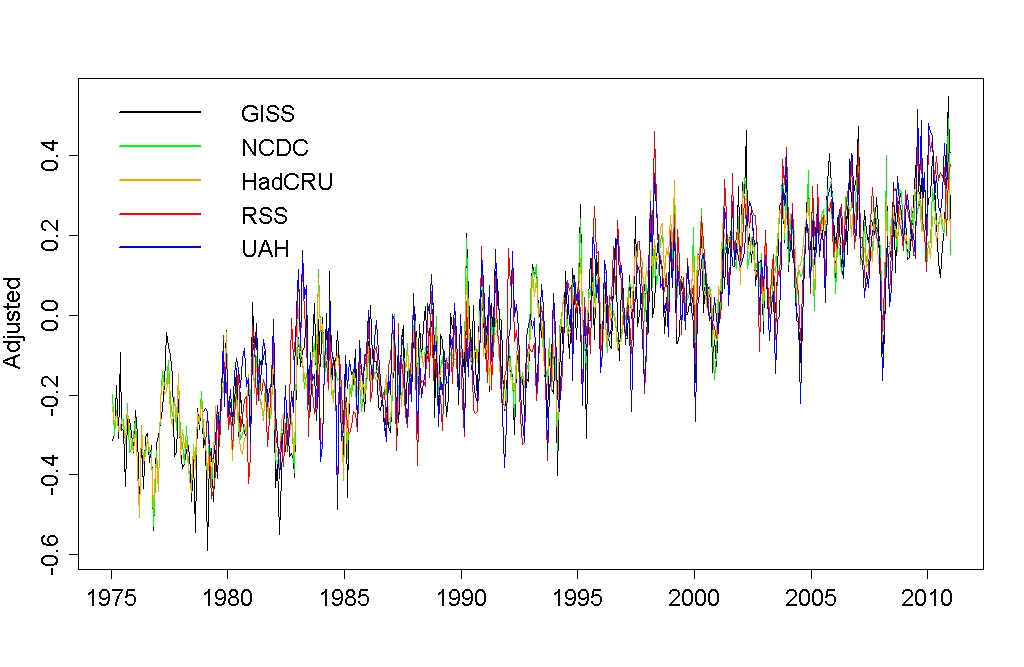
5 datasets, exogenous factors removed (Tamino) -
Paul D at 04:34 AM on 6 March 2011A Real-World Example of Carbon Pricing Benefits Outweighing Costs
SNRatio: "It's much more complex. First, the simplest, way to cut consumption, in general, is using longer-lived goods." ---or increasing prices--- Quality = higher prices. -
Riccardo at 04:30 AM on 6 March 2011Blaming the Pacific Decadal Oscillation
Bob Tisdale you're right, that's what I wanted to say when I noted that the definition is USA-centric. -
Blessthefall at 03:59 AM on 6 March 2011A Real-World Example of Carbon Pricing Benefits Outweighing Costs
Marcus and rob: Just a note to Marcus, this is the last time I'll acknowledge you. If you want to have a civil debate about something I suggest not speaking to someone like they're a 5 year old. Continually associating my or anyone else's beliefs with the fossil fuel industry gets people no where and quite frankly, it's frustrating: I am all for renewable energy just as long as it's just as efficient and cheap as oil or coal or nuclear. I have some articles/books that you can read which shows that the fossil fuel industry is involved with you and your ilk. That's right, they're actually pro-global warming because they can make money. When you decide to grow up, let me know and I'll be happy to provide the books. On to my response: My point is that if there's any industry that can profit from renewable energy, if there is any industry that can possible produce renewable energy on a large scale, it'd be the fossil fuel industry. Why? They have a massive amount of resources. Whether they decide to invest that into renewable energy or buy the renewable energy companies, they win either way. Rob, I don't see how one country reducing emissions will do anything if the rest of the world goes unchecked. It doesn't make any sense. Some say it's a "good place to start," but what good is it doing when China and India's emissions continue to rise? As far as the cost of energy, the actual production and shipping of the energy is what I'm factoring in. If you want to talk environmental costs, that's something completely different. Also, you bring up the rising cost of food... farmers are paid to underproduce. The United States alone could feed the entire world. Blaming global warming for food shortages is a non-sequitur. -
SNRatio at 03:51 AM on 6 March 2011A Real-World Example of Carbon Pricing Benefits Outweighing Costs
#33: "Ultimately individuals have to cut consumption, you can't do that just by moving things around. You either have to have a cultural change, or increasing prices, or rationing." It's much more complex. First, the simplest, way to cut consumption, in general, is using longer-lived goods. Building better things. Second, using mostly recycleable materials. Third, emissions per produced entity are by no means a well-defined quantity. Moving production around may be a very good idea, to have optimal locations. Producing Aluminium where there is a surplus of renewable energy, for instance. It depends on the rules of the game. Fourth, changing consumption patterns may be much more important than, generally, cutting consumption. Using fossile products only as industry raw materials and for special purposes, for instance. Substituting bio-products for fossile products may, by several criteria, actually increase consumption. But as long as it is sustainable, it may be the right thing to do. -
dana1981 at 03:42 AM on 6 March 2011Blaming the Pacific Decadal Oscillation
thingadonta #3:"these 3 coupled periods (sun+-PDO) correspond better than c02 does in the 20th century...implying that climate sensitivity to c02 is low."
Sorry no, you don't calculate climate sensitivity by looking at correlations. PDO does not cause long-term warming trends so it has no impact on climate sensitivity. Not to mention the fact that you're comparing a combination of multiple effects to just a single effect (CO2). CO2 doesn't act in a vacuum - you also have to take into consideration all other forcings in addition to CO2. -
dana1981 at 03:35 AM on 6 March 2011A Real-World Example of Carbon Pricing Benefits Outweighing Costs
garythompson #15:"the purpose of this post was to show how carbon cap and trade improved business.
No, it wasn't. I thought I pretty clearly outlined the purpose of the post - to debunk three myths related to carbon pricing. 1) That it will cripple the economy. 2) That it will kill jobs. 3) That it will make energy bills skyrocket. Cap and trade being pro-business didn't even make the list, let alone being the purpose of the post! As an added discussion, I noted that the New Hampshire House leader had claimed that killing cap and trade is pro-business, which is clearly not the case.
Prev 1861 1862 1863 1864 1865 1866 1867 1868 1869 1870 1871 1872 1873 1874 1875 1876 Next


