


 Arguments


Recent Comments
Prev 1862 1863 1864 1865 1866 1867 1868 1869 1870 1871 1872 1873 1874 1875 1876 1877 Next
Comments 93451 to 93500:
-
stevee3906 at 02:46 AM on 6 March 2011Icing the Medieval Warm Period
The entire premise of "Icing the MWP" and suggesting that the name be changed to " the Medieval Climate Anomaly" must be based on changing temperatures/climate is an .. Anomaly. The climate is always changing. If climate stayed the same that would be an Anomaly. The Climate changed long before the any effect from manmade activity.Moderator Response: [Dikran Marsupial] See the response to the second most used skeptic argument Climate's changed before. -
stevee3906 at 02:23 AM on 6 March 2011Icing the Medieval Warm Period
As climate is the study of long term averages and trends, the MWP is essentially just noise. The earths temps have been documented to be much higher at times in the past. http://en.wikipedia.org/wiki/File:Holocene_Temperature_Variations.png.Moderator Response: [Dikran Marsupial] By long term averages/trends, I meant sufficiently long to average out the weather noise. Climatologists generally take that to mean starting at about 30 years. The MWP ocurred over a long enough timescale to be 'climate' rather than 'weather' (noise). -
Marcus at 02:07 AM on 6 March 2011A Real-World Example of Carbon Pricing Benefits Outweighing Costs
Here's the thing Gilles. My current annual fossil fuel consumption is less than *half* what it was 10 years ago-yet far from being *poorer*, I'm now *richer*-because my energy bills are lower. This has not come at any cost to my standard of living-as my house still has access to all the mod-cons as before-just using the most energy efficient technology available. So I guess my point is that reducing fossil fuel consumption does *not* have to mean entrenching poverty-its about ensuring that development is achieved in the most CO2-neutral manner possible. I do find it odd, though, is that those who speak most loudly about the poverty which CO2 abatement will cause weren't too loud in speaking out against the poverty caused by corporations paying the people of these poor countries next to nothing for their labour & resources. -
stevee3906 at 01:51 AM on 6 March 2011Icing the Medieval Warm Period
Currently the Scientific Data shows the global satellite data at 0.02 below the 30 year average. http://www.drroyspencer.com/latest-global-temperatures/Moderator Response: [Dikran Marsupial] This appears to have little relevance to the article under discussion. Climate is the study of long term averages and trends; observations about current temperatures are essentially just weather noise and don't give a reliable picture of what the climate is actually doing. The same was true of the peak in 1998. I've made your link clickable to encourage others to view the data. -
stevee3906 at 01:39 AM on 6 March 2011Icing the Medieval Warm Period
Why did you delete my post regarding Global Warming, MWP the IPCC errors ?Moderator Response: [Dikran Marsupial] Your post was deleted because it violated the comments policy (specifically the first item on the list). Keep to the science and your posts will not be deleted (provided it is not off-topic for the thread of course). -
Alexandre at 01:15 AM on 6 March 2011Blaming the Pacific Decadal Oscillation
Riccardo Thanks for your response. So the North Pacific has been warming, sometimes a bit ahead of the entire global ocean, sometimes a bit behind. When it's ahead we have a negative PDOI and vice versa (right?). Look, I may be just giving away my own ignorance, but I cannot grasp any physical meaning of this index to justify it "pulling" the Earth's temperature up or down. It's just an oscillation between two different temperature distribution patterns. A very positive PDOI does not mean a particularly warm ocean (Global, at least. I tried to find some SST time series of the Pacific alone, and could not find any.) -
Bob Tisdale at 01:05 AM on 6 March 2011Blaming the Pacific Decadal Oscillation
Riccardo: Your post misses a very important point. You defined the PDO, but failed to clarify it. The PDO data from JISAO does NOT represent the Sea Surface Temperature (SST) anomalies of the North Pacific, north of 20N. In fact, on decadal timescales, the SST anomalies of the North Pacific (north of 20N) are inversely related to the PDO. The following graph presents the North Pacific SST anomaly residual (North Pacific SST anomalies MINUS Global SST anomalies) versus scaled PDO data, with both datasets smoothed with a 121-month running-mean filter. http://i52.tinypic.com/ipaxjr.jpg Now if we invert the PDO data (multiply it by a negative scaling factor) we can see how closely they are related. http://i52.tinypic.com/15oz3eo.jpg In other words, during epochs when the PDO is negative, the North Pacific SST anomalies are greater than global SST anomalies. For a more detailed discussion, refer to: http://bobtisdale.blogspot.com/2010/09/inverse-relationship-between-pdo-and.html -
Paul D at 01:03 AM on 6 March 2011A Real-World Example of Carbon Pricing Benefits Outweighing Costs
2010: UKs chief environmental scientist points out UK emissions have gone up, once exported emissions are taken into account: http://www.bbc.co.uk/news/science-environment-11172239 -
Gilles at 01:00 AM on 6 March 2011Climate Sensitivity: The Skeptic Endgame
e#97 : again, I don't think that a probability distribution based on a collection of heterogeneous models and measurements has any clear signification, especially if you're interested in the peak in the distribution ! just because the position of this peak will shift following the number of bogus models you add in the sample. -
Paul D at 00:58 AM on 6 March 2011A Real-World Example of Carbon Pricing Benefits Outweighing Costs
Bern: "I think it's a *very* low bow to draw to blame the decline of manufacturing in western nations (including both the EU and the US) on efforts to fight global warming." That isn't what I wrote. The fact is companies have exported emissions to China in the race to reduce costs and compete. I didn't say it was a result of current efforts to cut emissions. However, if you include emissions produced by China for goods that would have been produced in the EU in the past, then, EU emissions haven't gone down much. In fact I think there was a UK report out last year that showed UK emissions had gone up or remained static once emissions exports had been taken into account. Ultimately individuals have to cut consumption, you can't do that just by moving things around. You either have to have a cultural change, or increasing prices, or rationing. -
Riccardo at 00:36 AM on 6 March 2011Blaming the Pacific Decadal Oscillation
A general clarification related to some of the comments (johnd, Gilles, thingadonta). The point of the whole post is to show that the PDO alone cannot be the cause of current warming (Spencer's claim) and that what we know makes clear that it cannot even be considered as a forcing by itself. johnd frequency has indeed changed over time, as I showed, but as far as the PDO as a forcing is concerned it is irrelevant; it would anyway produce a tmporary warming trend. Lacking a long term trend in the PDO index rules out it's role. Fig 3 should make it clear. thingadonta I intentionally "faiiled to mention etc." because my point was exactly that, we can not use the PDO index this way. Moreover, how come you compare PDO+sun with CO2 alone? You can not play with the forcings you convenience, putting in the ones you like and leaving out those you don't like. Alexandre I do not have the figure you're asking for. Though, we know that the North Pacific Ocean is warming overall and that the PDO index tells us just if it is warming more or less than the global oceans. michael sweet I take your comment as a compliment. I'm not involved in any research involving climate, but I'm a scientist and I'm used to read the scientific litterature thoroughly whenever I find a scientific issue interesting. Eric (skeptic) I explicitly quoted the definition of the PDO index. Spencer, again explicitly, tried to show that the PDO index alone could explan a good part of the XX century warming. He added the CO2 forcing afterwards to account for the late XX century increase while the PDO index was decreasing. He didn't even considered the well know TSI increase durng the first half of the century. -
protestant at 00:30 AM on 6 March 2011Blaming the Pacific Decadal Oscillation
Yes, Roy Spencer explained the warming trend with a weaker CO2-effect + the PDO. And then he is being attacked on "adding a trend to PDO" which is the human attribution in his simple model. He has done nothing wrong investigating alternative hypothesis'. -
Bern at 00:10 AM on 6 March 2011A Real-World Example of Carbon Pricing Benefits Outweighing Costs
The Ville - I think it's a *very* low bow to draw to blame the decline of manufacturing in western nations (including both the EU and the US) on efforts to fight global warming. It's got a whole lot more to do with the cost of labour - the 'outsourcing' of manufacturing to nations with extremely cheap labour has been going on ever since Walmart imported the first container loads of cheap Japanese goods... (and probably a heck of a lot longer!) The interesting (& rather sad) thing as that many of the same people responsible for that shift are now screaming that a carbon price will adversely affect manufacturing in western nations... -
Eric (skeptic) at 00:06 AM on 6 March 2011Blaming the Pacific Decadal Oscillation
Riccardo, PDO is indeed not a forcing, it is an index reflecting the result of various natural forcings. Thus it explains some of the natural variation that overlays AGW. But there is an important fact about the index not mentioned above which is that the index has the global SST anomaly subtracted from it, see http://www.springerlink.com/content/5xm9ngv5fn5dc2r7/fulltext.pdf (Mantua and Hare 2002) where they explain: "Residuals are here defined as the difference between observed anomalies and the monthly mean global average SST anomaly (see Zhang et al. 1997)." I believe that is what Roy Spencer was trying to show by adding "CO2" to PDO in his graph. -
neilrieck at 23:28 PM on 5 March 2011Roy Spencer’s Great Blunder, Part 3
I am not sure if Roy Spencer promotes bad-science accidentally or on purpose, but this is not the first time he has blundered. Recently I was searching through a database of the stolen emails from East Anglia colloquially known as Climate Gate. I found an email where researchers Mears and Wentz are mentioned as the discoverers of major mathematical errors in the algorithms used by Roy Spencer and John Christy. One error was the wrong algebraic sign. It turns out that the bad-science published by these researchers from the University of Alabama has been the primary reason why the climate models were questioned by the public at large. The errors where published in SCIENCE in 2005 with Spencer and Christy acknowledging the errors in the letters section of September 2005 issue. So why do Spencer and Christy continue to deny the science? Click the following link to see the details. http://www3.sympatico.ca/n.rieck/docs/climate_science.html#climategate -
angusmac at 23:28 PM on 5 March 2011Hockey Stick Own Goal
Tom @ 136 and Anom @137, I agree that I should be using decadal averages nevertheless it doesn't change the outcome of my argument as shown below.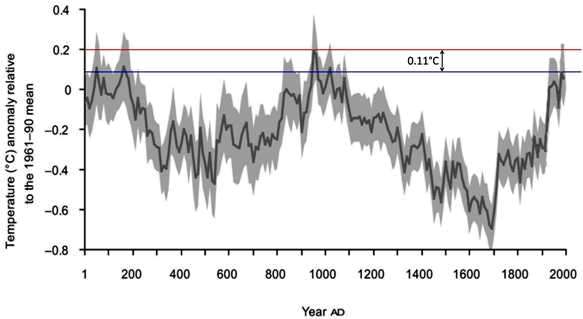 I have plotted the MWP peak temperature as the red line and the modern peak as the blue line on Ljungqvist's (2010) temperature reconstruction in Figure C and it is evident that the MWP peak is 0.11 °C warmer than the modern peak, i.e. the MWP was warmer than the 1990-1999 mean temperature.
Tom, I also agree that the GISS data show that 2000-2009 mean temperature is 0.18°C higher than 1990-1999. Now, if I assume that the proxy temperatures respond linearly with actual temperatures, the 2000-2009 peak would be 0.18 - 0.11 = 0.07°C higher than the MWP. This is hardly unprecedented warming and is about one-ninth of the 0.6 °C figure stated by Dana.
Finally, the assumption that proxies would increase linearly from the 1990's to the 2000's questionable because, "…recent proxy data does not emulate the recent instrumental data" (Ljungqvist, 2010). Proxy temperatures are much lower than the corresponding present-day instrumental temperatures (see Figure A in #132) i.e., the so-called divergence problem. What we really need are present-day proxies so that we can compare the current warm period with the earlier proxies.
I have plotted the MWP peak temperature as the red line and the modern peak as the blue line on Ljungqvist's (2010) temperature reconstruction in Figure C and it is evident that the MWP peak is 0.11 °C warmer than the modern peak, i.e. the MWP was warmer than the 1990-1999 mean temperature.
Tom, I also agree that the GISS data show that 2000-2009 mean temperature is 0.18°C higher than 1990-1999. Now, if I assume that the proxy temperatures respond linearly with actual temperatures, the 2000-2009 peak would be 0.18 - 0.11 = 0.07°C higher than the MWP. This is hardly unprecedented warming and is about one-ninth of the 0.6 °C figure stated by Dana.
Finally, the assumption that proxies would increase linearly from the 1990's to the 2000's questionable because, "…recent proxy data does not emulate the recent instrumental data" (Ljungqvist, 2010). Proxy temperatures are much lower than the corresponding present-day instrumental temperatures (see Figure A in #132) i.e., the so-called divergence problem. What we really need are present-day proxies so that we can compare the current warm period with the earlier proxies.
-
williambaskerville at 23:01 PM on 5 March 2011Icing the Medieval Warm Period
@ Tom Curtis Unfortunately it seems to me that you are a person, arguing ad hominem: "silly" "look a fool". That's a real shame. You are not that kind of person I want to talk to at all. So this is the last post addressed to you personally. "However, you identify as one of your regionally cooling regions New Zealand." No, I just identify some glaciers in NZ advancing in the current (until 1998), global WP. "... of just one or two glacier records for only decade (instead of the whole century) is cherry picking. If you don't like the term, don't do it." Come on. The chart starts 1977 and not 1900. Your argument "overall decline" is only valid for the period 1998 until now, with the exception 2002-2005. If you will call this a "trend" than do so. I am fine with it. You can find a "trend" downwards on the scaled mass balance of New Zealand glaciers, starting 1998. That is true. "Finally ..." My post Nr. 33: "Gehen Sie von den möglichen Steuergrößen aus. Was bleibt übrig? Alles läuft auf dieser Skala auf die Sonne hinaus. Wenn dem so ist, müsste man sicher von einer globalen Anomalie ausgehen dürfen; natürlich durch interne Oszillationen modifiziert" My translation: Assuming potential actuating variables. What has been left? Everything leads on this scale to the sun. If this is the case, a global anomaly can be assumed; of course modified by internal oscillations. @ MarkR Scherler et al., Abstract: In contrast, more than 50% of observed glaciers in the westerlies-influenced Karakoram region in the northwestern Himalaya are advancing or stable. Our study shows that there is no uniform response of Himalayan glaciers to climate change and highlights the importance of debris cover for understanding glacier retreat, an effect that has so far been neglected in predictions of future water availability, or global sea level You are right but I don`t think this is an argument against my statement that we have increasing glaciers in the Karakorum. -
Gilles at 22:51 PM on 5 March 2011A Real-World Example of Carbon Pricing Benefits Outweighing Costs
Tom#28 : I do fully agree with you. But I'm just saying that all "energy policies" reduce actually energy intensity - they do not control the whole emission rate, especially at a world wide scale. How can you prevent Chindia from using the oil spared by american hybrids vehicles? The Ville : actually hundreds of millions of chinese people went out of poverty in the last decade through an increase of their fossil fuel consumption. I think they would be happy if you show them how they could have made it in another way. -
mspelto at 22:48 PM on 5 March 2011Icing the Medieval Warm Period
In the United States we have had a very severe recession over the last 30 months. The vast majority of companies had layoffs and suffered financial losses, a number went out of business. That a few companies continued to grow is not evidence there was not a recession. The same holds for glaciers. Almost all are losing considerably volume, some are disappearing, a very few are not losing volume. The glacier volume loss is global and a strong indicator of global warming. The glaciers advancing noted by Koch and Clague are sufficient in number to indicate that they are not the small anomaly of today's advancing glaciers. The advances were also large enough to advance well beyond their former margin, that is not happening anywhere today. Again look at the synchronous response of northwestern North America glaciers in terms of mass balance change, and how this curve looks like the global signal, Rainbow Glacier charts near bottom. The latter graph I just submitted this week for BAMS State of Climate Report 2010, for the glacier section. -
michael sweet at 22:46 PM on 5 March 2011Blaming the Pacific Decadal Oscillation
Thingadonta, Your entire post has a total of zero links to data. "Others have looked" is just a bunch of deniers who do not know how to analyze data,or fabricate distortions. Provide links to peer reviewed data. If you cannot provide links to the data you will not convince anyone you have anything to say. Riccardo, You certainly have a lot of appropriate links to peer reviewed data. Are you involved in research in this field? -
Tom Curtis at 22:33 PM on 5 March 2011Blaming the Pacific Decadal Oscillation
thingadonta, what is the correlation (r^2) between the temperature increase and solar output - PDO with a monthly plot. IF you only have a smoothed plot (which exagerates correlation) what is the correlation for that smooth plot, and what is the smoothing. And who worked this out, and where did they work it out? -
MarkR at 22:32 PM on 5 March 2011Icing the Medieval Warm Period
#15 williambaskerville: I did read one recent paper on Himalayan glaciers in Karakoram. It was widely reported as 'Himalayan glaciers growing' (although the Telegraph have now changed their title on that article as far as I can see). This paper looked only at area changes, and isn't a proper mass balance. But changes in accumulation might be increasing their volume there. Maybe. In terms of area, more than half were expanding there, but the mean change in area was negative i.e. total area went down in Karakoram. The data is available if you look in the supplementary material, I decided to check for myself after all the popular media rants about how they were growing... williambaskerville at 22:49 PM on 4 March, 2011 Hi, I don't think this is a argument against the MWP. Don't we actually have increasing glaciers in Norway, New Zealand and the Karakorum? Don't we have regions in the world, not getting warmer? -
Kevin C at 22:14 PM on 5 March 2011Blaming the Pacific Decadal Oscillation
thinadonta@3: Have you tried factoring out the solar cycle from the temperature trend? Tamino does it here and several others have done similar calcs. Once you take out the effect of the solar cycle, the flattening since 2000 (which would probably be better described as an anomalously fast increase leading up to 2000) is replaced with a pretty linear trend. Here's a paper on the same thing: Lean and Rind (2009), GRL 36. -
Alexandre at 22:07 PM on 5 March 2011Blaming the Pacific Decadal Oscillation
To me it's not even clear that the PDO "warm" phase means a warmer Pacific SST as a whole. Eyeballing the figures, it looks like the "warm" phase could even be cooler than the "cold" one. Let alone warm the globe. Does anyone have a quantitative figure? -
Paul D at 21:43 PM on 5 March 2011A Real-World Example of Carbon Pricing Benefits Outweighing Costs
Gilles:"for a given energy intensity, doesn't it mean that we would just prevent poor people of getting richer ?" Being poor is a political/social issue that is separate from policies legislating for carbon. If you are worried about the poor, then you are dealing with an age old issue that exists throughout history. Why would you think you are going to solve it with cheap fossil fuels? So by all means tackle it in the context of 'traditional' (aka 20th century left/right arguments). But don't pretend that a global issue that has an impact on poor and rich and different species, can be drawn into this age old and failed discussion about the 'poor'. -
Paul D at 21:37 PM on 5 March 2011A Real-World Example of Carbon Pricing Benefits Outweighing Costs
As ranyl has pointed out, emissions in some cases have been exported from the EU to China/India. This is a well known issue. It is definitely the case in the UK where manufacturing has shrunk enormously and where cargo containers coming to the UK are 100% full, whilst those that leave are 50% empty. Offloading manufacturing to other nations doesn't reduce emissions, the chase for cheaper labour, fuel etc increases emissions. -
Tom Curtis at 21:01 PM on 5 March 2011A Real-World Example of Carbon Pricing Benefits Outweighing Costs
Gilles, the atmosphere does not give a hoot about our Carbon intensity. Carbon intensity is not a physical cause of anything. Carbon dioxide emitted to the atmosphere, on the other hand, is a cause of global warming. So, I don't care a hoot what you do with your "carbon intensity" if it does not reduce total carbon emissions. On the other hand, reducing carbon emissions while preserving economic growth will inevitably reduce carbon intensity (seeing you like reductions in abstract quantities so much). Further, probable consequences of Business As Usual include the loss of the Amazon rain forest, and the loss of the Great Barrier reef. These are costs always left out of economic assessments of the proper value of carbon reductions, and for good reason. If they were left in, it becomes self evident that the cost of not reducing carbon emissions is too great. -
Tom Curtis at 20:50 PM on 5 March 2011Icing the Medieval Warm Period
WB, your "point" is that there are regionally cooling areas in the modern warm period, so that identifying regionally cooling areas in the 10th and 11th centuries does not disprove the existence of a global MWP. I think that point is valid, as I have said. However, you identify as one of your regionally cooling regions New Zealand. As it happens, NZ has been warming over the course of the 20th century, and over that period its glaciers have been retreating, with some short duration exceptions. Therefore picking on NZ as one of your cooling regions on the basis of just one or two glacier records for only decade (instead of the whole century) is cherry picking. If you don't like the term, don't do it. Seeing a graph that obviously shows an overall decline in and then picking out just those sections of the graph which show an increase in mass balance is very silly. It is cherry picking when the refuting evidence is directly in front of us, and can only make the person who does it look a fool. Either you have a bizzare straw man view of global warming that says that all temperature rises, or glacial retreats will be monotonic; or you suffer under the mistaken notion that Koch and Clague only show occasional decades of glacier expansion against a backdrop of centuries long decline (rather than the reverse as they claim); or by pointing out short periods of increase against a backdrop of overall decline, you are cherry picking. Finally, you are apparently a German speaker. If you were not, then presenting an untranslated German text as evidence would be simple foolishness for you would not know what it means. As a German speaker, with evidently reasonable English skills translating the text should be no problem to you. If, however, you think the text is so unimportant that the Google translator can be trusted to give its sense, then I will take that assessment at its face value, and not bother. Anything whose sense is so unimportant that it can be trusted to google is not worth reading. (Your refusal to translate the German passages is a fair indication that you are merely making an implicit appeal to authority. It is the "Dr" in front of the name that is evidently important, not what they said, which you cannot be bothered conveying to us.) -
thingadonta at 20:49 PM on 5 March 2011Blaming the Pacific Decadal Oscillation
Even though the PDO would not explain a long term rising T trend, when coupled with rising solar output from 1750-1850, it correlates well with early 20th century warming (+increasing solar output), mid 20th century cooling (+flattening solar output), less so with late 20th century warming (flattening solar output). But what you have faiiled to mention is that these 3 coupled periods (sun+-PDO) correspond better than c02 does in the 20th century (eg mid 20th century cooling with rising c02), implying that climate sensitivity to c02 is low. That is, the c02 effect is weak when you intergrate PDO, solar trends, and c02 trends in the 20th century, and also up to the 1st decade of the 21st century. Others have looked at this and come up with a correlation of 24% between T and c02 since 1850, and it's currently falling (rising c02 but flattening T). This together implies very weak climate sensitivity to c02, and that most of the warming since 1900 has been from solar output + 20 year+ heat lag effects, coupled with PDO oscillation + lag effects (heat derived from same source since 1750-warming sun). C02 effect has been increasing since 1950 but is still weak, as also seen in the flattening of T since 2000. -
Gilles at 20:25 PM on 5 March 2011A Real-World Example of Carbon Pricing Benefits Outweighing Costs
I think there is a confusion between two meanings of "reducing" CO2 emissions. Does it mean reducing the carbon intensity (the amount of fossil burnt for a given good or service), or the fossil fuel annual consumption (which is the former multiplied by the total consumption of goods ?). If the first one is easily defendable,the second one is much less obvious : for a given energy intensity, doesn't it mean that we would just prevent poor people of getting richer ? and there is even a third question : even if we reduce annual emissions, would it mean that we will reduce the total amount of extracted fossil fuels? if you spare say half of the fossil fuels, it means that after some period, you will be left with half of your initial amount, at at time when everything would have been exhausted if you hadn't made these conservation improvements. Does it mean that you stop extracting the remaining reserves just at this moment ? no of course. First because you don't know exactly what would have happened in a different world, and second because there is no reason to do it. So the TOTAL amount of fossil fuels is just driven by geological availability - unless we find a way to replace totally the use of fossil fuels by something else, they would just become "totally useless", but this seems to be very unlikely just now. -
Tom Curtis at 20:25 PM on 5 March 2011A Real-World Example of Carbon Pricing Benefits Outweighing Costs
garythompson, on the Forbes list, the mean of the rankings of the 10 states has improved from 31 from 33.6 in 2009. If we are to use your fallacy that any change in costs must be due to the introduction of a carbon price, then we must assume that the net effect of such an introduction is favourable to business. Of course, that assumption is invalid. Consequently simply pointing to a ranking of business costs in the various states is uninformative about the net effect of the carbon price, even if the rankings in all states had declined. It is not clear that the actual situation, in which 50% of the states improved their ranking, while 40% declined (as pointed out by Marcus), albeit with a 1.4 decline in mean ranking overall, would support your case even if the carbon price was the only factor that changed. A decline in ranking, after all, can come with decreasing business costs because business costs have decreased further in another state. As other factors are undoubtedly involved, the rankings leave us almost completely in the dark. -
Gilles at 20:10 PM on 5 March 2011Blaming the Pacific Decadal Oscillation
I think it is unlikely that oscillations like PDO explain the whole XXth century trend, and that CO2 doesn't contribute to this trend. However, one should recognize that current GCM models are quite unable to describe this (and other) oscillations, and that this lowers their reliability concerning the determination of climatic parameters such as the CO2 sensitivity. If PDO contributes significantly to the warming of the last 30 years, it is not reproduced by the "natural alone" variations in GCM models (see e.g. http://www.ipcc.ch/graphics/ar4-wg1/jpg/fig-6-14.jpg ) , so this should lower the anthropic contribution accordingly -
johnd at 19:52 PM on 5 March 2011Blaming the Pacific Decadal Oscillation
Riccardo, when you state "the PDO index has no trend" I assume you mean no trend in the magnitude of the index as it oscillates. But given it is an oscillation should it not be the frequency of the oscillation that is more relevant in the search for any trends rather than the magnitude of the index. Just looking at your Fig. 2: annual PDO index from 1900 to 2010, it appears that over that short time span, the index appears to have spent more time in the positive phase rather than the negative phase. Even in the reconstruction it appears as if the frequency of the oscillation has been increasing as we go. -
williambaskerville at 19:46 PM on 5 March 2011Icing the Medieval Warm Period
@ Tom Curtis "He does not help his case, however, by his clear propensity to cherry pick, as by using individual glaciers rather than data from glaciers for a particular region. And his comments @41 are just silly." What is my case? You've got the point in "I think ..." and "From ..." It is not a "Cherry Picking" at all. "Regional evidence" is the point. If you take it as an evidence on case A but not on case B. That is "Cherry Picking"! I only wanted to show that. "And his comments @41 are just silly. (On a side note, posting German (?) quotes on an English speaking site without translation is both discourteous and unhelpfull.)" The comments aren't silly at all. If Scaddenp argues "virtually all the rest of NZ glaciers retreat", and Rob Painting does post a picture to confirm, than I have imho the right to point out that in several years within the period 1977-2009 the glaciers advanced. The same right for all! Btw it is not my task to translate interviews. Google is in general a good "thing", I've learned from the post of Mr. Murphy, so why can`t you take a google-translator? Is it to silly to do so? My point is not that a MWP was warmer than the current WP. OK? -
Marcus at 19:37 PM on 5 March 2011A Real-World Example of Carbon Pricing Benefits Outweighing Costs
"It seems that anyone who disagrees with you or anyone else in the pro-global warming crowd is from the "pro-fossil fuel brigade." Actually, that's patently untrue. I save that label only for people who (a) use extremely lame arguments to "disprove" the anthropogenic link to global warming, (b) try & use equally lame arguments to "prove" we shouldn't take any action to reduce CO2 emissions or (c) refuse to engage in a proper debate on the issues. So you, Gary & Poptech will most certainly get labeled with that epithet-as I rightly think you deserve. Although I disagree with many other people at this site, I most certainly don't necessarily accuse them all of being pro-fossil fuel industry. -
Marcus at 19:31 PM on 5 March 2011A Real-World Example of Carbon Pricing Benefits Outweighing Costs
"Also, I'd argue that this study is done only after 2 - 3 the program was implemented. I think a long-term study would be more convincing." Gee, didn't stop your mate Gary from falsely trying to derive some kind of negative spin from the Forbes article-but I didn't notice you criticizing him (well, why would you, you're both on the same team). The fact is that this is a very good indicator of the potential benefits of such schemes. If you want more long term data to convince you-look at some of the beneficial outcomes in Mainland Europe. As to your criticism regarding the regional nature of this scheme-the whole idea is to provide a test-bed which other States-& Countries-can follow, & it does make a contribution to overall CO2 reduction-or would you rather we continue to adopt the "head-in-the-sand" approach that your mates in the industry keep pushing? Also, every tonne of coal or oil that remains unconsumed not only represents a reduction in CO2 emissions, it also represents a reduction in the emissions of benzene, particulate emissions, cadmium, radon, mercury & a host of other toxic chemicals that can lead to environmental damage on a local/regional level. It will also reduce the mount of environmental damage caused in both the pursuit of coal/oil & in the dumping of the millions of tonnes of waste generated from burning coal. -
Rob Painting at 19:30 PM on 5 March 2011A Real-World Example of Carbon Pricing Benefits Outweighing Costs
Blessthefall - "The last time I checked the "problem" that is being addressed is called "global" warming, not United States warming or Delaware warming or New Hampshire warming" True, but The US is the major polluter, both historically and presently. Seems like a lame excuse to do nothing. "There's a reason why we use coal and oil as our primary sources of energy: it's cheap and efficient" But it's not really cheap at all. Remove government subsidies and factor in the environmental cost (whoa!, that would be a biggie!) then they are in fact incredibly expensive. Depends how you choose to define it eh?. "if there is any company that could possibly benefit from a new energy source - whether it be solar, wind, or whatever - it'd be those evil guys from the "fossil fuel brigade." Dude (or dudette) that doesn't make any sense. The fossil fuel industry has an infrastucture worth trillions of dollars. Why would they be happy in that being rendered obsolete?. And now that global warming is causing world food shortages we are seeing societal upheaval in poor countries, like those in the Middle East. Have you even been down to your local gas station recently?. The price of oil is skyrocketing and oil companies will be making record profits. Why the heck would renewable energy interest them?. -
Marcus at 19:26 PM on 5 March 2011A Real-World Example of Carbon Pricing Benefits Outweighing Costs
"There's a reason why we use coal and oil as our primary sources of energy: it's cheap and efficient. Moreover, your comments seem to suggest that you believe the oil companies are fighting, or trying to prove global warming wrong because it affects their bottom line. If you stopped with the ad hominem attacks and thought about it, you'd know that, if there is any company that could possibly benefit from a new energy source - whether it be solar, wind, or whatever - it'd be those evil guys from the "fossil fuel brigade." Wow, just how much bunkum can you squeeze into a single post? I make those accusations of people who use any kind of straw-man argument to attack attempts to reduce our continued over-consumption of carbon-rich energy sources. As to your claims of about how "cheap & efficient" it is-total rubbish. (1) The limitations of physics means that coal power stations will *never* be more than 35% thermally efficient. (2) Almost all coal power stations have to produce the same amount of electricity 24-hours a day, & often have to push that electricity out over a distance of 20 kilometers or more. This means that, at night, large amounts of electricity are being generated that isn't getting used, & over long distances as much as 15% of the electricity being generated never reaches its destination (due to transmission & distribution losses)-so much for "efficient". As to being cheap-well it is *now*, but only after *trillions* of dollars of government support over the space of more than 100 years. Renewable energy has become cost-effective in a shorter space of time, & with much less government intervention. Even today, though, many of the costs of coal mining & combustion (the externalities) are covered by the tax-payer, not the coal industry. As to your final point, until every last ounce of oil & coal is depleted, the fossil fuel brigade will remain deeply opposed to renewable energy & energy efficiency-because every megawatt of energy not generated from fossil fuels is another dollar that isn't being earned by them. Still, nice to see you & Gary trying to double-team me on behalf of your beloved industry. -
Blessthefall at 19:07 PM on 5 March 2011A Real-World Example of Carbon Pricing Benefits Outweighing Costs
Also, I'd argue that this study is done only after 2 - 3 the program was implemented. I think a long-term study would be more convincing. -
Blessthefall at 19:01 PM on 5 March 2011A Real-World Example of Carbon Pricing Benefits Outweighing Costs
I still don't understand why single states or countries are imposing cap and trade systems. The last time I checked the "problem" that is being addressed is called "global" warming, not United States warming or Delaware warming or New Hampshire warming. Whether one thinks humans contribute to climate change in any significance or not, myself being in the latter group, it's a waste of money and time to pass cap and trade systems when the entire global community isn't on board - the US can reduce emissions while China, India, and other growing economies go unchecked. Moreover, I think that a study similar to this one should be done during a period of economic growth, not economic decline. Then we can truly find out if these cap and trade systems work. Marcus, I've read your comments on this website for quite some time. It seems that anyone who disagrees with you or anyone else in the pro-global warming crowd is from the "pro-fossil fuel brigade." Why is that? There's a reason why we use coal and oil as our primary sources of energy: it's cheap and efficient. Moreover, your comments seem to suggest that you believe the oil companies are fighting, or trying to prove global warming wrong because it affects their bottom line. If you stopped with the ad hominem attacks and thought about it, you'd know that, if there is any company that could possibly benefit from a new energy source - whether it be solar, wind, or whatever - it'd be those evil guys from the "fossil fuel brigade." -
Same Ordinary Fool at 18:23 PM on 5 March 2011Icing the Medieval Warm Period
The time period (say, 1910 to the present) of current warming (global or hemispheric) obviously can be well defined. The same cannot be said for the skeptic's proposed warmer 'MWP'. How coterminous are their geographical data points? Which century is favored? Increasing snowfall (and its timing) explains many of the anomalously advancing glaciers. This is the explanation for the Karakoram glaciers that are growing, while the Himalayan glaciers are retreating. Some high latitude glaciers can benefit from the increased water vapor in the atmosphere, picked up over warmer oceans. And, as I remember it, Mt. Shasta glaciers in California benefit from both El Nino weather south of it, and La Nina weather north of it. -
Marcus at 18:19 PM on 5 March 2011A Real-World Example of Carbon Pricing Benefits Outweighing Costs
"the bottom 10 in 2008 remained in the bottom 10 in 2010 2 years after passing the cap and trade systems. that is what i call an *epic fail*." How can it be considered "epic fail"? No one ever said that Cap & Trade was going to reduce the cost of doing business in those States-only that it would not significantly *increase* business costs-whilst still generating additional income for the State Economy-a fact that appears to be borne out by the Forbes piece that you cited. I certainly don't expect Cap & Trade to miraculously reduce business costs in the space of little more than 2 years-especially not compared to the relatively low income States like those in the South. That you do-or seem to-just suggests that you're setting up a Straw-man. A tactic I've come to expect from the pro-fossil fuel brigade. -
Marcus at 18:02 PM on 5 March 2011A Real-World Example of Carbon Pricing Benefits Outweighing Costs
So to summarize Gary-you tried to spin the Forbes data to insinuate that Cap & Trade had directly led to an increase in business costs in the States where it was implemented. Yet even a cursory reading of the figures you present don't even come close to proving your point-both because the majority of the States you mentioned either improved or remained unchanged & because you cannot actually prove that any increases in business costs can be directly associated with Cap-&-Trade (& Forbes, at least, is wise enough to to make such an unfounded assertion). Interestingly, many of the 10 States in that Forbes piece are ranked quite high on the Economic Climate & Growth Potential categories-which further undermines your already massively weak case. Like I said, I define that as an *epic fail*. -
Marcus at 17:56 PM on 5 March 2011A Real-World Example of Carbon Pricing Benefits Outweighing Costs
"blue collar workforces have white collar employees (engineers, scientists, HR, managers, etc.) to support the manufacturing process" That might be true, but a factory employing 1,000 people is going to have the majority of that workforce be blue-collar (probably around 80-90%), whereas a financial planning or R&D business employing the same number of people-for example-is going to have close to 100% of that workforce be white-collar. So the only one showing his ignorance here is *you*. -
Marcus at 17:53 PM on 5 March 2011A Real-World Example of Carbon Pricing Benefits Outweighing Costs
Hey Gary, the only one attempting spin here is *you*-I was just telling it like it is. You chose to focus on cost of business, yet the "evidence" you presented *failed* to do prove your point-indeed, given that the majority of States you mentioned *improved* in their ranking, it actually hurt your point. The idea that States with high business costs pre-Cap & Trade will become areas with very low costs virtually overnight is the worst kind of straw-man argument, but one that I've come to expect of the hard-core denialist brigade (of which you're clearly a member). Seriously, when you can provide solid *evidence* that Cap-&-Trade has significantly increased the cost of doing business in those 10 States, then I might listen, but right now you haven't even got circumstantial evidence to back your assertion. I do find it funny that people like you are so "skeptical" of AGW, in spite of overwhelming evidence to the contrary, yet expect us to swallow your rubbish claims on the basis of incredibly *weak* "evidence". Given that this is a frequent "Modus Operandi" of yours, I just figured you'd be better off on Watt's site-where such an MO is not only tolerated-its endorsed. -
protestant at 17:40 PM on 5 March 2011Hockey Stick Own Goal
@ Moderator in message #133: So? NH extratropical includes europe therefore it is already accounted for. No reason to choose spesific locations which represent only a small fraction of the globe. -
garythompson at 17:05 PM on 5 March 2011A Real-World Example of Carbon Pricing Benefits Outweighing Costs
Marcus - you can spin this any way you want but the purpose of this post was to show how carbon cap and trade improved business. the bottom 10 in 2008 remained in the bottom 10 in 2010 2 years after passing the cap and trade systems. that is what i call an *epic fail*. if you call that a success then that is your opinion but i do not call that a success. the good news is that the northeastern states in the US will reduce their carbon footprint because businesses will be leaving those areas due to the high taxes associated with those policies. blue collar workforces have white collar employees (engineers, scientists, HR, managers, etc.) to support the manufacturing process so your argument reveals that you have no manufacturing/business experience. i don't know what WUWT has anything to do with my comments but if you need a villian to rally against i guess that is who you choose to represent your straw man. i choose to come to SkC because i view this as the premier site for debating the science related to climate change. -
apsmith at 16:23 PM on 5 March 2011Roy Spencer’s Great Blunder, Part 3
A bit more of a write-up on this issue (thanks Kevin) here. -
Marcus at 15:54 PM on 5 March 2011A Real-World Example of Carbon Pricing Benefits Outweighing Costs
Also, why only focus on the cost of business aspect? Why not growth potential, or economic climate? The cost of business has a lot of factors associated with it-not least the kind of business & who they need to work there. A business with a predominantly blue collar workforce, which has little or no overheads, will have less costs than one with a white collar workforce with lots of overheads. Its no surprise that the States with the best rankings come from States known for businesses that don't require a highly skilled or educated workforce...again, epic *fail* Gary. Your point relies on a false correlation-& a correlation which doesn't even seem to exist to boot. They must love you over at WUWT, where opinion masquerading as fact is de riguer. -
Marcus at 15:41 PM on 5 March 2011A Real-World Example of Carbon Pricing Benefits Outweighing Costs
So lets see then-New Hampshire, Rhode Island, Vermont, New Jersey & New York all *improved* in rank; Maine, Maryland, Massachusetts & Delaware have all declined in rank-whilst Connecticut has remained unchanged. Which tells me that cap-and-trade has had *no net impact* on cost of business in the United States. I know it wasn't your intention, but thanks for effectively proving our point-namely that Cap & trade will not have any net negative impact on the cost of doing business-certainly no more than any other regulatory factor-yet it *will* have a positive impact on the environment. Talk about an *epic fail* there Gary. Time to go back & haunt WUWT where you clearly belong.
Prev 1862 1863 1864 1865 1866 1867 1868 1869 1870 1871 1872 1873 1874 1875 1876 1877 Next


