


 Arguments


Recent Comments
Prev 1863 1864 1865 1866 1867 1868 1869 1870 1871 1872 1873 1874 1875 1876 1877 1878 Next
Comments 93501 to 93550:
-
dana1981 at 15:09 PM on 5 March 2011A Real-World Example of Carbon Pricing Benefits Outweighing Costs
Cam burn - maybe try reading the article you're commenting on. Garythompson - your argument strikes me as similar to claiming that Japanese people live relatively long because they eat a lot of rice. States that were ranked low by Foerbes prior to cap and trade are still ranked low by Forbes. Shocking! By the way, in California we haven't implemented cap and trade yet. -
garythompson at 14:55 PM on 5 March 2011A Real-World Example of Carbon Pricing Benefits Outweighing Costs
For further clarification on my post #10, that ranking was for 2008, before the passage of many of these carbon cap and trade systems. Let's see how they rank now. Here is the link showing the ranking in 2010. and the ranking based on business cost rank is: 12th delaware 40th new hampshire 41st rhode island 42nd vermont 43rd new york 45th connecticut 46th new jersey 47th maine 49th maryland 50th massachusetts It should be noted that california is 44th - They also passed a cap and trade system since 2008. -
garythompson at 14:43 PM on 5 March 2011A Real-World Example of Carbon Pricing Benefits Outweighing Costs
See the following link from Forbes magazine ranking the states in the USA based on several variables. Once you are on the page click the column entitled "Business Cost Rank". Here is the ranking of the states that were listed in this post. 3rd delaware 40th maryland 41st new hampshire 42nd rhode island 43rd vermont 44th maine 45th connecticut 46th massachusetts 48th new jersey 49th new york Note there are 50 states in the USA and delaware is ranked 3rd due mainly to its easy business incorporation laws (Many corporations in the USA are incorporated in this state although they reside elsewhere). It appears that all but one of the states you listed in this posting are among the worst states in the USA to do business in. Is there a correlation between this ranking and their use of a carbon cap and trade system? Mr. O'Brien from new hampshire isn't the only one who thinks carbon cap and trade systems are not 'pro business'. -
Camburn at 14:37 PM on 5 March 2011A Real-World Example of Carbon Pricing Benefits Outweighing Costs
New Hampshire voted this week to leave the NE coalition on carbon. -
Chris3699 at 13:24 PM on 5 March 2011It's too hard
I'm all for a carbon tax but how do we stop companies from trying to protect their profit margins by passing the burden of the tax on to the consumer or by sacking their workers? My guess would be that if we had more government run businesses, who were on board with looking after the public interest, they could undercut the prices of the privately owned companies if they tried to pass the burden of the carbon tax on to the consumer, thus ensuring that the majority of the carbon tax would come out of their profit, as it should. -
Pete Dunkelberg at 13:18 PM on 5 March 2011A Real-World Example of Carbon Pricing Benefits Outweighing Costs
Dana #5 "Americans are deathly afraid of taxes...." I don't know that this is true of over half of Americans if there is good reason (and many think there is good reason in this case), but some are dead set against taxes, as are some in other countries. Australians can be as dead set as any. -
Daniel Bailey at 13:07 PM on 5 March 2011Various estimates of Greenland ice loss
More warming is inevitable (resistance is futile!): "Departure of sea surface temperature from average for 2010 from the NOAA Daily Optimum Interpolation SST Anomaly data set for October 2010. Areas colored red are warmer than the 1971-2000 average, areas colored blue are cooler than that average. A large region of record warm water temperatures extended along the west coast of Greenland, leading to record warm air temperatures and record melting along the western portion of Greenland in 2010. Ocean temperatures along the southwest coast of Greenland (60N to 70N, 60W to 50W) computed from the UK Hadley Center data set during 2010 were 2.9°C (5.2°F) above average--a truly remarkable anomaly, surpassing the previous record of 1.5°C set in 2003. Sea surface temperature records for Greenland began in the 1920s."
The Yooper
"Departure of sea surface temperature from average for 2010 from the NOAA Daily Optimum Interpolation SST Anomaly data set for October 2010. Areas colored red are warmer than the 1971-2000 average, areas colored blue are cooler than that average. A large region of record warm water temperatures extended along the west coast of Greenland, leading to record warm air temperatures and record melting along the western portion of Greenland in 2010. Ocean temperatures along the southwest coast of Greenland (60N to 70N, 60W to 50W) computed from the UK Hadley Center data set during 2010 were 2.9°C (5.2°F) above average--a truly remarkable anomaly, surpassing the previous record of 1.5°C set in 2003. Sea surface temperature records for Greenland began in the 1920s."
The Yooper
-
dana1981 at 12:24 PM on 5 March 2011Climate Sensitivity: The Skeptic Endgame
HR #98: sensitivity refers to the average temperature change across the whole planet in response to a CO2 change. I suppose you could break it down geographically and figure out a region-by-region sensitivity (the poles would have a higher sensitivity than lower latitudes). -
nigelj at 12:11 PM on 5 March 2011Icing the Medieval Warm Period
I will clarify the glacier issue in New Zealand, since I live there. There have been short term periods of advance of most glaciers as in 1990, which has now turned into an extended retreat. Over the last 100 years the trend is most glaciers are retreating, or a nett decrease in ice mass. From NIWAS website "Despite the sensitivity of New Zealand glaciers to changes in both precipitation and temperature, the volume of ice in the Southern Alps dropped by roughly 50% during the last century. New Zealand’s temperature increased by about 1 °C over the same period." http://www.niwa.co.nz/our-science/climate/news/all/glaciers-continue-to-shrink2 -
Tom Curtis at 11:53 AM on 5 March 2011Icing the Medieval Warm Period
I think Williambaskerville as a point. Looking at the moderator's response @24, it is clear that the entire eastern Siberian peninsular was cooler in the 2000's than during the period from 1959 to 1980. No one here would want to argue from that that the world has not warmed during the interval. From the article, I gather there is firm evidence that Spain, and a significant area of the Rocky Mountains is much warmer now then during the MWP. However, this is again just regional evidence. We should not argue from just two regions that global temperatures in the MWP were significantly lower than current temperatures. In that much, WB is right. He does not help his case, however, by his clear propensity to cherry pick, as by using individual glaciers rather than data from glaciers for a particular region. And his comments @41 are just silly. (On a side note, posting German (?) quotes on an English speaking site without translation is both discourteous and unhelpfull.) Nor does he help his case be ignoring the fact that reconstructions of past hemispheric or global temperatures consistently show peak MWP temperatures equivalent in some decade in the period 1950-2000, with modern temperatures clearly exceeding that range. That is not a slam dunk for a cooler MWP once error bars are taken into account, but it does show that a cooler MWP is more likely than not on current evidence, and possibly even likely in IPCC parlance ( > 66% probability). What I do not understand is the rhetorical battle over the MWP. If peak global temperatures during the MWP were 0.5 degrees C greater than at present, what would it matter. The presumed forcings of the MWP are still absent today; and global temperatures are expected to rise by 6 to 8 times that on conservative estimates. The denier focus on the MWP seems to me to be futile point scoring based on an attempt to cultivate ignorance. -
HumanityRules at 11:37 AM on 5 March 2011Climate Sensitivity: The Skeptic Endgame
Thanks Dana I've got another general question. Is global climate sensitiviity a real world phenomenon? What I mean is that with ideas such as polar amplification would actual climate sensitivity vary in different regions? -
Tom Curtis at 11:04 AM on 5 March 2011A Real-World Example of Carbon Pricing Benefits Outweighing Costs
Alexandre @4, A carbon tax is simpler to enforce, but has the disadvantage that it does not allow the trade of carbon credits. That trade is essential for the efficient allocation of carbon usage between industries, and between nations. Ideally, we should be working towards a world system in which each nation is allocated a portion of the maximum acceptable global emissions based on a per capita basis fixed at some reference year. We should then allow trade in carbon credits so that those with maximum current usage can reduce carbon usage at a more gradual pace, purchasing credits to compensate for their excess production of carbon. ranyl @3, while a carbon price will not significantly reduce demand for energy, to which we are adicted, it will significantly change the best means of sourcing that energy. The only way this is not true is if alternative power sources are so inefficient as to by not commercially viable at any reasonable price (contrary to the claims of their advocates). -
robert way at 10:58 AM on 5 March 2011Icing the Medieval Warm Period
scaddenp at 08:30 AM on 5 March, 2011 Individual glaciers as a proxy can be dubious but widespread changes are a good indicator of climatic changes. Furthermore, ice caps in the high arctic such as those mentioned previously by me are extremely sensitive to climatic changes with a small climatic change soliciting a large response. -
malamuddy at 10:56 AM on 5 March 2011A Real-World Example of Carbon Pricing Benefits Outweighing Costs
Given that William O'Brien was talking to Americans for Prosperity when he made these comments, it is not hard to imagine where the pressure to repeal cap and trade in his state came from. If so, then the story has another significance for Australia. If the current government manages to introduce a carbon tax scheme, some businesses will pressure any subsequent conservative government to repeal it. The conservative side is already promising to do so. -
dana1981 at 10:53 AM on 5 March 2011A Real-World Example of Carbon Pricing Benefits Outweighing Costs
Thanks Alexandre. I agree, there are definite benefits to a carbon tax, especially in terms of simplicity. The benefit of cap and trade is the control that the cap gives you. The major problem with a carbon tax is the word "tax". It's why Republicans called US cap and trade proposals "cap and tax". Americans are deathly afraid of taxes, so a carbon tax is a non-starter here. -
Alexandre at 10:29 AM on 5 March 2011A Real-World Example of Carbon Pricing Benefits Outweighing Costs
Personally, I like the carbon tax better. It sounds simpler to execute, monitor and enforce. But it's great to know about these success stories with cap-and-trade schemes. About the export of emissions pointed out by ranyl above: AFAIK, the US (and many others) also buy loads of Chinese goods and have rising emissions all the same. The European success should not be so easily dismissed. Great post, Dana. It would be great to have more of these. -
ranyl at 10:12 AM on 5 March 2011A Real-World Example of Carbon Pricing Benefits Outweighing Costs
Not convinced there ahs been a drop in carbon emissions and European drops are false promise due to outsourcing of industry to China and the East and the resessional dip in power hungry activities. Carbon trading is claimed by many to be fundamentally flawed concept that will not cause CO2 to fall, read the Hartwell report http://eprints.lse.ac.uk/27939/ and watch the story of cap and trade http://www.storyofstuff.com/capandtrade/. All systems are supported by offsetting and loop holes and how can carbon honestly be accounted for considering the complexity of the fluctuations involved. Don't get me wrong we need to sequester billions of tonnes of CO2 and get back to 350ppm to even to be able to adapt but creating money spinning trading scheme markets and marketers to heighten the inequality gap (wait until it gets expensive to buy fuel to see who has it), and produce little or no actual CO2 savings. Not sure how on earth fossil fuel use will ever possibly stop but prohibition through money, tax or law won't work, like they don't with drugs and humans are totally addicted to the benefits of fossil fuels. How on earth are 40ppm of CO2 (20 years or emissions) going to be removed from the atmosphere especially considering the current state of the eco-systems and tendency towards CO2 release as the earth heats up? -
Climate Sensitivity: The Skeptic Endgame
Gilles> the average value of the "1/1-f" (and hence sensitivity) factor will be larger than the 1/(1-f0)) When providing a probabilistic estimate of sensitivity, we are looking for the most likely value (the peak in the distribution), not the mean of the distribution. This value is not at all biased in the way you suggest. -
Rob Painting at 09:46 AM on 5 March 2011Icing the Medieval Warm Period
Williambaskerville - that's nuthin. The Franz Joesph glacier (a tourist spot) info centre has a number of photos of the glacier dating back over a hundred years. Despite periods of advance the long-term retreat of the glacier is spectacular. When you walk to the glacier face, there are pegs marking where the face/front used to be at a particular time in the past. I can't find copies online but here's an indication:
-
KR at 09:35 AM on 5 March 20112nd law of thermodynamics contradicts greenhouse theory
Fred Staples - My apologies, I'm mixing two examples in my last post. The isothermal atmosphere example you posit will increase in temperature due to increased GHG absorption, and will remain stable at that higher temperature unless the emissivity increases. That's a requirement of the S-B law. Temperature and emissivity are the two flexible values if emitted power is fixed - as one goes up, the other goes down. And in this case temperature is the dependent variable; emissivity is the driving variable. The actual Earth system includes both band widening/deepening as well as lapse rate driven cooling of the emissive layer. But both are part of the radiative greenhouse effect. Rock salt convective greenhouses are irrelevant to this - and the Woods experiments have been repeatedly debunked over time. -
KR at 09:28 AM on 5 March 20112nd law of thermodynamics contradicts greenhouse theory
Fred Staples - Even in the toy case of an isothermal atmosphere, absorbing/emitting greenhouse gases will increase the stable temperature. Power emitted must equal power received at equilibrium. Greenhouse gases do not affect power received (visible light window), while they decrease planetary emissivity in IR by radiating part of the energy back to the surface. Given the Stefan-Boltzmann relationship, if emissivity decreases power radiated decreases, causing an imbalance. An increase in greenhouse gases directly decreases emissivity by absorption band deepening and widening. This drops emitted energy to space. Power = emissivity * SB constant * Area * T^4 That imbalance will persist (accumulating energy, increasing temperatures) until radiated power rises to the level of incoming power again, at a higher stable surface temperature. The temperature will not drop again under those circumstances, because the emissivity of the planet remains lower. The only way to reduce the stable temperature of the planet would be to increase emissivity, by (for example) decreasing GHG's. Emissivity does not magically drop when the imbalance zeros out, which seems to be what you are asserting. Current Earth effective planetary emissivity is ~0.612, with ~240 W/m^2 entering and then going to space. Doubling CO2 creates an imbalance of 3.7 W/m^2, which is equivalent to reducing emissivity to 0.6026 by simple power scaling. Earth surface temperature is ~14C, or 287.15K. Calculating: ( 287.15^4 / ( 0.6026/0.612 ) ) ^ 0.25 = 288.27K The surface temperature under those conditions rises to 288.27K, or 15.1C, matching the 1.1C rise predicted for doubling CO2 with no feedbacks. -
williambaskerville at 09:01 AM on 5 March 2011Icing the Medieval Warm Period
@ Robert Painting Very interesting picture - especially the periods 1979-1981, 1982-1987, 1988-1989, 1990-1997, 2000-2001, 2002-2005 and 2006-2007. -
Fred Staples at 08:54 AM on 5 March 20112nd law of thermodynamics contradicts greenhouse theory
I do not claim, KR, 337, that all AGW theories contradict the second law. It is just that many of them do. Most of them confuse heat and energy, which is where entropy comes in. One such explanation, which you can still find in modern text-books, (Houghton for example) is the original greenhouse radiative effect. Consider a greenhouse made of non-absorbing material, such as rock salt. It will absorb heat from the sun, the interior will heat up, and, with convective cooling eliminated, the internal temperature will be higher than the surroundings (G and T’s car interiors, for example). The greenhouse will radiate W watts per square meter, proportional to the fourth power of its temperature. Now replace the rock salt cover with glass, which absorbs infra-red radiation. Half of the outgoing radiation will return to the interior, which, so the story goes, will heat up until it radiates 2W. The original W will then be radiated to the atmosphere, and W will be returned to the interior. The ratio of the glass interior temperature to the rock salt interior temperature will be the fourth root of 2, or 1.19. An increase of 19% of the rock-salt interior absolute temperature, or about 60 degrees C. Does that argument sound familiar? You will find it in part 1 of the Rabett paper to which SOD contributed. It is, of course, wrong. Back radiation from the cooler glass cannot heat the warmer interior. It would breach the second law if it did. To check this R W Woods built two greenhouses – one rock salt, one glass – so that their convective warming would be identical. Any back-radiative effect would heat the glass green-house preferentially. Their temperatures were the same. “Higher is Colder”, is not “part of the greenhouse effect”. It is the only plausible way of explaining how increasing atmospheric absorption and emission can increase the surface temperature. Incidentally, it is a mechanism which G and T did not discuss, although it was current from 1900 onwards. Think about an atmosphere without a lapse rate – an isothermal atmosphere where higher is not colder. Add greenhouse gasses, increase absorption, and you suggest that the atmospheric temperature will increase. What would happen if it did? Apply the Stefan-Bolzmann equation to the radiation to space, and energy emission will also increase (proportional to the fourth power of the atmospheric temperature). But the incoming energy, from the sun, will not change. So the atmospheric temperature will fall back to its original value. With a lapse rate, you can suggest that the effective emission level moves up to a colder region, reducing energy emission. All the temperatures must then increase to restore the balance. The only snag with that argument is that the evidence from the last 30 years shows that it does not happen to any detectable extent. -
Rob Painting at 08:38 AM on 5 March 2011Icing the Medieval Warm Period
scaddenp -Virtually all the rest of NZ glaciers are in retreat, mostly very rapid retreat. Picking one or items is Cherry Picking. Look at the overall picture. You mean like this overall picture Phil?.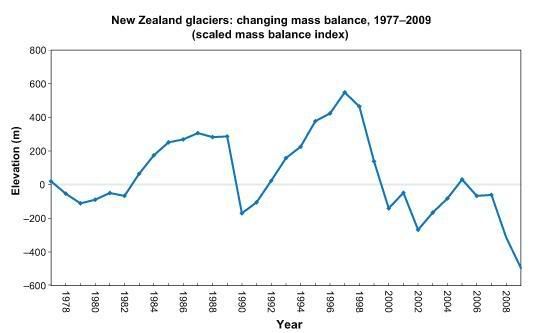 See NIWA
-
dana1981 at 08:32 AM on 5 March 2011A Real-World Example of Carbon Pricing Benefits Outweighing Costs
Yes, the EU is another example, with a carbon cap and trade system in place since 2005. There have been some criticisms of the system though, that they started the carbon price too low so it hasn't been very effective. A good lesson for us to learn from in the USA, if we ever get a system of our own. -
scaddenp at 08:30 AM on 5 March 2011Icing the Medieval Warm Period
I would add further comment on glacier's as a climate proxy (though Mauri could say more). Glacier response varies depending on quite a number of variable. NZ West Coast valley glaciers in deep shaded valleys response to snowfall is marked. They have further complication that rock load from valley sides protect the ice from melting so may respond to earthquakes (increasing rock cover) as well. A better determination is done by looking at glacier system as a whole, or chosing glacier locations where response in highly dependent on terminal temperature. Either way, NZ is warming (as temperature records would also show), as is Argentina. Whether other glacier record in Asia support or defy a MWP cannot be taken in isolation without either surveys of larger system or data on response. -
Byron Smith at 08:30 AM on 5 March 2011SkS Housekeeping: navigation dropdowns, short URLs and monthly donations
I frequently link to the ten key indicators of a warming world post and the 10 key indicators of human fingerprints. -
Jesús Rosino at 08:13 AM on 5 March 2011A Real-World Example of Carbon Pricing Benefits Outweighing Costs
A real real-world example is the European Union, they have reduced their emissions 7% (EU15) or 11%(EU27) since 1990, mainly with their cap & trade system, and they don't seem impoverished. http://www.eea.europa.eu/pressroom/newsreleases/eu-greenhouse-gas-emissions-more http://www.eea.europa.eu/publications/eea_report_2009_9/ghg-trends-and-projections-2009-summary.pdf -
robert way at 07:55 AM on 5 March 2011Icing the Medieval Warm Period
Mcshane and Wyner had about 8 comments on their study by climatologists, many found substantial errors. Mann et al (2010) in their response found that Mcshane and Wyner should have concluded based upon proper analysis that there was an 86% probability that the 10-year period from 1997-2006 was the warmest on record. -
scaddenp at 07:54 AM on 5 March 2011Icing the Medieval Warm Period
What I argue is that you cannot take isolated pieces of data and draw conclusions. The paper I pointed to did that and all proxy data used in supplementary data. Can you explain why you think the methodology used for regional reconstruction of temperatures in that paper is flawed compared to yours? As to global - I agree that LIA appears to be global. However, it also appears to have been much stronger in NH than in SH based on the patterns of glaciations in both. (Unfortunately papers on this at work). -
Kevin C at 07:50 AM on 5 March 2011Roy Spencer’s Great Blunder, Part 3
Arthur@19: Oh yes, you are right. You could have a big transient due to 20 years of strongly negative PDO from 1880 (although it looks implausibly strong). So the MacDonald data is relevant after all. -
actually thoughtful at 07:45 AM on 5 March 2011Icing the Medieval Warm Period
I recall a controversy over the McShane/Wynter (sp?) paper trying to show the confidence for the 1990s being the warmest decade. Does Martín-Chivelet et al effectively refute their claim that there was a relatively low confidence that the 90s were the warmest of the last 2000 years (at least for Spain)? Please, I am not asking for a rehash, just to understand if we are more or less past McShane. -
Kevin C at 07:42 AM on 5 March 2011Roy Spencer’s Great Blunder, Part 3
Just done a quick confirmation. Here is a graph of the PDO (false scale), a 30 year exponential, and the convolution of the exponential with the PDO, which is Arthur's function Q(t): Q(t) is simply the PDO with an asymmetric smoothing. To a good approximation we could say it has been smoothed and then lagged by about a decade.
If Arthur is right, then if we add the exponential (scaled by some factor) to Q(t), then we should be able to get Spencer's model. Or Barry's figure 8 by using different scales for the exponential term. Here goes:
Q(t) is simply the PDO with an asymmetric smoothing. To a good approximation we could say it has been smoothed and then lagged by about a decade.
If Arthur is right, then if we add the exponential (scaled by some factor) to Q(t), then we should be able to get Spencer's model. Or Barry's figure 8 by using different scales for the exponential term. Here goes:
 That's pretty close. Looking back at Barry's figures, Spencer has applied an extra pre-smoothing to the PDO, which accounts for the remaining difference.
So what happens if we go to the future? Well, the exponential term is pretty near zero by 2000, so all that is left is the smoothed PDO. Hence Spencer is predicting cooling as the PDO goes negative.
What about the past? I think you can see where the exponential is going. Snowball earth in 1800, Pluto a little earlier.
That's pretty close. Looking back at Barry's figures, Spencer has applied an extra pre-smoothing to the PDO, which accounts for the remaining difference.
So what happens if we go to the future? Well, the exponential term is pretty near zero by 2000, so all that is left is the smoothed PDO. Hence Spencer is predicting cooling as the PDO goes negative.
What about the past? I think you can see where the exponential is going. Snowball earth in 1800, Pluto a little earlier.
-
apsmith at 07:42 AM on 5 March 2011Roy Spencer’s Great Blunder, Part 3
Kevin C - good point on the transient bit blowing up into the past, I was trying to get to the bottom of that with Barry B. over email just now. In reality it is legitimate to have some transient value as a substitute for the missing forcing data before the starting point in the model (if you start just at T = T_e then you're saying there was no effect of forcing on temperature before the start). But to have such a large negative starting anomaly requires the forcing to have been large and negative in the prior period - and as we see from the MacDonald data it actually was quite close to zero for the few decades before 1900. -
robert way at 07:42 AM on 5 March 2011Icing the Medieval Warm Period
Another interesting paper using low resolution proxies is Viau et al (2006) which is based on pollen records and reconstructs temperatures similar to the MWP for up to 1950. http://www.skepticalscience.com/pics/1_Viauetal2006.png Moderator Response: [DB] Enabled in-line graphic.
 -
robert way at 07:30 AM on 5 March 2011Icing the Medieval Warm Period
Fredrik Charpentier Ljungqvist at 02:14 AM on 5 March, 2011 Dr. Ljungqvist, would you not agree however that your reconstruction of the extra-tropical northern hemisphere demonstrated that the temperatures are currently above those during the warmest decades of the MWP. I have often wondered why your 1990s decade shows lower temperatures than the 1980s and correspondingly why the instrumental record for the 2000s was not plotted. Nevertheless I would wonder if perhaps results might differ if tree rings (33% of the reconstruction) were not included because they tend to have issues with low frequencies. Either way I do agree that proxy data from the southern hemisphere is too sparse for global reconstructions but examples of attempts such as from Huang et al (2008) do demonstrate current global warmth exceeding the warmth during the MWP.
Furthermore when we think of the most sensitive of indicators of climate change ice caps are undoubtedly amongst the most sensitive. Evidence from Anderson et al (2008) demonstrate that ice cap recession on baffin island is beyond any period over the last 1700 years. Although the results of this study are of a low temporal resolution, conclusions such that ice cap recession is unprecedented over at least the last 1700 years are assured.
Each individual study obviously has their pitfalls but I do find it challenging that using annually to decadally resolved proxies for reconstructions are the only way of determining the magnitude of MWP to CWP comparisons. Perhaps Moberg's wavelet method is a plausible solution?
Moderator Response: [DB] Enabled in-line graphic.
do demonstrate current global warmth exceeding the warmth during the MWP.
Furthermore when we think of the most sensitive of indicators of climate change ice caps are undoubtedly amongst the most sensitive. Evidence from Anderson et al (2008) demonstrate that ice cap recession on baffin island is beyond any period over the last 1700 years. Although the results of this study are of a low temporal resolution, conclusions such that ice cap recession is unprecedented over at least the last 1700 years are assured.
Each individual study obviously has their pitfalls but I do find it challenging that using annually to decadally resolved proxies for reconstructions are the only way of determining the magnitude of MWP to CWP comparisons. Perhaps Moberg's wavelet method is a plausible solution?
Moderator Response: [DB] Enabled in-line graphic. -
williambaskerville at 07:00 AM on 5 March 2011Icing the Medieval Warm Period
@ scaddemp "As for opinion on MWP - opinions are worthless unless based on data. For more complete picture of MWP globally, then try here." My opinions are based on data. Quite ignorant your post. Maybe you take a look on the reconstructions listed on the NOAA or my summary on mittelalterlichewarmperiode and then you get a better understanding :) @ muoncounter ".. it seems to be comparison of MWP vs. the current warm period." Yes, indeed. I don't know if medieval temperatures were warmer than the temperatures are today. I say, you can't count some glacier advances in the MWP against a MWP but on the other hand some glacier advances today not as an argument against a current Warm Period. To say: We have global warming now contra Northern Hemispheric Warming at medieval times is no argument in this case. If we had a global LIA we also had a global MWP with regional differences in warming, as we see them today. If there was no global LIA there was (at least) a bi-hemispheric MWP. Btw if the sun was the main factor in past, medieval warming, this would be an argument for a global MWP, as Dr. Büntgen stated: Gehen Sie von den möglichen Steuergrößen aus. Was bleibt übrig? Alles läuft auf dieser Skala auf die Sonne hinaus. Wenn dem so ist, müsste man sicher von einer globalen Anomalie ausgehen dürfen; natürlich durch interne Oszillationen modifiziert William -
thepoodlebites at 06:47 AM on 5 March 2011Ice age predicted in the 70s
#39 Your Barry et al. link is broken. Read just before the sentence you quoted, "the summer cooling is apparently widespread through the Canadian Arctic so that a larger scale control must be sought." A thorough scientist will recommend the need for further study when a cause for the observed trend can not be conclusively determined. -
muoncounter at 06:32 AM on 5 March 2011Icing the Medieval Warm Period
No, I got your argument entirely. I agree with your "LIA glaciers were increasing on a global basis," signifying a cold period. I took your earlier statement to suggest that the presence of a few 'increasing' glaciers today, along with a reference to warmer temps in the '30s and '40s, to mean that we are not in a global warm period. Most glaciers today are not increasing, as shown by the WGMP mass balance. The question is hardly a comparison of MWP vs. LIA; it seems to be comparison of MWP vs. the current warm period. -
scaddenp at 06:18 AM on 5 March 2011Icing the Medieval Warm Period
william - it is common to quote that two valley glaciers are advancing as evidence that its cold in NZ. In fact those two are in long term retreat but advance/retreat with ENSO-driven changes in snow. Virtually all the rest of NZ glaciers are in retreat, mostly very rapid retreat. Picking one or items is Cherry Picking. Look at the overall picture. As for opinion on MWP - opinions are worthless unless based on data. For more complete picture of MWP globally, then try here. Note the marked variations when you put it all together.Moderator Response: [DB] Good points, all. Alpine glacier advance is a function of temperature and precipitation in the accumulation zone, with terrain and slope a modifying variable. Thus, it is quite conceivable for a few NZ glaciers to be advancing in a warmer world even though the vast majority are receding. Saying otherwise is to simply be in denial. -
williambaskerville at 06:18 AM on 5 March 2011Icing the Medieval Warm Period
@ muoncounter "That statement holds little meaning on the global basis. Isolated increasing glacier references can indeed be found, but the entire picture is negative" So what? You did obviously not get my argument. We can turn your statement on the LIA and the MWP too. In the LIA glaciers were increasing on a global basis but some were decreasing and in the MWP the same vice versa. This does not mean that the LIA was not a global phenomenon and one of the coldest periods within the last several thousand years. This does also not contradict my opinion on the MWP as a bi-hemispheric phenomenon (for some the evidence for the Southern Hemisphere ist not "good" enough for this statement but ever since I've gone through papers of Lara, Villalba (1990a, b), Villalba (1994), Stine (1994), Thompson et al. (2000, 2006), Boninsegna et al. (2009), Ljungqvist (2009), von Gunten (2009 - Inauguraldissertation), von Gunten et al. (2009), Moy et al. (2009-Springer) and Neukom et al. (2010) on the (southern) South America and Huffman, Holmgren, Holmgren 2003, Holmgren and Öberg 2006, Robertshaw and Taylor 2000, Tierney et al, Lamb et al. 2007, Verschuren et al. 2000 and Ngomanda et al. 2007, for Africa, I am quite sure for this part too). Within the MWP - for South America more specific "the late Medieval Warmperiod" mean temperatures were warmer than in the LIA. Of course this does not mean that the mean temperatures in Europe in contrast to the temperatures of the subsequent LIA in Europe have to be the same in Africa. It depends on the region. -
scaddenp at 06:08 AM on 5 March 2011Ice age predicted in the 70s
thepoodlebites - the question is whether the scientific consensus was that planet was cooling. You can find papers noting long term negative turn in solar forcing, and plenty on aerosol cooling but also considerable concern about warming. Was there a consensus like there is on AGW now? Was there even a slim majority worried about cooling? You can only answer those questions of with systematic survey of scientific literature, not picking papers.(eg Peterson) As for Climate Depot - how many examples of misinformation would we have to show you before you abandoned it? 5, 10, 100, every post, - or never so long as it says things you want to hear. (ie is it worth our time trying?) -
Alexandre at 06:05 AM on 5 March 2011Icing the Medieval Warm Period
Pete Dunkelberg #24 Maybe this post about a Mann 2009 paper can be a partial answer to your second question. It's not really a time series, but two snapshots: one of the MWP temp averages over the world, and one of the Little Ice Age. You can see there many cold spots during the MWP. -
thepoodlebites at 05:53 AM on 5 March 2011It's Pacific Decadal Oscillation
#74 Response: Thanks for the link Daniel. [OT] The title kinda reminds me of the that character on Big Bang Theory, Eric Kripke, the university bully with a lisp and Sheldon's arch nemesis. [end OT] I'm open to the idea that the 0.5 C warming in the last 30 years is both natural and anthropogenic. My argument continues to be more from natural variability than man-made CO2 induced. If the UAH annual trend continues upward this decade, >0.8 C, then I think the AGW proponents have a stronger case. If the trend is flat to cooler, <0.3 C, then the AGW case will be weaker. Sorry to hear about the failed Glory launch. We need better satellite-based measurements. -
muoncounter at 04:56 AM on 5 March 2011Icing the Medieval Warm Period
William B: "there are glaciers increasing" That statement holds little meaning on the global basis. Isolated increasing glacier references can indeed be found, but the entire picture is negative: Annual mass balance at World Glacier Monitoring Project
-
williambaskerville at 04:50 AM on 5 March 2011Icing the Medieval Warm Period
@ JMurphy Don't be aggressive, Mr. Murphy. Infact it is maybe true that my statement is correct only for the norhern part of Scandinavia. Even if Dr. Büntgen in my interview told me: "Speziell sei noch darauf hingewiesen, dass gerade aus Skandinavien die vielleicht besten regional-scale summer, i.e. June-August temperature reconstructions based on annually measurements of conifer maximum latewood density kommen. Eine Divergenz zwischen ansteigenden Sommertemperaturen und geringerem Jahrringwachstum ist in Skandinavien eh kein Thema, da die höchsten Temperaturen in den 1930er Jahren lagen (der Sommer von 1937 war extrem warm)." http://mittelalterlichewarmperiode.blogspot.com/2010/08/menschen-im-gesprach-teil-vi.html Unless that, my argument is still correct. What do I want to proof? Nothing. I only add my opinion on the MWP and it's extend. @ Moderator Thank's I'll do so. -
invicta at 04:40 AM on 5 March 2011Icing the Medieval Warm Period
TIS & AS thanks for the links I'll get reading -
Fredrik Charpentier Ljungqvist at 04:34 AM on 5 March 2011Icing the Medieval Warm Period
Concerning Scandinavian temperature: It is only in the northern part of Scandinavia that temperatures were about as high in the 1930s and 1940s as in the post-1990 period. In southern Scandinavia the last two decades have been generally warmer than the 1930s and 1940s. -
JMurphy at 04:32 AM on 5 March 2011Ice age predicted in the 70s
thepoodlebites, it is difficult to know what argument you are trying to support, especially as the first paper you linked to (W.S.Harley) also stated : "Thirty years of data are found of insufficient length to determine whether the cooling constitutes a climatic change under the given criteria"; and the second one (Barry Et al) concludes the introduction with : "The evident sensitivity of this area to climatic fluctuations on both short and long time scales makes it a rewarding area for interdisciplinary environmental studies". Is any of that evidence of anything you are trying to prove ? -
Pete Dunkelberg at 04:32 AM on 5 March 2011Icing the Medieval Warm Period
Moderators: 1. Where did you get / how did you prepare the graphic in # 15? Could you also show the same but using, say, a 1959-1980 baseline vs 2000-2010? 2. Given the ability of Skeptical Science to present and clarify global climate, have you thought of a time series of the MWP? In other words, in a certain period of 50 to 100 years the MWP was in South America, then in the Caribbean, at another time in Europe, and at these times other regions were perhaps cool. Some newer temperature series (single spot 'hockey sticks') that have been mentioned here would be useful for this project.Moderator Response: [DB] That is a NASA graphic for which I lost the link (irritating, yes). However, I was able to quickly find that version on Treehugger.com (they added the obvious text, but the rest of the graphic matched my aging memory). I'll try & track down the exact NASA link. If you go to here you can create this output: The rest of your suggestion, while intriguing, would amount to repudiating a Gish Gallop, in my opinion.
Prev 1863 1864 1865 1866 1867 1868 1869 1870 1871 1872 1873 1874 1875 1876 1877 1878 Next


