


 Arguments


Recent Comments
Prev 1865 1866 1867 1868 1869 1870 1871 1872 1873 1874 1875 1876 1877 1878 1879 1880 Next
Comments 93601 to 93650:
-
Riduna at 15:01 PM on 4 March 2011Icing the Medieval Warm Period
Tikal, Copan and other great Mayan city-states in the south did succumb to a combination of internecine warfare, over-population and drought induced crop failures in the 8-9th centuries, bringing the Classic Period to an end. That is a long way from destruction of Mayan civilization which survived in northern areas, notably Yucatan, where city-states such as Uxmal, Mayapan and Chechen Itza flourished into the 17th century. Their demise was at the hands of the Spanish, not climate change. Can prolonged droughts in Guatemala, Belize and Honduras in the 8-9th centuries be regarded as synonymous with the European MWP? -
Albatross at 14:33 PM on 4 March 2011Roy Spencer’s Great Blunder, Part 3
Dr. Bickmore, Has Roy responded to your critique? I'm a little surprised that he has not bothered to drop by and discuss this. I would not be surprised if he tried to frame this as an "attack" on skeptics over at his blog. We'll see. -
mspelto at 14:22 PM on 4 March 2011Icing the Medieval Warm Period
To get a better sense of the field sites and work by Koch and Clague take a look at Koch's research pages . Nice maps and photographs. -
muoncounter at 14:05 PM on 4 March 2011Twice as much Canada, same warming climate
Yooper: Didja notice that appears to be 5 degrees in approx 20 years? One of them natural cycles we hear so much about, I guess. Or maybe the Arctic Amplifiers are turned up to 11? -
Berényi Péter at 13:55 PM on 4 March 2011Climate Sensitivity: The Skeptic Endgame
#59 Sarah at 14:09 PM on 3 March, 2011 Hansen and Sato recently determined that climate sensitivity is about 3 °C for doubled CO2 based on paleoclimate records.[...]Moderator Response: [Daniel Bailey] Thanks, Sarah. The preprint is here.I don't see it was a peer reviewed paper. Dr. Hansen says it's a "Draft paper for Milankovic volume", whatever that may be. However, it is still interesting, because it is based on empirical data and has definite numbers to work with. Its biases and omissions are also telling. The first thing to note they assume a 4 W/m2 forcing for doubling of atmospheric CO2 concentration, which is slightly above the IPCC AR4 WG1 2.3.1 (2007) estimate of 3.7 W/m2, with no explanation whatsoever. The figure seems to come from IPCC FAR WG1 3.3.1 (1990). Anyway, if we accept their value, using CO2 concentration measurements at the Mauna Loa Observatory we get the annual rate of change in forcing due to CO2 as α = 0.024 W/m2/year for the last 54 years. The paper calculates an equilibrium climate sensitivity of λ = 0.75°Cm2/W using paleoclimate data. As temperature variability is much smaller under current warm interglacial regime than for the bulk of the last 3 million years, climate sensitivity obviously decreases sharply with increasing temperatures, but let's go with their figure anyway, at least for the time being. Greenland temperatures during the last 100 kyears -- click for larger version
If we assume a scenario under which atmospheric CO2 concentration was constant for a long time (presumably at pre-industrial level, let's say at 280 ppmv) then started to increase exponentially at the rate observed, we get an excitation that is 0 for dates before 1934 and is α(t-1934) for t > 1934. The artificial sharp transition introduced in 1934 this way does not have much effect on temperature response at later dates.
If global climate responds to an excitation as a first order linear system with relaxation time τ, rate of global average temperature change is αλ(1-e-(t-1934)/τ) for a date t after 1934. As the expression in parentheses is smaller than 1, this rate can't possibly exceed αλ = 0.018°C/year. It means global average temperature can't increase at a rate more than 1.8°C/century even in 2100, which means less than 1.6°C increase relative to current global average temperature, no matter how small τ is supposed to be.
However, a short relaxation time is unlikely, because it takes (much) time to heat up the oceans due to their huge thermal inertia.
For example if τ = 500, current rate of change due to CO2 forcing is 0.26°C/century while in 2100 it is 0.51°C/century (according to Hansen & Sato, of course). However, ocean turnover time being several millennia, we have probably overestimated the actual rates. It means that most of the warming observed during the last few decades is due to internal noise of the climate system, not CO2.
Anyway, the exponential increase of CO2 itself can't go on forever simply because technology is changing all the time on its own, even with no government intervention whatsoever. Therefore it should follow a logistic curve. If the epoch of CO2 increase is substantially shorter than the relaxation time of the climate system, the peak rate of change due to CO2 becomes negligible.
Greenland temperatures during the last 100 kyears -- click for larger version
If we assume a scenario under which atmospheric CO2 concentration was constant for a long time (presumably at pre-industrial level, let's say at 280 ppmv) then started to increase exponentially at the rate observed, we get an excitation that is 0 for dates before 1934 and is α(t-1934) for t > 1934. The artificial sharp transition introduced in 1934 this way does not have much effect on temperature response at later dates.
If global climate responds to an excitation as a first order linear system with relaxation time τ, rate of global average temperature change is αλ(1-e-(t-1934)/τ) for a date t after 1934. As the expression in parentheses is smaller than 1, this rate can't possibly exceed αλ = 0.018°C/year. It means global average temperature can't increase at a rate more than 1.8°C/century even in 2100, which means less than 1.6°C increase relative to current global average temperature, no matter how small τ is supposed to be.
However, a short relaxation time is unlikely, because it takes (much) time to heat up the oceans due to their huge thermal inertia.
For example if τ = 500, current rate of change due to CO2 forcing is 0.26°C/century while in 2100 it is 0.51°C/century (according to Hansen & Sato, of course). However, ocean turnover time being several millennia, we have probably overestimated the actual rates. It means that most of the warming observed during the last few decades is due to internal noise of the climate system, not CO2.
Anyway, the exponential increase of CO2 itself can't go on forever simply because technology is changing all the time on its own, even with no government intervention whatsoever. Therefore it should follow a logistic curve. If the epoch of CO2 increase is substantially shorter than the relaxation time of the climate system, the peak rate of change due to CO2 becomes negligible.
-
Marcus at 13:44 PM on 4 March 2011Putting a new finger on climate change
Philippe-the point I was trying to make (badly I confess) is that because fossil fuels have *zero* 14C, then changes in the ratio of C14 to C12 could serve as a useful secondary signal for the anthropogenic nature of the rising CO2 in the atmosphere. However, as scaddenp has pointed out, that might not be as easy as I first thought ;-). Hope that makes more sense. -
Marcus at 13:11 PM on 4 March 2011Icing the Medieval Warm Period
I'm guessing, Daniel, that those warmer periods you mentioned were the same as those I mentioned-the ones which wiped out the 2 big Meso-American civilizations of the day? The warming/drought that caused the end of the Egyptian Old Kingdom has been linked to a slowing of the Atlantic Conveyor (the one which causes the Gulf Stream)-which also caused Northern Europe to get cold. I wonder if something similar can explain the MWP?Moderator Response: [DB] Possibly/probably. With the teleconnections being uncovered, ENSO changes in the Pacific Ocean seem to be driving subsequent "downstream" reactions and changes throughout the world. Obviously an area being looked at further; given what we now see happening in our warming world & the potential impacts discussed in Dai et al 2010 (discussed here), it's an area of critical importance. -
scaddenp at 13:07 PM on 4 March 2011Putting a new finger on climate change
Marcus, google scholar for Etiope G and Lassey K R. Both researchers active on this. Short answer - C14 is useful but its not as easy as it sounds... (I'm trying to get no. for pre-industrial fossil methane emissions from sedimentary basins in day-job so having been looking at issue). -
Eric (skeptic) at 12:59 PM on 4 March 2011Climate Sensitivity: The Skeptic Endgame
Thanks for the link les, here's the full URL; http://journals.sfu.ca/int_assess/index.php/iaj/article/download/188/139 I looked at the section on climate sensitivity where they refer to this study http://pubs.acs.org/doi/abs/10.1021/es00010a003 titled "Subjective judgements by climate experts" to obtain a subjective probability distribution of climate sensitivity values centered aroudn 3C. In that 1995 paper they start out "When scientific uncertainty limits analytic modeling, but decision makers cannot wait for better science, expert judgment can be used in the interim to inform policy analysis and choice" I would rather wait for objective probability distribution measurements. For example, the continued rapid increases in computing power will make full weather simulation possible within global climate models (i.e the mesoscale models I referred to above). Then there will be no need for subjectivity. -
rocco at 12:53 PM on 4 March 2011Icing the Medieval Warm Period
Daniel Bailey: I think the article should mention that the Martín-Chivelet et al study is for Iberian Peninsula only. If you want to go beyond the usual 2000-year reconstructions globally you should reference the borehole studies, for example.Moderator Response: [DB] Thanks for the heads-up. I realized that after the fact, but forgot to update the text in the rush to publish. I'll fix it now. -
Philippe Chantreau at 11:35 AM on 4 March 2011Putting a new finger on climate change
Marcus, fossil fuels are millions of years old, way over a hundred millions for coal. No C14 left in there but from exterior sources. I'm not sure I understand your point in #10. -
Chemware at 11:33 AM on 4 March 2011Icing the Medieval Warm Period
Was there a MWP in northwest North America ? Or was the MWP a local, European event ?Moderator Response: [Daniel Bailey] The preponderance of evidence we have strongly suggests regional warming at various periods of time over several centuries that also coincided with regional cooling. Some areas warmed and others cooled. The area with best data for a localized, regional, warm period is in Europe. This period was also punctuated with brief colder periods where glaciers in the Alps underwent significant advancement. It was a complex climatic period. For more info, go here (both the Basic and Intermediate Versions). North America had warmer periods as well, but those were punctuated with extreme droughts. -
Marcus at 11:33 AM on 4 March 2011Icing the Medieval Warm Period
Oh, correction, 2 Civilizations (The Anasazi & The Mayans) both died out during the Middle Ages-both due to extended drought which was believed to be caused by a regionally warming climate. -
Marcus at 11:32 AM on 4 March 2011Icing the Medieval Warm Period
This is actually very interesting when you consider the fact that a civilization in South-Central America died out during the Medieval Period due to warming-as did the Khmer Empire-though several hundred years apart. I say that its interesting because the there was a similar dichotomy between Northern & Central temperatures as there was during the collapse of the Egyptian Old Kingdom. i.e. the equatorial regions of the world were gripped by an extended warm period, & attendant drought, whilst many of the northern latitudes were gripped by a relatively cold period. Of course this is yet another reason why we know that what caused these past two warming events is *not* what's causing warming now-because this time we're seeing a mostly globally homogeneous warming event. -
Philippe Chantreau at 11:31 AM on 4 March 2011Putting a new finger on climate change
Nice summary Tom. However, this appears a little obscure to me: "Because of the production of C14 in the upper atmosphere, Carbon dissolved in the ocean has a much lower CO2 content than does the atmosphere." Did you actually mean "because C14 is produced in the upper atmoshere, CO2 dissolved in the ocean has a much lower concentration in C14 than does the atmosphere." I'm still not sure about the mechanism though. Am I understanding this totally wrong? And also on this one: "Therefore declining C13/C12 ratios show the atmosphere is receiving CO2 from organic or fossil fuel (fossilized organic) sources." That should probably go "receiving CO2 produced by combining C from organic material or fossil fuel with atmospheric O2." -
Marcus at 11:27 AM on 4 March 2011Putting a new finger on climate change
OK, according to Wikpedia, C-14 has a half-life of 5,730±40 years. So I'm still wondering if this wouldn't play at least some small part in our ability to detect CO2 from natural vs anthropogenic sources. -
Marcus at 11:24 AM on 4 March 2011Putting a new finger on climate change
Thank you for that Tom Curtis. Seems my understanding of Carbon Isotopes is less than satisfactory. Lucky my job doesn't require knowledge of that ;-). -
Tom Curtis at 11:05 AM on 4 March 2011Putting a new finger on climate change
Marcus, C14 has a fairly short half life, but is generated by the interaction of cosmic rays with nitrogen. C12 and C13 are stable isotopes which means that they do not have a half life (or perhaps that their half life is several times the age of the universe). Because of the production of C14 in the upper atmosphere, Carbon dissolved in the ocean has a much lower CO2 content than does the atmosphere. Because of its low half life, fossil fuels contain almost no C14 (some trace amounts can be found due to ground water seepage in coal). Consequently a declining C14/C12 ratio in the atmosphere shows that CO2 is being introduced to the atmosphere from either the ocean or fossil fuels. C12 preferentially absorbed by plants in photosynthesis, so plants and anything that eats them or is produced from them (ie coal and oil) have lower C13/C12 ratios. Therefore declining C13/C12 ratios show the atmosphere is receiving CO2 from organic or fossil fuel (fossilized organic) sources. Finally, O2 is consumed in combustion. Consequently declining O2 levels in the atmosphere show the source of CO2 to be combustion. By comparing the decline of O2 to the declining C13/C12 ratio, it is also possible to determine what proportion of the CO2 comes from burning fossil fuels, and what portion comes from land use changes. -
johnd at 10:41 AM on 4 March 2011It's Pacific Decadal Oscillation
johnd at 10:26 AM, it should be clear to most readers, but in case it is not, the observations about the El-Nino/La-Nina data from NR&M are mine and not part of the JAMSTEC forecast. -
johnd at 10:31 AM on 4 March 2011It's Pacific Decadal Oscillation
thepoodlebites at 07:40 AM, just to add, whilst most people seem to focus on the magnitude of El-Nino/La-Nina events, the frequency of their occurrences is more relevant when it comes to discussing ocean based cycles. -
johnd at 10:26 AM on 4 March 2011It's Pacific Decadal Oscillation
thepoodlebites at 07:40 AM, FYI, the latest JAMSTEC, SINTEX-F1 CGCM forecast(27-member ensemble) (updated February 15, 2011) ENSO forecast: The current strong La Nina condition would decay in following boreal spring and summer seasons but would rebound in fall and persist up to early 2012. The revived one would show a La Nina of Modoki nature. IO forecast: Associated with the La Nina impact, the surface temperature in the equatorial Indian Ocean has become colder than normal in January 2011. The tropical Indian Ocean surface temperature would decrease further in following seasons but with strong warming along the west coast of Australia. In the second half of 2011, a weak negative IOD might tend to occur. Regional forecast: Associated with the La Nina influence, below-normal surface air temperature and above-normal precipitation would continue in Australia, northern Brazil, and southern Africa during the austral fall-winter. Southeastern China,southwestern Japan, US and Europe would have warmer-than-normal and dry climate during spring-summer seasons. According to data from the Queensland Natural Resources and Mines, La-Nina conditions that extended over multiple year occurred in 1892-93, 1916-17, 1955-56, 1970-72 and 1973-74-75. El-Ninos that extended over multiple years occurred in 1913-1914, 1918-1919, 1940-41,and 1991-92-93-94. Note, to avoid confusion, given the NR&M classify the years as from April to March, the beginning years are as indicated, but the ending years are at the end of March in the year following that indicated above. -
Marcus at 10:19 AM on 4 March 2011Putting a new finger on climate change
Ah thanks for that Jeff T. Though I was of the understanding that radioactive decay is also the reason for the increasingly "light" CO2 in the atmosphere-& how we can tell CO2 produced from burning coal over that produced by burning wood. Perhaps I'm thinking of C14, which has a longer half-life than C13 IIRC. I'm pretty sure that atmospheric testing of nukes screwed up the 14C levels, not the 13C levels-again, could be wrong though. -
WheelsOC at 10:04 AM on 4 March 2011Roy Spencer’s Great Blunder, Part 3
Read all three installments back at your blog. Thanks for this illuminating exercise. I wonder if we can convince Steve McIntyre to perform an "audit" of Dr. Spencer's model. -
Hockey Stick Own Goal
angusmac @132, To further Tom's point, consider also this statement from the Ljungqvist paper: The proxy reconstruction itself does not show such an unprecedented warming but we must consider that only a few records used in the reconstruction extend into the 1990s. (emphasis mine) Furthermore it is quite clear that no reconstructed data in this case was available for the 2000s. Given that it is now 2011, the assertion that "if you compare proxies with proxies ... the MWP was as hot as today" is not and more importantly cannot be supported by the proxy data alone. -
Rob Honeycutt at 09:05 AM on 4 March 2011Crux of a Core, Part 1b
Yup. Here it is... Bond event 5: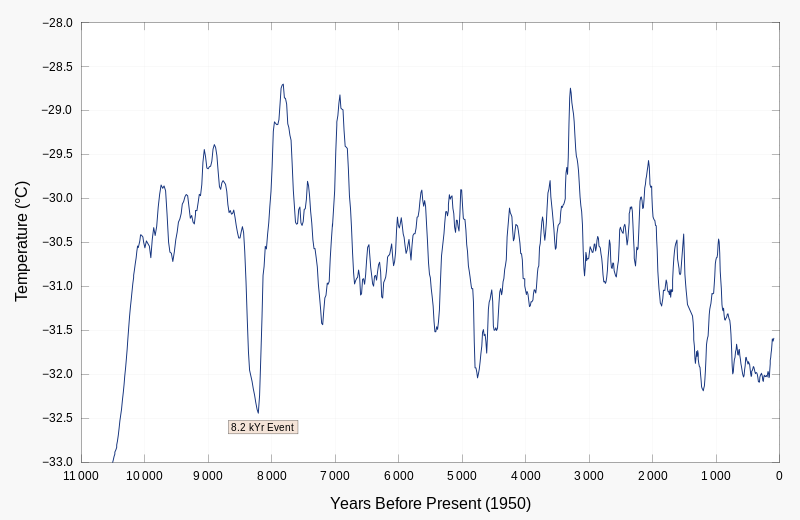 Moderator Response: [DB] Fixed image.
 -
Rob Honeycutt at 09:01 AM on 4 March 2011Crux of a Core, Part 1b
Just to add a little perspective... here would be a more appropriate combining of the GSIP2 and Vostok data: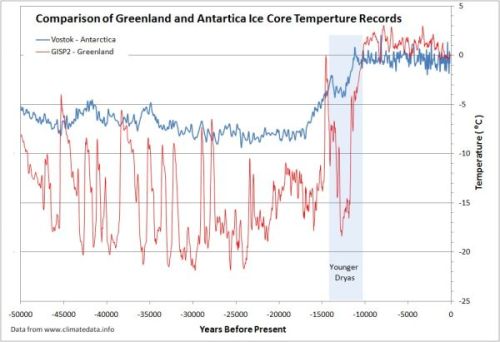 You can see how there is a very broad correlation between the two but for the most part only in terms of timing for when we come out of the last glacial. The temperature swings in the GSIP2 record are extreme compared with the Vostok record. By stretching the Vostok record to fit the GISP2 scale Dr Hall is hiding a tremendous amount of information about how these two records relate to each other.
If you look closely at the early holocene you can see that one huge jump in the GISP2 data is clearly antiphased with an equally profound response in the Vostok record.
So, the one event in the GISP2 record that shows a greater temperature trend that the current warming has a counter response in Antarctica. I'm still looking into Bond events, but I believe that is specifically called Bond event 5 at 8200 years BP.
You can see how there is a very broad correlation between the two but for the most part only in terms of timing for when we come out of the last glacial. The temperature swings in the GSIP2 record are extreme compared with the Vostok record. By stretching the Vostok record to fit the GISP2 scale Dr Hall is hiding a tremendous amount of information about how these two records relate to each other.
If you look closely at the early holocene you can see that one huge jump in the GISP2 data is clearly antiphased with an equally profound response in the Vostok record.
So, the one event in the GISP2 record that shows a greater temperature trend that the current warming has a counter response in Antarctica. I'm still looking into Bond events, but I believe that is specifically called Bond event 5 at 8200 years BP.
-
Jeff T at 08:56 AM on 4 March 2011Putting a new finger on climate change
@actually thoughtful and Marcus, DB explains the carbon isotope ratio in the post, but some further clarification might help. C12 and C13 are the stable isotopes of carbon. The ratio C13/C12 is about 1% on earth (C14 is much less abundant. It is radioactive and is used for dating biological materials, but it is not the subject of the post.) Since plants have a preference for C12, biological materials are enriched in C12. Consequently, the ratio C13/C12 is smaller in fossil fuels than it is in the atmosphere and burning of fossil fuels ought to dilute C13 in the atmosphere. The figure confirms that expectation. (The red scale in the figure is inverted. Although the red curve goes up to the right, the ratio C13/C12 is decreasing with time.) -
Tom Curtis at 08:36 AM on 4 March 2011Hockey Stick Own Goal
angusmac @132, your contention that it is inappropriate to compare the recent instrumental record with past proxy records is incorrect. The simple fact is that we do not have a broad range of proxy records with global coverage extending to the very recent past, with most proxy records extending to the 1990's at best. Therefore, a comparison of proxy records alone must be restricted to a comparison of 1980's temperatures to past temperatures, which as you point out, show near equality. But, we know from the instrumental record that the 2000's are substantially warmer than the 1980's. To insist that we should then ignore that additional knowledge is specious, and if we do not the conclusion that current temperatures are probably warmer any in the MWP or Roman WP follows. Of course, ideally we would extend the proxy record to the most recent times with high quality proxies that continue to track local temperatures over the whole calibration period. Can I expect you to by lobbying your local politician's to pay for just such an effort? Having said that, I disagree with the moderator's (DB's) responce. Northern Iberian temperatures are regional temperatures, and by themselves cannot be used as a proxy for global temperatures - a point being well established in the "Core of the Ice" threads.Moderator Response: [DB] I'm sorry, Tom, if that is how that is being interpreted. My intent was to compare the Iberian data only to "the MWP is warmer" claim. Your entire statement here is 100% correct. I have added a clarification to my response to angusmac accordingly. -
Daniel Bailey at 08:30 AM on 4 March 2011Twice as much Canada, same warming climate
Tamino has a new post up: Spring training's going to be rough on dos' playing da outdoor hockey up der, eh?
The Yooper
Spring training's going to be rough on dos' playing da outdoor hockey up der, eh?
The Yooper
-
invicta at 08:22 AM on 4 March 2011No Illusions podcast interview (and elocution lessons from an 11 year old)
invicta Maybe the question is what 'matters most, style or substance?' I have to agree with Johns daughter regarding his front of microphone technique but the replies he gave directly addressed the question and were scientifically defendable. If you compare this with for example the performance of Monckton (see Monckton Myths) whose utterances litter the web, he (Monckton) is able to answer any question with breathtaking disregard for the science and ,if this doesn't break the posting policy of sks, the universally accepted truth without so much as an er um or hint of a blush. 97% of climate scientist agree the basic argument of AGW is won but the struggle to convince the wider public and therefore electorate has a long way to go. Communication is a key part of this. BTW if you think things are bad with a eleven year old knowing everything just wait until she's sixteen. -
scaddenp at 08:03 AM on 4 March 2011Ice age predicted in the 70s
thepoodlebites - I prefer my opinions to based on reliable data dont you? -
Daniel Bailey at 08:02 AM on 4 March 2011Prudent Path Week: Polar Regions
Hey, I'm going back-to-back! Does that make me a double-threat? ;) Patrick Lockerby has just posted his first Arctic Ice update of 2011 in which he also suggests the melt has probably begun (see his post here). A teaser quote:"...why I expect the central Arctic to be essentially ice-free by the end of this Arctic summer 2011"
I luv melt season! The Yooper -
actually thoughtful at 08:01 AM on 4 March 2011Putting a new finger on climate change
Marcus - thank you that explains that very well. And then when we tested nukes on the surface we messed up C12/C13 ratios again? -
Peter Offenhartz at 07:58 AM on 4 March 2011Roy Spencer’s Great Blunder, Part 3
What a brilliant, thorough and energetic analysis! A LOT of work went into your piece. Thank you! -
dhogaza at 07:55 AM on 4 March 2011Climate Sensitivity: The Skeptic Endgame
"Oh really ? what is your guess of how many toe these sources will produce in, say, 20 years ? " Fracking of known natural gas reserves in the US would provide 100% of US consumption for roughly 100 years. This estimate comes from the oil companies who are making the hard-dollar investments in exploiting the resource. "Yes, peak oil says something : that the official estimates of resources are unreliable." True, unreliably *low* as a combination of 1) new extraction technology becoming available 2) exploration efforts uncovering new reserves 2) prices rising cause reserve estimates to rise. -
les at 07:53 AM on 4 March 2011Climate Sensitivity: The Skeptic Endgame
79/89 Eric .... I dunno... a quick google turns up Representing uncertainty in climate change scenarios: a Monte-Carlo approach, Mark New and Mike Hulme which seems to take the approach along the lines I'd imagine. -
thepoodlebites at 07:40 AM on 4 March 2011It's Pacific Decadal Oscillation
#73 Feb. 2011 UAH, -0.02, not as low as I thought. It will be interesting to see how 2011 pans out. The PDO is still negative and La Nina is hanging in there. I don't follow what you are predicting for this La Nina, Nino 3.4. Some La Nina cycles last longer than others but there is no clear trend that I can see. Before 1980, we had no El Nino's >+1.8 C between 1950 - 1971, note: during negative phase of the PDO, then 1972 (+2.1), 1983 (+2.3), 1998 (+2.5), 2009 (+1.8). And La Nina's, 1955 (-2.0), 1973 (-2.1), 1984 (-1.1), 1988 (-1.9), 1999 (-1.4), 2010 (-1.4).Moderator Response: [DB] Tamino has a post for those who see meaning in cycles where statistical significance tests show none here. -
Eric (skeptic) at 07:28 AM on 4 March 2011Climate Sensitivity: The Skeptic Endgame
Parameter A should read Parameter P above. -
Eric (skeptic) at 07:27 AM on 4 March 2011Climate Sensitivity: The Skeptic Endgame
les, let me try to simplify (and perhaps oversimplify). A model uses parameter P to determine (among others) measurement M. Measurement M can also be measured in reality for the current climate. Parameter A can be tuned so that the model matches reality in the sense that N runs of the model will produce the probability distribution matching reality. The problem is that works for the current climate and adding AGW to the climate may change parameter P. An example is weather-related parameters in GCMs because they don't have sufficient resolution to model it. For P there are merely various estimates each of which produces a different probability distribution for M. There is no simple way to combine estimates, even they had associated certainties, with model results to produce an aggregate distribution. -
angusmac at 07:21 AM on 4 March 2011Hockey Stick Own Goal
Dana in your post, "Contrary to the Idsos' claims in the Prudent Path document, Ljungqvist says the following when combining his proxy reconstruction with recent instrumental temperature data: Since AD 1990, though, average temperatures in the extra-tropical Northern Hemisphere exceed those of any other warm decades the last two millennia, even the peak of the Medieval Warm Period." However, the actual statement by Ljungqvist (2010) (my emphasis added) appears to contradict your contention: "Substantial parts of the Roman Warm Period, from the first to the third centuries, and the Medieval Warm Period, from the ninth to the thirteenth centuries, seem to have equalled or exceeded the AD 1961-1990 mean temperature level in the extra-tropical Northern Hemisphere. Since AD 1990, though, average temperatures in the extra-tropical Northern Hemisphere exceed those of any other warm decades [of] the last two millennia, even the peak of the Medieval Warm Period, if we look at the instrumental temperature data spliced to the proxy reconstruction. However, this sharp rise in temperature compared to the magnitude of warmth in previous warm periods should be cautiously interpreted since it is not visible in the proxy reconstruction itself." The crux of Ljungqvist's statement which you have minimised, is that the, "instrumental data spliced to the proxy reconstruction" should be cautiously interpreted because the recent proxy data does not emulate the recent instrumental data. In a nutshell this is the "divergence problem." Re your comment that, "Indeed by plotting data along with Moberg et al. (2005), Mann et al. (2008), and the surface temperature record, we can confirm that the three reconstructions are very similar, and all show the peak of the MWP approximately 0.5°C cooler than today's temperatures (Figure 1)." Your statement that the MWP is 0.5 °C cooler than today is incorrect because you are comparing today's instrumental measurements with yesterday's proxies. To compare instrumental temperatures with proxy temperatures is physically and statistically wrong. The correct methodology is to compare today's proxies with previous proxies. I enclose Ljungqvist's original reconstruction in Figure A and I have removed the instrumental calibration data in Figure B for clarity. Figure A: Ljungqvist's Reconstruction with Instrumental Data that was used for Calibration
 Figure B: Ljungqvist's Reconstruction with Instrumental Data Deleted
It is evident from Figures A and B that the MWP was at least as warm as the current warming period. Moberg (2005) and Mann (2008) show similar results when proxies are compared with proxies. Therefore, a correct interpretation is that all three reconstructions show that recent temperatures are similar to the MWP.
From the foregoing, it would appear that the Prudent Path does support its claim that, if you compare proxies with proxies in your three reconstructions, the MWP was as hot as today.
Moderator Response: [DB] Recent evidence shows that the current warmth experienced in Europe is unequaled in the last 4,000 years (another post on this topic is also imminent):
Figure B: Ljungqvist's Reconstruction with Instrumental Data Deleted
It is evident from Figures A and B that the MWP was at least as warm as the current warming period. Moberg (2005) and Mann (2008) show similar results when proxies are compared with proxies. Therefore, a correct interpretation is that all three reconstructions show that recent temperatures are similar to the MWP.
From the foregoing, it would appear that the Prudent Path does support its claim that, if you compare proxies with proxies in your three reconstructions, the MWP was as hot as today.
Moderator Response: [DB] Recent evidence shows that the current warmth experienced in Europe is unequaled in the last 4,000 years (another post on this topic is also imminent):
-
Climate Sensitivity: The Skeptic Endgame
In fact Gilles the "long tail" probability distribution means our sensitivity estimates are more likely to be too low than too high, quite the opposite of what you are implying. -
Marcus at 07:01 AM on 4 March 2011Putting a new finger on climate change
actually thoughtfull. I'm not 100% sure, but the reason I recall is that naturally occurring CO2 has roughly equal amounts of heavy & light CO2-which is then taken up by plants & trees. However, in the case where that CO2 was taken up *hundreds of millions of years ago*, all the heavy carbon will have decayed, leaving behind only the light CO2. So when you chop down & burn a tree which is only a few hundred years old, you'll get a relatively even mix of isotopes, but when you burn coal or oil, you'll get nothing but light CO2. Hope that explains things. -
bbickmore at 06:30 AM on 4 March 2011Roy Spencer’s Great Blunder, Part 3
Actually Thoughtfull @4, I tried exceptionally hard this time not to be too hard on Spencer-the-person, and I did listen to the commenters on the last installments. It helped when I was able to figure out how he might have gotten his best-fit parameters by sheer luck (combined with a bad statistical technique). In any case, in Part 2 I think I was a little extra hard on him because it REALLY bothers me how he blatantly mischaracterizes his opponents' position. It's one thing to botch a curve-fitting job because you don't have much experience with it. It's quite another to knowingly tell whoppers about what the other scientists think. And he did know, as I demonstrated. -
les at 06:25 AM on 4 March 2011Climate Sensitivity: The Skeptic Endgame
69 Giles I see what you're saying. I'm not at all sure that they are not doing just what I describe... it's a review paper, so a bit short of detail. In Knutti and Hegerl I can't for the life of me see any discussion of the probability of a model being right or wrong?!? But when someone says something like:running large ensembles with different parameter settings in simple or intermediate-complexity models, by using a statistical mode
they are doing what I described. In which case the likelihood function is what I said. 70 EricI think I understand how models are parameterized - I was looking for a demonstration that "perturbing parameters is not probabilistic". The proof of a model (or models) is how they compare to reality. When their parameters aren't known precisely (irrespective of what the parameters are) runs of models can be used to give estimators of how well they compare to reality covering the parameter space.Moderator Response: [Dikran Marsupial] runaway blockquote fixed -
actually thoughtful at 06:23 AM on 4 March 2011Putting a new finger on climate change
Meant carbon13 vs carbon 12 above. -
actually thoughtful at 06:20 AM on 4 March 2011Putting a new finger on climate change
Daniel, Interesting, and a great study that seems approachable. I got lost though, in why there is more CO213 now than there was then? And what do the pink and blue lines in your top graph tell us? That we have less free O2 in the air because we are burning C and adding O to create C02?Moderator Response: [DB] The pink & blue are from different locations, showing the decline of global oxygen levels as more fossil fuel CO2 is injected into the global carbon cycle, locking up oxygen atoms with the carbon atoms. A solid confirmation that "it is us". The study referenced above uses paper from dated issues to derive these ratios; see here for their results. Good questions. (Edit: Sorry for the screw-up; was bleary-eyed from 2 posts in 1 day; the portion of the graph in question concerned the O2 levels, not the Carbon isotopes as I previously wrote) -
dana1981 at 06:12 AM on 4 March 2011CO2 limits will harm the economy
BP #7 - as discussed in Monckton Myth #11, we have examined studies using discount rates ranging from 1.4% to 5%. In every case the benefits of carbon pricing exceed the costs several times over. -
Climate Sensitivity: The Skeptic Endgame
>And yes, there are good reasons for a high bias - starting with the skewness of the amplification retroaction function 1/(1-f) The "skewness" of this function simply means that we will always have more certainty about the lower bound than about the upper bound. It does not in any way imply that the bounds are less certain than calculated. It is ridiculous to refer to this as a "bias." -
NewYorkJ at 06:00 AM on 4 March 2011Crux of a Core, Part 1b
Finishing my last paragraph... On a related note, there's an important distinction between "recent warming" and "recent warmth", which can be mistakingly used interchangeably. One refers to rate of change and the other to magnitude. It's easy to show "recent warmth" is not unprecedented. The Holocene peak was possibly a little warmer than recent temperatures, and of course millions of years ago when dinosaurs roamed the Earth it was considerably warmer. Hall uses the phrase "recent warming". Over the last 2000 years, there has not been a rapid rise in temperature over a century equivalent of the last century. There are rare events in geological time that I believe exceed the rate of recent change. Although a cooling event, and mainly localized, it seems Younger Dryas would be a candidate. Such natural events also would be very likely detectable today. There's no natural mechanism that explains recent warming. -
Daniel Bailey at 05:58 AM on 4 March 2011Prudent Path Week: Polar Regions
Speaking of a warming Arctic and a decline in the sea ice there, it looks like the Great 2011 Arctic Melt Season may be underway: "Heigh-ho, heigh-ho, it's off to melt we go..."
The Yooper
"Heigh-ho, heigh-ho, it's off to melt we go..."
The Yooper
Prev 1865 1866 1867 1868 1869 1870 1871 1872 1873 1874 1875 1876 1877 1878 1879 1880 Next


