


 Arguments


Recent Comments
Prev 1875 1876 1877 1878 1879 1880 1881 1882 1883 1884 1885 1886 1887 1888 1889 1890 Next
Comments 94101 to 94150:
-
NQuestofApollo at 14:52 PM on 28 February 2011Guest post: scrutinising the 31,000 scientists in the OISM Petition Project
scaddenp – it remains stunning to me that my point is constantly missed. It is so very simple: when one sees only one side of an issue, it is evidence of a clouded view. Daniel, in his post, could only see the millions big oil has spent while ignoring the billions that team AGW is making. His comment was exactly this: “Vast riche$ await anyone who can scientifically break the chain of evidence & show the AGW is a non-worry”. The current state of spending is so completely OPPOSITE of this statement as to cause me to wonder about his motivation. For Daniel to make such a statement and then have the moderators (of which he is one) accuse me of engaging in politics is Orwellian. My point is NOT to bring politics into this issue, but to address his insertion of politics. And I have to apologize to you, I’m not good at substituting words and your critical question isn’t quite phrased correctly, so I can’t answer you. If you can rephrase this, I’ll give it an honest shot: “Got some EVIDENCE that scientists are doing the world a favour by pointing out that their is a problem are somehow making huge amounts of cash?” -
RW1 at 14:50 PM on 28 February 2011Climate sensitivity is low
RE: my 168 Actually most of the energy is not really in the window. -
Daniel Bailey at 14:45 PM on 28 February 2011Guest post: scrutinising the 31,000 scientists in the OISM Petition Project
Re: NQA (113, 114) The focus of my comment @ 109 (itself a response to your question @ 108) was points 1-8 of a logical evidenciary chain. That you focus instead on an off-the-cuff (albeit snarky, but entirely factual) throwaway quip instead of an objective dialogue-based examination of the underlying science is both telling and troubling. Resorting to the "attack the messenger" ploy may be considered both acceptable and de rigueur in other venues...but not this one. If you wish to discuss the underlying science of both climate science and anthropogenic global warming and avoid the personal attacks - then Skeptical Science is an incredible resource for learning and the sharing of knowledge in a setting protected from the emotion colouring most other sites on the internet. Here, lay persons rub elbows with scientists of all disciplines. Here, one can learn apace at leisure alone or pick the brains of experts directly. If you wish other forms of dialogue and interaction, then Skeptical Science is not the place for you. Your call. Back to the Oscars, The Yooper -
Tom Curtis at 14:36 PM on 28 February 2011Preference for Mild Curry
Andy S, so Judith Curry is publicly on record as asserting that there is a 5% chance that changes in forcing have effectively zero effect on global temperatures? Anyone who can think that there is at least a 5% chance that the changes between glacials and interglacials is entirely brought about by internal cyclical changes in the environment (as this entails) is massively disconnected from reality. -
RW1 at 14:36 PM on 28 February 2011Climate sensitivity is low
Tom, Should I add up all individual transmittance lines and divide? -
RW1 at 14:33 PM on 28 February 2011Climate sensitivity is low
Tom, Most of the radiance is in the window, so if anything that would seem like it would make the number much higher than only about 0.25? -
Tom Curtis at 14:32 PM on 28 February 2011Preference for Mild Curry
Stephen Leahy @15, a team headed by Richard Müller (see 13 above) and with Judith Curry as the only climatologist, in a research project partially funded by the Koch brothers? I can hardly wait. -
scaddenp at 14:31 PM on 28 February 2011Guest post: scrutinising the 31,000 scientists in the OISM Petition Project
NQA - everyone is allowed their values and their political opinions but there is only version of reality. It seems your arguments are largely politically inspired instead of an assessment of real science which is what DB gave you. Got some EVIDENCE that scientists are doing the world a favour by pointing out that their is a problem are somehow making huge amounts of cash? Does evidence for the Ptolemic system means there is good reason to doubt the earth goes around the sun? Do you make up all your judgements on reality on the basis of supposed motives? I think there are good reasons to be suspicious of meddling of those with a lot to lose but frankly its best to concentrate on the science, what is the best model for reality and leave the political hangups behind. -
Climate sensitivity is low
Tom Curtis, RW1 - do you have a link to the Modtran model you are using? I'm not seeing the same freedom of parameters you seem to have discussed at the model here. -
RW1 at 14:28 PM on 28 February 2011Climate sensitivity is low
Tom, "I know the average is given at the bottom. That does not mean you can use it as you are doing." How do you know? Have you added all the lines up and divided? -
RW1 at 14:27 PM on 28 February 2011Climate sensitivity is low
Tom, 'INTEGRATED ABSORPTION FROM 100 TO 1500 CM-1 = 1054.84 CM-1 AVERAGE TRANSMITTANCE =0.2465' You're saying this doesn't account for the differences in energy emitted at each line? How do you know this? -
Tom Curtis at 14:24 PM on 28 February 2011Climate sensitivity is low
@162, I know the average is given at the bottom. That does not mean you can use it as you are doing. -
Tom Curtis at 14:22 PM on 28 February 2011Climate sensitivity is low
Addendum to 161: Looking at the values, it appears quite probable that "Surface transmittance" is the surface radiation that escapes to space at each line, with transmittance rounded to five significant figures, thus showing 0 in this case. In that case, to get the transmittance you would have to calculate independently the surface radiance at the surface for each line. However, it would save you a step in integrating determining the total emissions from the atmosphere. You may need to find a manual to clarify this. Of course, the sensible thing to do would probably be to assume that no fundamental errors slipped into the programing based on the fact that a large number of independently programed models yield essentially the same result. -
RW1 at 14:22 PM on 28 February 2011Climate sensitivity is low
Tom, The average transmittance for '100 TO 1500 CM-1' is given at the bottom. Also, I tried using an emissivity of .98 and it didn't make much difference (2.3058 W/m^2 instead of 2.348 W/m^2). -
Tom Curtis at 14:15 PM on 28 February 2011Climate sensitivity is low
RW1 @158: 1) You did not account for the emissivity of 0.98 for the Earth's surface. That means Surface Radiation (SR) = 385.8 * 0.98 = approx 378 w/m^2 2) The average transmittance, ie, the sum of each line's transmittance divided by the number of lines, cannot be used as you have done it. The energy emitted at each line is not constant, so the distribution in variation in transmittance relative to the distribution in emitted energy can make very large differences in the net transmission. Therefore using a simple average of transmission will give invalid results. 3) Total radiance obviously includes values for emissions by the atmosphere, as for example at line 400: Surface Transmission: 3.18E-29 Total Radiance: 1.42E-03 Transmittance: 0.00000 Clearly with a transmittance of 0, Total Radiance would be 0 if radiation emitted from the atmosphere was excluded. To conduct the analysis you wish to make, you need to go through line by line, and sum the total of surface radiation * transmittance to get the amount of radiation from the surface that escapes to space unabsorbed. You then need to go through line by line and sum (total radiance - (surface radiation * transmittance)) to get the amount of radiation emitted from the atmosphere to space. You will then be in a position to do what you are trying to do in 158. Have fun. -
scaddenp at 14:11 PM on 28 February 20112nd law of thermodynamics contradicts greenhouse theory
"Do you disagree with this post?" Let me make a prediction: 'Yes, because a cold body cant warm a warmer body because its a violation of 2nd law thermodynamics". On and on like a broken record. Let me pose another question for damorbel. If you do an experiment and it results can be explained by the real 2nd law of thermodynamics but not by you imaginary version, then will you abandon your imaginary version? -
NQuestofApollo at 14:09 PM on 28 February 2011Guest post: scrutinising the 31,000 scientists in the OISM Petition Project
I understand. If someone you agree with dabbles in politics with cherry-picked data that supports their position: no problemo. But, when I challenge that same cherry-picked data with irrefutable facts that are against your world view, my data is deleted and I’m accused of engaging in an ideological rant. And that works for you. That Daniel’s Big Oil comment was incidental is irrelevant – the problem remains that making such a point at all while ignoring the vast riche$ being made by AGW supporters indicates a serious disconnect with reality or intentional disingenuousness. Which is what I was addressing. Naturally, that point blew past you. Next time, muoncounter, why not just tell me to sit down and shut up. It is so much more efficient. In the meantime, Daniel, how about manning up and addressing my point. I know you know what I’m talking about – stop hiding behind your delete key.Moderator Response: [Muoncounter] What would be efficient would be for you to post in accordance with the Comments Policy. No one told you to sit down and shut up; you were told that you should behave as a guest in someone's (in this case John Cook) house. The house rules are relatively simple: You don't see anyone else gratuitously dropping Al Gore references nor playing the 'man up' card, whatever that is supposed to mean. Stick to the science and the topic at hand; you might enjoy the serious discourse that results. -
RW1 at 14:06 PM on 28 February 2011Climate sensitivity is low
KR, Then why does the 2.764 W/m^2 difference outputed NOT match up to the difference in the transmittance data outputed? Are you saying it shouldn't? Explain why. What accounts for the difference? All I've done is run some calculations showing what the numbers would be dividing by 2. Those calculations using the exact transmittance data provided at least yield about 240 W/m^2 (255K) leaving. -
Stephen Leahy at 13:41 PM on 28 February 2011Preference for Mild Curry
Ms Curry is apparently a key member of a new group of prominent US physicists reassessing climate change from the ground up to "end the the war". http://www.guardian.co.uk/science/2011/feb/27/can-these-scientists-end-climate-change-war?CMP=twt_gu -
Climate sensitivity is low
RW1 - Why are you dividing by 2? Seriously, why? What Modtrans outputs is the total outgoing IR, and hence the 2.764 change on doubling CO2 is the entire, whole, complete difference between outgoing IR. Not half the amount, not twice the amount, but the whole amount. Dividing by 2 is wholly unphysical and wrong. This is the basic mistake that GW makes, and that you have repeated. It is wrong. -
RW1 at 13:31 PM on 28 February 2011Climate sensitivity is low
The first thing I notice in the data is that at 375 ppm, the average transmittance is 0.2526, and the average transmittance at 750 ppm is 0.2465 (a reduction of 0.0061 or about 2.4%). At temperature of 287.2K, the earth's surface emits about 385 W/m^2. 385 W/m^2 x .2526 = 97.251 W/m^2 passing through the atmospheric window at 375 ppm, and 385 W/m^2 x .2465 = 94.903 passing through at 750 ppm for (a reduction of 2.348 W/m^2). 385 W/m^2 - 97.251 W/m^2 = 287.749 W/m^2 absorbed by the atmosphere at 375 ppm. 385 W/m^2 - 94.903 W/m^2 = 290.907 W/m^2 absorbed at 750 ppm. Here is what I can't figure out: The output of the data is showing 255.565 W/m^2 leaving at 375 ppm and 252.801 W/m^2 leaving at 750 ppm (a reduction of 2.764 W/m^2). If I divide 287.749 W/m^2 (375 ppm) by 2, I get 143.8745 W/m^2. 143.8745 + 97.251 = 241.1255 W/m^2 leaving (255.565 W/m^2 needed to match the data?). If I divide 290.907 W/m^2 (750 ppm) by 2, I get 145.0485 W/m^2. 145.0485 W/m^2 + 94.903 = 239.9515 W/m^2 leaving (252.801 W/m^2 needed to match the data?). 145.0485 W/m^2 - 143.8745 W/m^2 = 1.174 W/m^2, which is exactly half of the 2.348 W/m^2 reduction in the atmospheric window. To match output of the data exactly, at 375 ppm there needs to be 158.314 W/m^2 from the atmosphere (158.314 + 97.251 = 255.565 W/m^2). For 750 ppm there needs to be 157.898 W/m^2 from the atmosphere (157.898 + 94.903 = 252.801 W/m^2). The difference between 158.314 W/m^2 and 157.898 W/m^2 is 0.416 W/m^2, which is the exact difference between 2.348 W/m^2 reduction in the window and the reduction in the data output of 2.764 W/m^2). What accounts for the missing 0.416 W/m^2??? -
hank at 13:28 PM on 28 February 2011Climate sensitivity is low
"he then misinterpreted ... that is a mistake." The misinterpretation. -
Andy Skuce at 13:12 PM on 28 February 2011Preference for Mild Curry
Judith Curry has recently asserted: That there is a 33% probability that that actual sensitivity could be higher or lower than my bounds. To bound at a 90% level, I would say the bounds need to be 0-10C. Her previous bounds were 1-6 degrees C. This means that she is saying that climate sensitivity could be greater than 10 degrees five percent of the time and greater than 6 degrees in 16.7% of possible cases. This would make her more alarmist than anybody I know. As a commenter on her blog remarked: 0-10C at 90%? I’d say that makes you more of an alarmist than anyone I’ve ever read. Hansen is Pollyanna in comparison. That looks like a 50% chance of the end of civilization. At the other end of her range she seems to accept the possibility that negative sensitivities are possible. Her range of uncertainty possible outcomes spans everything from the most, er, skeptical to the extreme alarmist; surely, a bridge too far. Perhaps that was just an off-the-cuff comment and we shouldn't take it too seriously. It was, however, made by a climate scientist on a popular blog aimed at the general public. In contrast, the "hide the decline" comment was made years ago in private between scientists who knew how to interpret such a remark, yet we still have Climate Etc devoting entire blog posts to this phrase, as if it were consequential. -
Tom Curtis at 13:04 PM on 28 February 2011Climate sensitivity is low
You did not show the data output. However, with settings as indicated and 375 ppm CO2, the base output is: I, W / m2 = 255.565 Ground T, K = 287.20 For 750 ppm, the output is: I , W / m2 = 252.801 Ground T, K = 287.20 The difference in I is 2.764 w/m^2. That is the difference, according to this model, between the IR leaving the atmosphere with 350 ppm and with 750 ppm. Plainly, if that is the IR leaving the atmosphere, it is incorrect to divide it by two to determine the difference in the IR energy leaving the planet in the two cases. But that is exactly what George White does with his equivalent calculation. -
Tom Curtis at 12:41 PM on 28 February 2011Preference for Mild Curry
Protestant, having watched Prof Müller's presentation, I would certainly take any paper by him with a large grain of salt, for he is prepared to lie, and lie repeatedly to make political points: Case in point, he claims that scientists would say they have "seen the data" because they have seen a graph with a stated 50 year smoothing. - Nonsense, no scientist is unaware that the plot of a 50 year smooth will not follow the actual data points. In fact, no moderately competent layperson would be so mistaken. Further case in point - he says "they" smoothed the graph so that the transition from paleo to instrumental data would not be evident. - Nonsense, smoothing is routinely done in all branches of science to show overall trends over particular time scales. In this case, smoothing highlights the real differences between the reconstructions by making it obvious on the graph. Further case in pont - with respect to the WMO graph (the only one he refers to, and the most obscure) he keeps on referring to "they" did this, and "they" did that. - Again, nonsense, Jones and Jones alone prepared the WMO report. Müller is obviously trying to conceal this fact so he can tarnish the whole group of scientists. Further case in point - He says the data was not made available. As noted above, the caption of the graph referred readers to a repository of the data accessible on the Internet. The data for Jones et al (1998), for example, was last updated at that site in December 1998, and has presumably been available since then. Mann et al 1999 has files last modified in March 1999, and hence available since then, although the parent directory was last modified in 2003. Briffra 1998 was last modified in 2003, and Briffra et al (2001) last modifed in 2002, are also now available and there is no reason to think they were not available at the time. In fact, what he has done is assumed the genuine difficulties in obtaining the source data for the HadCRU temperature series applied to all attempts to get original data, which is simply false. Case in point - he claims to be able to show "the original data" that was concealed, but does not show the HadCRU temperature series, but rather the graphs of Mann et al 1999, Jones et al 1998 and Briffa et al 1999, all of which were originally published as graphs in the original publications. In those graphs, he even distorts the data himself. He extends the data to 2000, when it only goes to 1991 and He shows a decline more than double that in the original data. Here is the original data as plotted in Briffa et al 1999 without any hiding of the decline, or truncation of data, for comparison with Müller's as shown by you.: (Briffa et al's data is shown in green.)
Given the nature of his talk, this deception show breath taking hypocrisy.
(Briffa et al's data is shown in green.)
Given the nature of his talk, this deception show breath taking hypocrisy.
-
RW1 at 12:27 PM on 28 February 2011Climate sensitivity is low
"Looking at the Modtran model you can clearly see that that is a mistake." I've spent the last hour or more looking at the detailed line by line output and don't see the 'mistake' you're referring to. I do see that the atmospheric window is included in the data though (more on that in my next post). Also, I know this model is out of date, but for the purposes of understanding what these numbers mean, let's break them down as they are. Here are the inputs I'm using: CO2 (ppm) 375 & 750 CH4 (ppm) 1.7 Trop. Ozone (ppb) 28 Strat. Ozone scale 1 Ground T offset, C -1 hold water vapor pressure Water Vapor Scale 1 Locality 1976 US Standard Atmosphere No clouds or rain Sensor Altitude km 70 Looking Down This is the data output I'm looking at. -
Australia's departing Chief Scientist on climate change
Ken Lambert - The post you refer to was a long Gish Gallop of topics better discussed (and quite disproved) on other threads, with added ad hominem remarks. I'm not surprised it was deleted. -
robert way at 12:26 PM on 28 February 2011Preference for Mild Curry
Protestant, First of all I was using Gavin Schmidt's evaluation of her not my own. And yes Gavin Schmidt is far more qualified than she is on the subject. Secondly, Dr.Joseph Romm's word I would trust before Dr. Curry's on the subject of climate science. Thirdly, where do you come off attacking my academic qualifications in paleoclimate? I'm just curious how you seem to be so aware of my background or what groups I work with. Finally, the biggest misinformation/ad hominem place in the field is steven goddard's site without a doubt, 2nd is WUWT do you need for me to go and fetch you tangible evidence? -
Ken Lambert at 12:20 PM on 28 February 2011Australia's departing Chief Scientist on climate change
I read and copied (luckily) a long post from BP. It corrected Bern's numbers. It has been deleted without comment by moderators. It should be compulsory reading for all SKS contributors. John Cook et al; this is unwarranted censorship of a valuable contribution which will do harm to the credibility of this site. -
Bern at 12:08 PM on 28 February 2011Australia's departing Chief Scientist on climate change
Ed Davies - it wasn't my estimate - it came from the University of Michigan. (was a story linked from the SkS tweets on the right side of the page) I have to admit I didn't do the calcs to see how realistic it is. I understand insolation is a bit higher than 1000 W/m2, though, so your figure is a bit low - but I agree, 150-odd petawatts total insolation, so the albedo figure should be at least an order of magnitude less, probably several, as it still only affects a small part of the earth's surface. -
2nd law of thermodynamics contradicts greenhouse theory
damorbel - One last quixotic attempt: The surface of the Earth receives energy 'A' from the sun. If there were no other elements involved, the Earth would have to be at an equilibrium temperature sufficient to thermally radiate 'A' to space. Otherwise it would warm or cool until the incoming radiation power matches the outgoing. Now we introduce an object cooler than the Earth (at some temperature above absolute zero) that radiates 'B' to the Earth. It doesn't matter what power level 'B' is - other than it is > 0. The Earth now receives 'A + B' power, where 'A + B > A'. The Earth must now radiate a power 'A + B' in order to regain equilibrium. Since power radiated scales with T^4, this means that the Earth when radiating 'A + B' must be warmer than when radiating 'A'. Cool objects add energy to all nearby objects, even warmer ones, and cause them to be warmer than they would be in the absence of those cooler objects. Otherwise you would be violating the first law of thermodynamics - conservation of energy. The atmosphere is cooler than the Earth, but still warms it accordingly to a higher temperature than it would be without a greenhouse gas containing atmosphere. Do you disagree with this post? And if so, how do you justify it? -
Tom Curtis at 11:27 AM on 28 February 2011Climate sensitivity is low
RW1 @151, it is no surprise that the figures are close to George White's in that GW used a hi-tran model to get his figures. He then misinterpreted the Outgoing Long-wave Radiation as being the the total energy emitted from the top most layer of the atmosphere, and divided it by two to get what he believes to be the OLR. Looking at the Modtran model you can clearly see that that is a mistake. That model calculates the IR radiance at a given location that is either out going, or incoming. You can set the altitude to 0 and Look Up to calculate the back radiation. Or you can use the default to set the altitude to 70 km and look down to model what a satelite at 70 km altitude would detect. Clearly that satellite is not going to detect the radiation that is returning to the Earth, it will only detect the OLR. So, the I(out) of the model with that setting is the OLR. There is no need to divide it by two, and doing so shows complete incompetence on this subject. (Not a problem in somebody who is trying to learn, but a huge problem in someone like George White who purports to lecture.) -
Alexandre at 11:08 AM on 28 February 2011Roy Spencer’s Great Blunder, Part 1
Thanks Nick #19 Yes, sensitivity estimates point to a larger positive feedback. My point was simpler, though: as I understand it, a warming caused by cloud albedo changes would mean an extra LW going unobstructed to the TOA. This increase does not match the LW observations you mentioned. If that's right, no complicated cloud model would be required to point flaws in Spencer's theory. It's so simple that I got the feeling I was oversimplifying it and missing something important. -
Tom Curtis at 10:55 AM on 28 February 2011Climate sensitivity is low
RW1 @150, if you care to look at the settings, Modtran is run for specific typical locations, with the default being the tropics. It does not produce a globally averaged result. Because the tropics is warmer than the global average, OLR at the tropics is warmer than the global average of approx 240 w/m^2. As set for default, it also does not include the effect of clouds. Further, and for the umpteenth time (as this is just your same question in a different guise) the OLR from the atmospheric window is included in the calculation. This can clearly be seen in the graph of the emissions for each model run. It can also be seen with line by line detailed data by viewing the whole output file. If you want a closer approximation to the global average, use the 1976 US Standard atmosphere (effective brightness temperature = 259 K). Alternatively, use the ground temperature offset to either set the surface temperature at 288 K (effective brightness temperature = 257 K), or adjust it to match an output of 240 w/m^2, and then run the doubling of CO2 experiment. As previously indicated, this is an obsolete model. And as implemented on the net, it does not even allow us to control all parameters so that you cannot set up a globally averaged surface temperature plus cloud cover. It's use is to show you quite clearly that the 3.7 w/m^2 is the difference in total OLR from doubling CO2. If you want a more up to date model, you'll have to pay the licensing fees. -
bbickmore at 10:53 AM on 28 February 2011Roy Spencer’s Great Blunder, Part 1
Wingding #6, Sorry if that sentence offended you--I was just trying build up a little suspense for the next installments. If I didn't have the goods, however, I wouldn't have said it. Read Part 3 when it comes out, and let me know whether you're still offended. -
Bill Logan at 10:42 AM on 28 February 2011Preference for Mild Curry
Protestant, the fact that anyone can call the graph in question dishonest or misleading because: "most of the people who read it have no understanding on statistic techniques or the major uncertainities on such statistical excercises" is a mind bender. Its a technical publication. The people to whom you refer feel comfortable passing judgment on technical literature they don't understand. They are perfectly at home making despicable statements about the character of the scientists involved based on statistical methods that they don't have a clue about. The explanation in the text could not be more clear. If the person reading it is unable to process the explanation they should assume they can't understand the data on the graph, and should get someone that does understand it to explain it, before they draw conclusions that they are, by your own evaluation, unqualified to draw. There is absolutely nothing wrong with the way the information is presented except for the fact that the people judging it are unqualified to do so. Thank you for pointing that out. -
Riduna at 10:38 AM on 28 February 2011Australia's departing Chief Scientist on climate change
What I find disconcerting is that Professor Penny Sackett, Chief Scientist for Australia should be leaving office after 2.5 years without having ever met Prime Minister Gillard and without ever having briefed her on AGW, "the most pressing issue of our time". Julia Gillards' protestations that she believes in AGW, her policy of not adopting a meaningful 2020 CO2 reduction target and her ongoing deferral (5-7 years) of an ETA, combined with Penny Sacketts' departure makes Australia a double looser. Let us hope that before leaving our shores and thereafter Dr Sackett will remind us of the very real urgency for Australia and the rest of the world, particularly the top 20 emitters, of the urgent need to deal effectively with curbing greenhouse gas emissions. Thank you Penny Sackett for all your work. -
scaddenp at 10:29 AM on 28 February 2011CO2 lags temperature
Well a,b,c is no. of cycle repeats in 2*pi! Try say =(0.3*SIN(0.00006283*B1) + 5*SIN(0.000299199*B1) + 2*SIN(0.000153248*B1)) (which has frequencies around the milkanovich). Note no phase terms either. Now you have peaks of different size and magnitude but a very long time before they repeat (I graphed say from angle 0.01 to 710000). However, I agree though that the cycles are the major driver, a lot of other factors play as well, and yes, random, not chaotic. -
Tom Curtis at 10:25 AM on 28 February 2011Scientists tried to 'hide the decline' in global temperature
I have discussed the WMO report here. The essential points: 1) The caption of the figure explicitly mentions the inclusion of instrumental data; 2) The caption explicitly refers the reader to a discussion of the data, including the divergence problem that was both published and available on the web; and 3) The caption explicitly refers the reader to a repository of the original data available on the web. Given that, there can be no question of dishonesty, or intent to mislead involved. -
Tom Curtis at 10:19 AM on 28 February 2011Preference for Mild Curry
"The World Meteorological Organization (WMO) document in question was an obscure report, for which a figure was provided for its cover depicting both instrumental temperature data and reconstructed temperatures based on tree rings. Criticisms of this figure are valid, as the methods used to create it are not discussed in the report. " On the contrary, the WMO figure had the caption: "Front cover: Northern Hemisphere temperatures were reconstructed for the past 1000 years (up to 1999) using palaeoclimatic records (tree rings, corals, ice cores, lake sediments, etc.), along with historical and long instrumental records. The data are shown as 50-year smoothed differences from the 1961–1990 normal. Uncertainties are greater in the early part of the millennium (see page 4 for further information). For more details, readers are referred to the PAGES newsletter (Vol. 7, No. 1: March 1999, also available at http://www.pages.unibe.ch) and the National Geophysical Data Center (http://www.ngdc.noaa.gov). (Sources of data: P.D. Jones, K.R. Briffa and T.J. Osborn, University of East Anglia, UK; M.E. Mann, University of Virginia, USA; R.S. Bradley, University of Massachusetts, USA; M.K. Hughes, University of Arizona, USA; and the Hadley Centre, The Met. Office)." The use of instrumental information is explicitly mentioned. Further, as three reconstructions are listed, and only three plots are present on the graph, by logical inference instrumental data must have been used on those plots.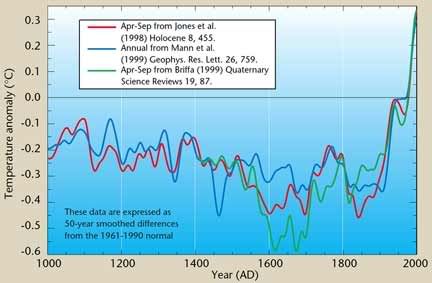 Following up to PAGES takes you to an article by Briffa in which he discusses the divergence problem:
Briffa, K.R., 1999
“Analysis of dendrochronological variability and associated natural climates - the last 10000 years (ADVANCE-10K).”
PAGES Newsletter 7 (No. 1), March 1999, 6-8 (R)
Following up to NOAA takes you to original data
A case can be argued that Jones should have plotted the reconstructions and the surface station data seperately. But that is just an issue of best presentation, not of deception. Any suggestion that Jones' was dishonest in preparing the WMO graph when he explicitly mentions the inclusion of instrumental data, refers you to a discussion of the divergence problem, and refers you to the original data, is absurd.
Following up to PAGES takes you to an article by Briffa in which he discusses the divergence problem:
Briffa, K.R., 1999
“Analysis of dendrochronological variability and associated natural climates - the last 10000 years (ADVANCE-10K).”
PAGES Newsletter 7 (No. 1), March 1999, 6-8 (R)
Following up to NOAA takes you to original data
A case can be argued that Jones should have plotted the reconstructions and the surface station data seperately. But that is just an issue of best presentation, not of deception. Any suggestion that Jones' was dishonest in preparing the WMO graph when he explicitly mentions the inclusion of instrumental data, refers you to a discussion of the divergence problem, and refers you to the original data, is absurd.
-
Nick Palmer at 10:18 AM on 28 February 2011Roy Spencer’s Great Blunder, Part 1
Alexandre #14 "If this warming were caused by cloud albedo, that would mean this albedo would have been decreased, that is, more shortwave radiation from the sun would have reached the surface to heat it up." I'm no expert but Spencer's ideas seem to be rather like Lindzen's - a variation of L's Iris theory. By now there should be sufficient satellite albedo measuring data to have measured changes in the relative proportions/densities of cirrus vs cumulus vs stratus clouds in the various areas of the globe. Measurements of incoming SW radiation at the top of the atmosphere must be very well known. Changes in outgoing LW radiation over several decades must be known. Importantly, any changes in "reflected back out to space" (off the tops of the clouds) SW radiation must be known. Surely, all these figures boiled up together could establish whether the net feedback from clouds of all types is negative or positive. That the net cloud feedback could be neutral or negative seems to be falsified by paleoclimatology where I believe evidence shows that relatively small natural forcings were not significantly damped but led to rather large changes over time befeor equilibrium was re-established. Spencer, Christy and Lindzen are not expert paleoclimatologists are they? -
WheelsOC at 10:06 AM on 28 February 2011Roy Spencer’s Great Blunder, Part 1
@17 A tactic taken by the Intelligent Design movement as well. They know that there's no scientific research backing them up, and they don't even try to make up the deficit there (to Spencer's credit he USED to submit papers for peer-review, though now he has chosen to stick with refereed letters journals). Instead of participating in the scientific venues and making their arguments where they'll get the most exposure to expert opinion, they instead focus on a campaign of popular opinion. If they can convince enough of the public, then it doesn't matter to them how little support there is in the scientific community. It's perhaps quite telling that Dr. Spencer is also a self-described ID advocate who thinks that the scientific case for evolution is, at best, the same level as that for ID. If he continued to do good work in climate science without letting his IDist sympathies creep in that would be one thing, and I wouldn't make much of it. Everyone's entitled to some wacky eccentricities if it does no harm. However, time and again you can see him applying the same pro-ID rhetoric and baloney arguments to his opinion of climate change: belief in an academic conspiracy to suppress dissent, becoming more withdrawn from the scientific community, calling the consensus a faith-based position, refusing to acknowledge the broad body of evidence in support of the consensus while taking a few seemingly incongruous tidbits to support the opposite of the mainstream view, and focusing more on generating public controversy and division than on generating scientific support and understanding for his case (i.e. the Dessler press conference example). -
Dikran Marsupial at 10:06 AM on 28 February 20112nd law of thermodynamics contradicts greenhouse theory
" Since there is momentum exchange in both directions but the energy transfer is only in one direction you should thus be able to grasp the physics behind the 2nd law." That is obviously incorrect, every photon that is emitted by the shell and is absorbed by the body within has transferred energy from the cooler shell to the warmer body. You still haven't given a clear answer to what happens to the second body within the shell when it is heated. Keep it simple, does it (a) get warmer (b) stay the same temperature or(c) get cooler? -
Sean A at 10:00 AM on 28 February 2011Preference for Mild Curry
No Evidence of Wrong-Doing by NOAA Climate Scientists - This OIG report came out on the 18th (link to full report in article). Basically, another CRU hack investigation concludes that scientists are clear of any wrongdoing. - Curry's post is dated the 22nd. Talking about "hide the decline", accusing scientists of dishonesty. -
JMurphy at 09:57 AM on 28 February 2011Preference for Mild Curry
I don't understand what Curry is up to. She claims to be trying to build bridges but it's difficult to work out where those bridges are going from and to : she seems to be constantly accusing certain scientists (and the IPCC as a whole) of dishonesty, etc. and doesn't appear to want to build bridges in that direction; but is constantly appearing on CA and WUWT (and allowing all sorts of accusations and various forms of wild denial on her own website), playing to the crowd. It seems to me that she is trying to build bridges between the so-called skeptical blog scientists and the minority of the general public who spend any time reading blogs, and who might be persuaded to become sceptical because they don't really know who to believe. All very strange. -
damorbel at 09:37 AM on 28 February 20112nd law of thermodynamics contradicts greenhouse theory
Re #389 Dikran Marsupial You wrote:- "Do you agree that heat energy can be transferred from a cooler body to a warmer object? " I wrote in #382:- " Since there is momentum exchange in both directions but the energy transfer is only in one direction you should thus be able to grasp the physics behind the 2nd law." And that is the complete answer to your question. Perhaps I can expand it. The Kinetic theory of heat replaced the Caloric theory in the 2nd 1/4 of the 1800s. This theory is that, above 0K all molecules are in a continuous state of vibration with momentum proportional to temperature. Momentum and energy are closely related momentum p = mv; it is a vector quantity because v (velocity) is a vector. The energy of moving particles is E = 1/2mv^2 which is not a vector quantity because v^2 is not a vector. Since heat transfer has a direction, it needs some kind of vector (you can use energy gradient but it is clumsy) to define the direction of heat transfer; momentum is much more handy. So heat energy tranfer goes from the high momentum/high temperature place to the cold/low momentum place but there is all the time (unless the cold side is at 0K) a tranfer of momentum in both directions but the average is fron the hot side to the cold side. You ask me:- "Do you agree that heat energy can be transferred from a cooler body to a warmer object? " Don't you see that the answer must be no? The mechanism of transfer (as well as all observations) make it impossible. -
Phila at 09:19 AM on 28 February 2011Roy Spencer’s Great Blunder, Part 1
rhjames: Some people think positive will dominate, and others suggest negative. Some people think the sun is made of hydrogen and helium, and others suggest it's made of iron. Fortunately, Spencer has shown us how to settle vexing questions like these: bypass scientificconsensusgroupthink, and put the question up to a popular vote. -
Albatross at 09:18 AM on 28 February 2011Preference for Mild Curry
Protestant, Curry has very clearly demonstrated that she does not have credentials to speak to paleo data, nor does she have the credentials to speak to climate sensitivity, she things the 90% confidence interval for climate sensitivity lies between 0 to 10 C for goodness' sakes. She is an embarrassment to the scientific community. The divergence problem, IIRC, refers to only one particular dendro chronology, not all dendro chronologies. Protestant, while you are vehemently objecting to plotting thermometer and paleo data on the same graph, please be sure to also tell Ljungqvist and McShane and Wyner that they should have not included the thermometer data on their reconstructions. I'l let someone else address Muller's intriguing talk. And can I take this opportunity to remind everyone that is is now 2011, and not 1999. And I find your comments about CP laughable, you clearly have never read CA or WUWT, now those are in reality probably "the biggest disinformation &ad-hominem site[s] on the whole field" -
RickG at 09:14 AM on 28 February 2011Preference for Mild Curry
protestant: The proxies are inaccurate and do not respond solely on temperature, so there is no reason to hide any data. That is *not* scientific practise deleting adverse data. Why would anyone use data they know to be incorrect? -
Alexandre at 09:08 AM on 28 February 2011Roy Spencer’s Great Blunder, Part 1
rhjames #13 said Some people think positive will dominate, and others suggest negative. Please try to learn why some people think it's positive, and why so few claim it's strongly negative. That will give you more background to your surprisingly confident assertion "the fact is, we don't know". A good starting point may be the post on Climate Sensitivity, here on SkepticalScience.
Prev 1875 1876 1877 1878 1879 1880 1881 1882 1883 1884 1885 1886 1887 1888 1889 1890 Next


