


 Arguments


Recent Comments
Prev 1873 1874 1875 1876 1877 1878 1879 1880 1881 1882 1883 1884 1885 1886 1887 1888 Next
Comments 94201 to 94250:
-
JMurphy at 22:00 PM on 27 February 2011Meet The Denominator
The papers are listed to support skepticism thus a paper that demonstrates a precedent of natural climate change caused by solar activity supports skepticism of CO2 being a past primary climate driver, which supports skepticism of it being a present primary climate driver. Wow. I think there should be a new name for this sort of convoluted 'logic' - 'Pop logic'. I must try and write a paper which demonstrates a precedent of forest fires caused by lightning, which supports skepticism of humans being the cause of past forest fires, which supports skepticism of them being a present cause of forest fires. "Perhaps you meant just reading the abstract. In which case, I will challenge you to point what, in the paper's abstract, supports your position." This error has already been corrected. I am not going to waste time debating papers I have removed from the list. Ah, so you can't point out any support from that abstract because there isn't any, because you misread it somehow. Undoubtedly not the first time that has happened with you and your little list and it won't be the last time. Guaranteed. Rob Honeycutt, "Climate is a hot topic because of people's alarm about AGW." Incorrect, this is due to increased government funding. And finally we have the conspiracy theory : 'Follow the money'. It always ends up all being a conspiracy theory with those who, ultimately, have no other arguments. Once that hole has been dug, there is no escape for any so-called skeptic except retreat into fully-fledged denial. -
Dikran Marsupial at 21:23 PM on 27 February 20112nd law of thermodynamics contradicts greenhouse theory
Damorbel@382 O.K. I can see you are unwilling to discuss the science and want to bog the discussion down with pointless pedantry after I had already altered my terminology to suit you (from "flow" to "transfer"). Suit yourself, it is a tacit admission that your position is indefensible - if it weren't you would have the confidence to engage in the thought-experiment. -
Dikran Marsupial at 21:12 PM on 27 February 2011Meet The Denominator
Poptech@754 Ignoring the attempts at rhetoric, which are way too dull to bother with any longer, and sticking to the science. The fact that climate change has been caused by solar forcing in the past is no reason to be skeptical of anthropogenic climate change now; your argument is based on a logical fallacy. Forest fires have been cause by lighning for millions of years, but that is no reason for skepticism that they are also caused by carelessly discarded cigarettes and deliberate arson now. Hence the paper we were discussing earlier is only grounds for skepticism if you are not bothered about the logical consistancy of your position. Of course I am not saying that there is no evidence for CO2 as a driver of climate. There have been occasions where rises in long-lived GHGs (principally CO2) have driven climate change, for instance the emergence from the cryogenian snowball Earth (which cannot be explained using changes in solar forcing becuase of albedo feedback). There have also been occasions where increased chemical weathering due to uplift of mountain ranges caused a fall in CO2 resulting in cooling. However that is beside the point, the fact that CO2 was rarely a primary driver of paleoclimate (where it has acted principally as a feedback mechanism) doesn't mean it can't be a primary driver now that we are over-riding the feedback mechanism by burning fossil fuels - so that is another logical fallacy on your part. Besides, the fact that carbon dioxide is a greenhouse gas does not rest on the idea that it has ever been a primary driver of climate, so that is a straw man on your part. It is based on experimental evidence, it is based on observation, and it is based on well developed theory. -
damorbel at 21:08 PM on 27 February 20112nd law of thermodynamics contradicts greenhouse theory
Re #381 Dikran Marsupial you wrote:- "it makes no difference to the argument" I'm afraid it does make a difference. Between atoms and molecules heat energy is transferred by processes which result in the exchange of momentum. This is most obvious with gases in which case the momentum exchange is by inelastic collision; here the billiard ball analogy is very helpful for many people but for solids and liquids it is intermolecular forces that do the same job. For a gas one may imagine a surface accross which you wish to measure the heat transfer, the temperature is different on either side of the surface, thus the mean velocity of the molecules on the hot side is higher than the mean velocity on the cooler side. The velocities of the molecules on both sides have a wide range which is described by the Maxwell-Boltzmann distribution; when referring to the 'mean velocity' (above) it is the mean of the velocities in the Maxwell-Boltzmann distribution. So when there is a temperature difference accross a surface the molecules on both sides of the surface exchange momentum by colliding with each other but on average the hotter molecules lose momentum and the cooler ones gain momentum; this is the basic theory behind the 2nd law of thermodynamics. Since there is momentum exchange in both directions but the energy transfer is only in one direction you should thus be able to grasp the physics behind the 2nd law. Energy transfer by photons is no different except the 'collisions' are purely electromagnetic. Photons tranfer energy by momentum exchange also; Einstein wrote a very good paper about this in 1917. Between two adjacent bodies of nearly equal temperature there is a very large exchange of photons but only a small exchange of energy. With photons the energy follows the Planck distribution; Einstein showed in his paper how it is equivalent to the Maxwell-Boltzmann distribution. -
Bibliovermis at 19:26 PM on 27 February 2011Meet The Denominator
What is the purpose for the increased funding and what is the relevance to the validity of the accumulated scientific knowledge that has resulted from it? -
adelady at 17:55 PM on 27 February 2011Prudent Path Week: Polar Regions
Mike, if you have a good look at ocean temperatures you'll most likely see the major cause of the fast melting. It's entirely possible that there may have been "cycles" promoting more, or less, melting before we ejected this huge bolus of GHGs into the atmosphere. After all, the extent varies year to year, even now. The ocean is taking in the greatest amount of the warming, 93%, and the underside of the Arctic sea ice is always exposed to this. During seasons other than winter, more and more of the edges are also exposed to more and more of the warmer ocean waters. And the more it melts, the higher the exposure to the melting mechanism. I'd like to think that there's an oscillation that will restore, even partially, the sea ice cover. But I see no data or evidence of recovery and I know of no physics that could give such a result. Unless someone's seen something showing a slowdown in ocean warming, I think this idea is just a lovely dream. -
Tom Curtis at 17:42 PM on 27 February 2011Dispelling two myths about the tropospheric hot spot
Albatross, I'm happy to give you my thoughts as a layman, but I have exactly zero expertise in this area, so I don't know how much help that will be. I was interested, however, to note that the articles you linked to tended to confirm my initial thinking on the topic. Here goes: The key aspect of a thunderstorm is the updraft driven by the latent heat of condensation. Clearly, the warmer the air below, and the cooler the air above, the easier it is to generate and sustain the updraft. The key difference between aerosols from wood fires (and coal fires without scrubbers) is that its major component is black soot. Because it is black, it absorbs solar radiation warming the air around it, but cooling the air beneath it. In this it contrasts with sulfates, dust and salt which reflect sunlight, cooling both the air around it and below (but warming the air above it). This means that absorbing aerosols will tend to warm the air immediately above the cumulus layer, and cool the air in the cumulus layer, thus forming a barrier against the formation of updrafts. In contrast, reflecting aerosols will cool both layers equally with no resulting consequence for the ability to form updrafts. Both types of aerosols will act as cloud condensation nuclei, thus causing water to precipitate out slower. Your second reference says this will encourage thunderstorms at low concentrations, and your third says it will encourage it at low concentrations, but cause the clouds to evaporate too soon at high concentrations (because of increased surface area of the smaller drops). That makes sense to me, but carries me further than I can be sure logic won't lead us astray. So, based on that, I would say the key difference is the type (absorbing or reflecting) or aerosols that dominate in forest fire smoke or over the North Atlantic. In that respect, India's aerosols have a very high black carbon content for anthropogenic aerosols (about 25%) because so much of it is caused by cooking fires. China does not, because of the use of high sulfate fuels (like Australian coal). Would this effect the hot spot? I don't know. Most sulfates precipitate out within few weeks or origin, particularly black carbon. Because of that, most of the impact of sulfates is regional. But, about 1% of sulfates enter the stratosphere where they can take years to precipitate out and have global effect. That means neither Indian nor Chinese aerosols would be particularly prevalent in the tropics. On the other hand, forest fires in the Amazon, Indonesia and equatorial Africa have become prevalent and may have the effect you describe. As to the Hot Spot itself, evidence at the moment favours its not existing, but theory strongly favours its existance. Whether observations come to the rescue of theory or not, who knows? I don't think it is that important anyway. After all, solar forcings (and reduced cloud or aerosol albedo forings) predict a stronger hot spot than do green house forcings because they have a stronger effect in the tropics. So, to the extent that a missing hot spot is a problem for AGW, it is more of a problem for its competitors. Further, a missing hot spot may mean a weaker water vapour feedback, but it certainly means a weaker lapse rate feedback (it is after all, just the consequence of the lapse rate feedback). That means a missing hot spot is not likely to result in significant changes in estimates of climate sensitivity, and certainly won't change those based on paleoclimatology. Consequently, my feeling is that the issue is technically interesting, but almost irrelevant in terms of policy considerations. Finally, the missing hot pot is probably down to a hungry thief. (Sorry, couldn't resist.) -
Bern at 17:36 PM on 27 February 2011Australia's departing Chief Scientist on climate change
Like Lou, the first I heard of Ms Sackett was the news story about her resignation. A sad state of affairs, but I don't know who is to blame (although a fair share could be laid at the feet of the media for not considering science 'sexy' enough to get airtime, there are other players around). Regarding the committed warming - I was chatting to my brother the other night about the recent estimates of the effects of albedo change, due to less snow & ice cover. The estimated energy difference is 100 petawatts. That sounds awfully big, if you know what the 'peta' prefix means. For everyone else, it's 100,000,000,000,000,000 watts, which is just a ridiculously big number. What does it mean, though? Wivenhoe Dam, the main water storage for Brisbane, holds 1.4 million megalitres of water - at current rate of usage, that's enough to supply Brisbane for five and a half years. The energy imbalance due to albedo changes is enough extra energy to boil that dam dry in 30 seconds. (about 3 seconds to raise it from 20º to 100ºC, and another 27 or so to boil it) Firstly, I'm glad that it's spread over a very large area, rather than concentrated. Secondly, that's a scary amount of extra heat, and it's no wonder the permafrost up north is defrosting, and the arctic ice is shrinking each year... -
Albatross at 16:53 PM on 27 February 2011Crux of a Core, Part 1 - addressing J Storrs Hall
BP, I see that you have not decided whether or not to take issue with Dr. Alley's concerns and caveats, but rather try and obfuscate by moving the discussion from Greenland to the tropics. The data in question are those of Dr. Alley and he, more than you or I , or anyone else for that matter, is more qualified to speak to them. The point is, is that the GISP 2 data are being misrepresented by "skeptics" to misinform and confuse the public. Surely you do not endorse that? Do you? "You can check at the NASA GISS Monthly Latitude Insolation page that annual average insolation at TOA (Top of Atmosphere) has been increasing steadily (by 1.2 W/m2) along the equator during the last 10 thousand years (from 416.2 W/m2 to 417.4 W/m2)." That is interesting, I have no reason to doubt the NASA data, but these data do not seem to support the claim that annual tropical insolation has been increasing the last 10 K. Anyhow, back to Greenland please.... -
Bibliovermis at 16:39 PM on 27 February 2011Meet The Denominator
We've come back around to the topic of the post - meet the denominator. The 2010 US federal budget for climate change research was $2.12 billion. The total budget was $3.59 trillion. Climate change research accounted for 0.06% of the federal budget. More money went to oil subsidies than went to climate change research. In 2006, $3.5 billion went to oil subsidies. Government Financial Subsidies Budget of the United States Government Thanks are due to NQuestofApollo for referencing the climate change research funding. -
Albatross at 16:30 PM on 27 February 2011Dispelling two myths about the tropospheric hot spot
Tom @20, Thanks for your thoughtful post. I think you raise a potentially critical point above (your #4). If aerosol loading has been increasing substantively in recent decades over the tropic (probably b/c India and southern China have been increasing the aerosol loading, in addition to the increased loading from forest fires), could it at least partly explained the slower rate of warming in the upper tropical troposphere? Research has shown that areas over and downwind of forest fires associated with deforestation over the Amazon lead to reduced deep, moist convection (i.e., thunderstorms), which means a reduced vertical transport of latent heat into the upper troposphere (see e.g., Altaratz et al. (2010). This work by Rosenfeld et al. (2008) seem to support that. But, this research by Koren et al. (2005) suggests the opposite effect of aerosols on the depth of convective clouds, at least over the N. Atlantic. I would be keen to know whether or not this hypothesis has been considered/explored in the literature than I have touched on here. Personally, I am inclined to think that the "missing" hot pot" is attributable to several factors, none of which refute, or are inconsistent with, the expected warming from higher GHGs. More at NASA's Earth Observatory. -
Thomas1 at 16:02 PM on 27 February 2011Measuring Earth's energy imbalance
There seems to be some confusion over the issue of heat transfer outward versus better insulation though GH gases. 1) Better insulation will reduce the IR emissions at the CURRENT TEMPERATURE. 2) Therefore the temperature will rise INSIDE of the insulating layer until through rising heat transfer though the atmosphere once again a radiative balance is reached where the outgoing energy is equal to the incoming energy, BUT AT A NEW HIGHER TEMPERATURE. 3) The the meanwhile, while the insulation value of our atmosphere so to speak is getting better and better due to rising GH gas concentrations, an imbalance between incoming and outgoing radiation is maintained. 4) This imbalance, or difference between incoming and outgoing radiation is the energy flow into the Earths long term heat stores such as the Oceans and the melt energy of ice etc. 5) In the end we will live in a warmer world which has also stored vast amounts of heat in raised ocean temperatures and molten ice. Thus even if we subsequently open the windows so to speak and lower GH gas concentrations, it will take a long time for all this excess heat to leave us again. The Earth climate is like a gigant pendulum. We have set in motion now at our peril. -
NQuestofApollo at 15:30 PM on 27 February 2011Tree-rings diverge from temperature after 1960
About the only thing anthropogenic about the divergence "problem" are the thermometers. -
Lou Grinzo at 15:14 PM on 27 February 2011Australia's departing Chief Scientist on climate change
This is the first I've heard of Ms. Sackett, but her stepping down certainly sounds like a serious loss for Australia. Hopefully for all of us she will stay engaged with the climate issue in some influential capacity. I'm glad to see her (and Steve) emphasize the committed warming point. I could not agree more strongly with her assessment that this is a misunderstood detail. I'd had numerous conversations, some of them with long-time, committed environmentalists, who have no clue whatsoever that CO2 has this incredibly inconvenient characteristic. When I tell them about it, usually quoting David Archer (The Long Thaw, p. 162) that 40% of the warming from CO2 emissions up to 2100 will only appear after that date, they're horrified. Some argue with me, saying it can't possibly be that bad, some immediately question the value of fighting the emissions fight at all, which turns into a whole other conversation. This is why I so hate our fixation with the year 2100. To lay people it often sounds as if it's a magic finish line -- keep warming below 2C by then and we've dodged the asteroid. When I tell them it's anything but that simple, they are not happy campers. And as for the value of 2C as a guideline or what happens if we "succeed" in cutting way back on sulfate aerosols and thereby unmask another big dollop of warming, I usually don't mention either one; they're depressed enough by then. -
Tom Curtis at 15:03 PM on 27 February 2011Dispelling two myths about the tropospheric hot spot
TimTheToolMan: 1) It is very probable that Haig et al's result is either due to instrument error or to a atypical circumstances. We know this both because ground base observations of visible light show the opposite effect, and because the detected climate response to the solar cycle is opposite in sign to that predicted from Haigh et al's results. 2) However taking Haigh et al's results at face value, they would predice a cooling stratosphere and a warming troposphere when the sun approaches a solar minimum, and the reverse as it approaches a solar maximum. As the cooling stratosphere and warming troposphere have been a feature of our atmosphere for at least 3 solar cycles now, it is unlikely that a forcing tied to that cycle is the cause. To the extent that it is idiosyncratic, it faces the further problem that the decline in stratospheric temperatures has been weakest when it was observed: (Channels ordered in terms of decreasing altitude. Still higher channels show greater trends, but I could not find any graphs of their trends up later than about 2007.)
3) Even ignoring the temporal signature, the Haigh et al hypothesis faces a problem in the spatial signature. Based on the fact that it predicts a peak of ozone at 45 km, and declining ozone and UV below that level, it predicts a cooling lower stratosphere, and a warming or constant temperature mid to upper stratosphere. In fact, the opposite is observed, with very low cooling trends in the lower stratosphere, and a very strong cooling trend in the upper stratosphere.
The low trend in the lower stratosphere is because decline in O3 concentrations results in more UV penetrating to that level, which tends to warm that level, and effect counterbalanced by the cooling effect of increased CO2. In the upper stratosphere, both increased CO2 and decreased O3 have a cooling effect, the reinforcement resulting in the strong cooling trend.
In fact, the observed spatial patern of cooling and warming in the stratosphere, coupled with the observed changes in radiation at different frequencies is only consistent with cooling brought about by increased CO2 levels,and decreased O3 levels. Any other effects must be minor in comparison.
(Channels ordered in terms of decreasing altitude. Still higher channels show greater trends, but I could not find any graphs of their trends up later than about 2007.)
3) Even ignoring the temporal signature, the Haigh et al hypothesis faces a problem in the spatial signature. Based on the fact that it predicts a peak of ozone at 45 km, and declining ozone and UV below that level, it predicts a cooling lower stratosphere, and a warming or constant temperature mid to upper stratosphere. In fact, the opposite is observed, with very low cooling trends in the lower stratosphere, and a very strong cooling trend in the upper stratosphere.
The low trend in the lower stratosphere is because decline in O3 concentrations results in more UV penetrating to that level, which tends to warm that level, and effect counterbalanced by the cooling effect of increased CO2. In the upper stratosphere, both increased CO2 and decreased O3 have a cooling effect, the reinforcement resulting in the strong cooling trend.
In fact, the observed spatial patern of cooling and warming in the stratosphere, coupled with the observed changes in radiation at different frequencies is only consistent with cooling brought about by increased CO2 levels,and decreased O3 levels. Any other effects must be minor in comparison.
 4) Finally, a decreasing aerosol optical thickness will also warm the troposphere, and cool the stratosphere; and due to volcanism or its lack, this can be a natural effect. However, aerosol optical thickness has been observed by satellites to be increasing rather than decreasing over the last decade, in large part due to the industrialization of India and China with limited pollution controls. Increassing optical thickness, of course, warms the stratosphere and cools the troposphere, which may be part of the reason for the reduced trends in both regions since 2000.
-
NQuestofApollo at 14:51 PM on 27 February 2011It's cooling
@139 Why are we looking at a snapshot of the Arctic in 2011 and comparing it to a thirty year range of the Antarctic from 30 years ago to prove that the globe is warming? -
Marcus at 14:31 PM on 27 February 2011Prudent Risk
"since capitalism depends on fossil fuels, and communism is against capitalism, then being against fossil fuels is being a communist" which is an even more illogical claim when you consider that Capitalist societies did *more* to move to renewable energy over the 1970's, 1980's & 1990's than any of the Communist countries did. The reason Russia's environment is now so up the creek is because of their rampant over-use of fossil fuels during the Communist Era. Still, such logic will be lost on the Deniers. -
Tom Curtis at 14:29 PM on 27 February 2011Crux of a Core, Part 1 - addressing J Storrs Hall
Berényi Péter @24, first, it is by no means clear that global temperatures have declined since the Holocene Climactic Optimum. Indermühle et al (2000) " Atmospheric CO2 concentration from 60 to 20 kyr BP from the Taylor Dome ice core, Antarctica" use the CO2 record as a de facto record of global temperatures, possible because of the changing solubility of CO2 with changing sea surface temperatures. Doing so shows an approx 0.5 degree increase in global temperatures since the Holocene Climactic Optimum. This method is not without problems, particularly due to increased CO2 concentrations due to deforestation over that period, however that can be corrected for by comparing rations of C13 to C12. Second, taking Figure 3 above at face value (although it is probably an over estimate of HCO temperatures as previously stated), there was a net decline in mean global temperatures of less than 1 degree C from the HCO to the preindustrial era. This May have occurred despite zero change in globally averaged insolation because of a decline in Northern Hemisphere summer insolation resulting in a cooler arctic, and more ice. The additional ice, of course, results in a higher albedo, and hence lower global temperatures. An equivalent effect occurs in Antarctica in reverse periods, but it is not as strong because at the relevant latitudes, Antarctica has ice sheets rather than sea ice, so there is much less of a change in albedo. -
mike roddy at 14:18 PM on 27 February 2011Australia's departing Chief Scientist on climate change
We really need this woman, and not just you Australians. Let's home Sackett lands where she can do some good- on television, here in the US if it doesn't work out Down Under. -
Rob Honeycutt at 14:03 PM on 27 February 2011Crux of a Core, Part 1 - addressing J Storrs Hall
Pete Dunkelberg @ 21... That is the correct Miller el al 2010. Definitely a long el al list on that one. -
Berényi Péter at 13:57 PM on 27 February 2011Crux of a Core, Part 1 - addressing J Storrs Hall
#17 Daniel Bailey at 12:27 PM on 27 February, 2011 Your comment was deleted due to your contextual usage of the phase "if you actually understand". Those who have a history of pushing the envelope of compliance with the Comments Policy, as you have, will necessarily receive a greater level of comment scrutiny, and less benefit of the doubt, than others do. I see. So I suppose you actually understand why sea surface temperature is decreasing in the tropics during the Holocene (by 1°C or so). Unfortunately I don't. You can check at the NASA GISS Monthly Latitude Insolation page that annual average insolation at TOA (Top of Atmosphere) has been increasing steadily (by 1.2 W/m2) along the equator during the last 10 thousand years (from 416.2 W/m2 to 417.4 W/m2). Perhaps you could explain to all how cooling is caused by increasing irradiation. -
Tom Curtis at 13:32 PM on 27 February 2011Crux of a Core, Part 1 - addressing J Storrs Hall
adelady @18, as an addendum to my 22 based on your comments, the difference between the 2001-2010 average and the 1880-2010 average is 0.5 - 1.0 degrees in the tropical western pacific, and would be greater if the average where a 250 year average. By Tropical Western Pacific I mean the Western Pacific warm pool from which (by memory) Stott et al drew their data. -
Tom Curtis at 13:25 PM on 27 February 2011Crux of a Core, Part 1 - addressing J Storrs Hall
Beryényi Péter, are reproduced @17: 1) The first point to notice is that Stott et al 2004 is one of the plots (dark red) reproduced in Figure 3 of the main article. The full list of data in that figure is here. You will notice that the Western Tropical Pacific only rose above the (global) 2004 temperatures anomally 5,000 years ago, and again 10,000 years ago. At those times, the only Southern Hemisphere data in the above graph (Vostok and Epica) were both significantly below modern temperatures. The net effect is that the average is noticably below 2004 temperatures. That probably overstates the Holocene Climactic Optimum temperatures in that there is a NH bias in the data. The point is, cherry picking two local temperature indices and claiming they represent the global temperature is no more principled than cherry picking one. 2) As per the convention, the "present" in paleoclimate reconstructions is 1950. Stott et al do not mention more recent dates for their data, so the most recent datum on the graph is for 1950. As can be easily verified at GISS, current temperatures in the western Pacific are at least 0.5 degrees warmer than they were in 1950 (comparison of 12 year average centered on 1950.5 with 12 year average ending in 2010). Again, the Western Pacific has only been warmer than this a couple of times, and not during the HCO. The Western Pacific was between 1 and 2 degrees warmer in 2010 than in 1950, making it much warmer than any point on that chart, but issues of resolution mean this may not be an appropriate comparison. Finally, in response to your questions: a) Several examples of cooler locations at those times can be found in Figure 3 above. Indeed, GISP2 (light blue in figure 3) is anticyclical to the Western Pacific data, so that the large peaks in the Western Pacific temperatures coincide with troughs in the Greenland temperatures, so your question is based on a false premise; and b) The anticyclical nature of GISP2 and Western Pacific shows the majority of the variation to be regional in nature, and therefore likely to have primarily regional causes. So, while there may be some connection, you do not show that there is and your question is based on the false assumption of synchrony between GISP2 and Western Pacific temperature peaks. -
Pete Dunkelberg at 13:24 PM on 27 February 2011Crux of a Core, Part 1 - addressing J Storrs Hall
I take it the Miller et al. paper (one really should add the et al., that is the least you can do for all the work that goes into a paper) is this long pdf: Miller et al., "Temperature and precipitation history of the Arctic", Quaternary Science Reviews 29 (2010) 1679--1715. -
boba10960 at 13:24 PM on 27 February 2011Crux of a Core, Part 1 - addressing J Storrs Hall
Hah. Adelady beat me to the point. Also, to reconcile what may appear to be differences in our statements, each bin (average temperature value) has a duration of 250 years (adelady), so the midpoint of the most recent bin is 125 years ago (boba). -
schmoepooh at 13:21 PM on 27 February 2011Australia's departing Chief Scientist on climate change
This is very sad. I would anticipate the denial community will consider using the reduction time lag as an argument for unidentfied variables or non-causal relationships. -
boba10960 at 13:20 PM on 27 February 2011Crux of a Core, Part 1 - addressing J Storrs Hall
BP The figure from Stott is an average temperature estimated using data from three sediment cores in the western equatorial Pacific Ocean. If you download the supplementary data from Nature you will see that the binned (averaged) temperature estimates shown in the figure stop at 125 years ago. Among the three cores there are a total of three individual data points assigned ages of less than 100 years, not very much to say anything about temperatures "today". -
adelady at 13:13 PM on 27 February 2011Crux of a Core, Part 1 - addressing J Storrs Hall
BP / Daniel. I was going to ask whether the "before present" represented the usual 1950 or some other year. So I had a look. "....To estimate the magnitude of the salinity change since the early Holocene we stacked the WTP SW18OC and Mg/Ca records, averaging the data at 250-yr intervals. ... " in the body of the text, and then this as the final sentence. "If so, millennial to centennial scale changes in Holocene ocean thermohaline circulation would be directly affected by ocean–atmosphere processes that have occurred in the tropics." These guys are interested in centennial to millenial periods, so a 250 year average is suitable for at least part of their work. Even if their 'before present' year is more recent than 1950, I cannot see where this work has any more than a tangential relevance to atmospheric warming of the last few decades. This paper seems to be yet another indication that the planet was on a steady, gradual cooling path from the Holocene optimum until excessive GHG release blocked that path. -
Tom Curtis at 12:43 PM on 27 February 2011Climate sensitivity is low
RW1 @143: Science works by verification and observation. In this instance, to verify the Line By Line models, or the Energy Balance models (which give essentially the same results) you would need to verify the physical laws involved, ie, the Beer-Lambert Law, Kirchoff's Law, Planck's Law, Wien's Law and Stefan Boltzmann's Law, not to mention the laws of convective heat transfer in the atmosphere and heat transfer from changes of state of H2O. Having done that, you then need to go through the models line by line to make sure they actually implement the relevant laws appropriately. You also need to have detailed records of the composition and temperature profile of the atmosphere, and confirm that they are correctly entered into the model. You also need to check the emissivity of the various compounds in the atmosphere and make sure they are correctly fed into the model. You have been referred to sources in this discussion where you can do each one of these things, either in little detail (Science of Doom), moderate detail (relevant textbooks) or great detail (relevant scientific papers). You have ignored all of that because, apparently, we cannot find a source that encapsulates all that knowledge into just one sentence. Having done all that, or accepted expert opinion that it was done correctly (which is the sensible approach in that none of the above is in dispute by any practicing scientist including well known skeptics such as Pielke and Spencer), you can then compare the results of the models with observation, as has been done here. In fact, line by line, if given approximately current information on atmospheric composition at each level, models have been shown to be accurate withing less than 1% - again something you have been shown in this thread. With only approximate information, the models are accurate to withing 5% or 0.2 w/m^2 for a doubling of CO2. Again this is not in dispute by any practicing scientist once a few transparent crack pots are excluded. Your problem is not that we are not confirming to how logic or science should work. Your problem is that we are, and for some strange reason, you don't like the answer. -
SoundOff at 12:32 PM on 27 February 2011Australia's departing Chief Scientist on climate change
She “resigned last week smack-bang in the middle of her five-year term”. Perhaps she knows the end is nearer than we think. -
Daniel Bailey at 12:27 PM on 27 February 2011Crux of a Core, Part 1 - addressing J Storrs Hall
Re: Berényi Péter (13) Your comment was deleted due to your contextual usage of the phase "if you actually understand". Those who have a history of pushing the envelope of compliance with the Comments Policy, as you have, will necessarily receive a greater level of comment scrutiny, and less benefit of the doubt, than others do. I reproduce your comment below sans offending phrase: ____________________________________________________________________ Berényi Péter at 08:21 AM on 27 February 2011 "This clearly tells us that oxygen isotope ratios (like the ones used for GISP2) are measuring a local record of temperature for the summit of the Greenland ice sheet, and are not a global proxy" I see. Oxygen isotope and Mg/Ca data from foraminifers retrieved from sediment cores in the western tropical Pacific Ocean are probably not global proxies either. It just shows that not only some pretty cold places got even colder, but one of the warmest spots as well. 2004 Nature, 431, 56-59 DOI: 10.1038/nature02903 Decline of surface temperature and salinity in the western tropical Pacific Ocean in the Holocene epoch Stott, L., Cannariato, K., Thunell, R., Haug, G. H., Koutavas, A., Lund, S. However, if it is cooler today at both places than it used to be several thousand years ago while global average temperature is higher right now, it follows there should be other places on Earth where it was cooler back then. Could you kindly show us several such examples from the literature?
More importantly, if... the gradual cooling in the tropical western Pacific since the Holocene Thermal Maximum (HTM), as it is shown in Fig. 3. Stott 2004 has been driven by changes in the tilt of the planet, please share this knowledge with us.
However, if it is cooler today at both places than it used to be several thousand years ago while global average temperature is higher right now, it follows there should be other places on Earth where it was cooler back then. Could you kindly show us several such examples from the literature?
More importantly, if... the gradual cooling in the tropical western Pacific since the Holocene Thermal Maximum (HTM), as it is shown in Fig. 3. Stott 2004 has been driven by changes in the tilt of the planet, please share this knowledge with us.
-
Rob Honeycutt at 10:33 AM on 27 February 2011Crux of a Core, Part 1 - addressing J Storrs Hall
BP @ 13... Can I suggest that you also take a look at the Byrd station ice core as well? Once again, I think you're trying to pull out one data set that shows what you want to see without doing the full research to see what is going on. It's not a simple answer. Miller 2010 is the paper that addresses the neo-glaciation idea. I suggest that you read that paper. -
TimTheToolMan at 10:29 AM on 27 February 2011Dispelling two myths about the tropospheric hot spot
"Even the author says these results are preliminary -- and small." The author appears to say "In other words, whereas the new satellite measurements call into question computer models of solar output, it does not change the fundamental physics of human-induced global warming." And thats an important result. None of your discussion that you've quoted acknowledges the associated stratospheric cooling and you've all focussed on the surface warming. I'm pointing out that the AGW fingerprint of stratospheric cooling is also effected by this result. I'm not saying AGW is wrong and the sun did it. I'm saying the magnitude of the effect is reduced by this result. The strength of the argument that CO2 is the cause of the observed warming because of stratospheric cooling is lessened because its not the only effect now known to do so. -
michael sweet at 10:19 AM on 27 February 2011Prudent Risk
RSVP, Can you provide evidence that ocean acidification is a local effect only? Perhaps you meant that since I have a fresh water pond in my back yard that when the ocean ecosystems are damaged 30 miles away I will not be affected? -
Tom Curtis at 10:15 AM on 27 February 2011Crux of a Core, Part 1 - addressing J Storrs Hall
Berenyi Peter @13, I would also like to know the answer to that question. The post seemed fine to me, and I was going to comment on it. -
Tom Curtis at 10:10 AM on 27 February 2011Crux of a Core, Part 1 - addressing J Storrs Hall
jg @11, GISP2 data is being abused far more than is made apparent in the above post. Considering Figure 1, one major error is that the end date (marked as the present day) is shown as 2000. In fact, by convention, the "present" is in fact 1950, and is 1950 in the GISP 2 data. What is more, the GISP 2 data actually finishes 95 years before "the present", or in 1855. Further, apart from the obvious fallacy of treating a local climate record with global temperatures, they do so inconsistently in that they use the global record for the last 100 years. If you used the local temperature record throughout, the graph would look like this: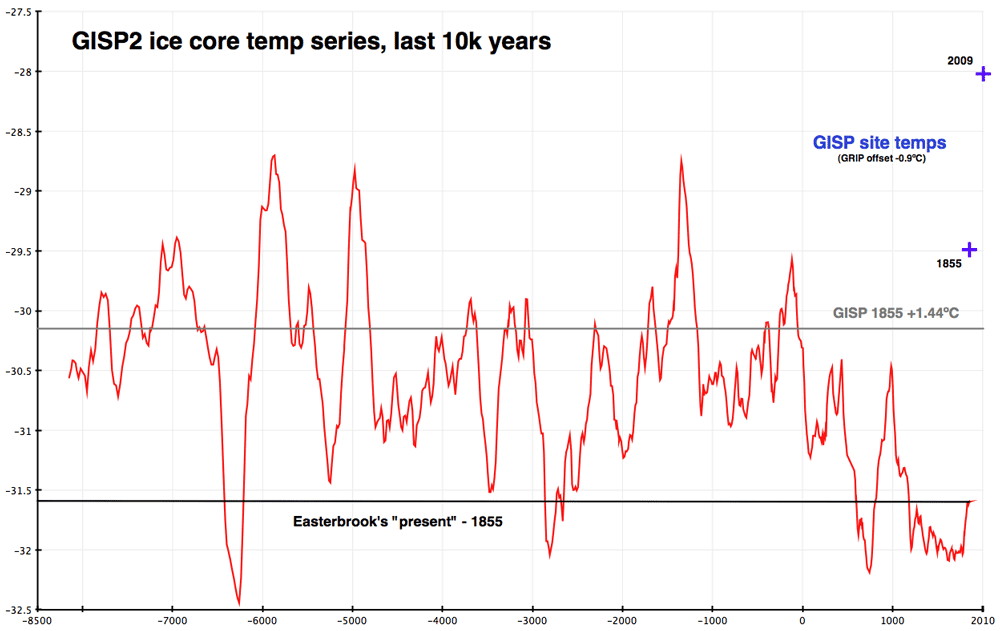 (Note, the two red crosses mark recent ice care temperature proxies - ending in 2009 - at the nearby GRIP drill site. The grey line marks the temperature of a similar increase in temperature from 1855 to the present at GISP2.)
-
From Peru at 10:10 AM on 27 February 2011Prudent Risk
"The "skeptics" would have us continue driving the car in the blind hope that the brakes will never give out" It is actually worse than that, the climate system has no brakes (once the planet has warmed, the change is IRREVERSIBLE). All the best we can do is leave the accelerator, hoping that the speed already reached isn't enough to crush ourselves in the giant concrete wall ahead. But this "skeptics" want us to continue to accelerate towards the concrete wall, saying that: "there is not evidence that hitting a concrete wall is dangerous" and claiming that all the physisists, engineers, doctors, firemen and all the people that shout: "stop!" are dishonest people with a hidden agenda, an agenda that includes a range astonishingly large of possibilities, from financial speculation (with carbon credits) to communism (the "logic" is like: since capitalism depends on fossil fuels, and communism is against capitalism, then being against fossil fuels is being a communist) The nonsense of the "skeptics" is so big, that it reminds me the words of Albert Einstein: "There are two infinite things, the Universe and Human Stupidity, and I am not sure of the former" -
Climate sensitivity is low
RW1 - You've repeatedly, and by multiple people, been told what the data is, and continue to argue for your (mis)perception of it. We've told you what the results are - denying the data is the unscientific approach here. Something to think about, RW1 - which is more likely? That everyone's interpretation of LBL analysis of CO2 forcing is somehow blatantly wrong? Or that George White (not published AFAIK, certainly not in climatology) is misinterpreting the results of the model he's run? I'm not asking for an answer from you, but just for you to consider the question. I'm out of this thread until real questions are discussed again. -
Berényi Péter at 09:32 AM on 27 February 2011Crux of a Core, Part 1 - addressing J Storrs Hall
Daniel Bailey, would you explain how Comments Policy was violated by this post? I suppose you thought it was, because you have deleted it. -
TimTheToolMan at 09:21 AM on 27 February 2011Dispelling two myths about the tropospheric hot spot
"The Haigh 2010 paper was discussed in The sun upside down" OK, you have a discussion of the paper but dont relate the result to the possible impacts on the Stratospheric cooling at all. Hence my inability to find it in the context of "Stratospheric cooling" So why does your article indicate that stratospheric cooling cant in part be due to the sun's changes? -
RW1 at 09:07 AM on 27 February 2011Climate sensitivity is low
KR, As stated before, you're just repeating and declaring conclusions I'm already aware of. This is not how science, logic and reasoning works. -
Climate sensitivity is low
RW1 - The 3.7 W/m^2 energy imbalance from doubling CO2 is kept in the Earth climate system, atmosphere and surface. This is the sum result of multiple absorption/emission events distributed throughout the atmosphere, as we've told you, and as (it appears) Gavin Schmidt has repeated. Each of those individually is isotropic, with nearly equal (due to horizon effects) probability of upwards or downwards. The sum radiation change upon doubling CO2 is that a global mean of 3.7 W/m^2 less energy leaves the top of the atmosphere. Shopping around for a different answer won't change that... -
TimTheToolMan at 08:53 AM on 27 February 2011Dispelling two myths about the tropospheric hot spot
I'm not actually sure you understand the argument Dan. This is a relatively new paper (Oct 2010) and looks at the spectral components of the TSI. I did a search for "Stratospheric cooling" and came up with the usual references to TSI increases resulting in a different warming profile to CO2 warming. For example "8.If the warming is due to solar activity, then the upper atmosphere (the stratosphere) should warm along with the rest of the atmosphere. But if the warming is due to the greenhouse effect, the stratosphere should cool because of the heat being trapped in the lower atmosphere (the troposphere). Satellite measurements show that the stratosphere is cooling." But this is an incorrect statement on TSI changes and assumes that all spectra change together. It turns out that this is not correct and so the observed changes since the satellite was put up there indicate a change that ought to mimick the CO2 profile. I'm happy to hear any arguments you have against this, but pointing to "its not the sun" links are irrelevent.Moderator Response: [muoncounter] The Haigh 2010 paper was discussed in The sun upside down and on It's the sun. Search function finds prior threads. Jedi Master DB was right (again). -
RW1 at 08:41 AM on 27 February 2011Climate sensitivity is low
Another question: Do we all agree that not all of the absorbed infrared affects the surface? That a portion of it is directed up out to space and the remaining portion of it is directed down to the surface? -
RickG at 08:38 AM on 27 February 2011Climate sensitivity is low
@138 How easy is it to get fooled? -
Daniel Bailey at 08:36 AM on 27 February 2011Climate sensitivity is low
Here it is: "RW says: 24 Feb 2011 at 8:50 PM Interesting thread. I have a question about some frequently referenced data: I’m wondering if someone can shed some light on this subject for me. I’ve searched around at length all over and cannot find a clear answer. The 3.7 W/m^2 estimated from simulations for the increase in ‘radiative forcing’ from a doubling of atmospheric CO2 – does the 3.7 W/m^2 represent a reduction in the atmospheric window or does it represent the half directed down due to isotropic re-radiation/redistribution (meaning a reduction in the atmospheric window of 7.4 W/m^2)???" [Response: It is the global mean change in outgoing LW flux at the tropopause (integrated over the whole spectrum) for a doubling of CO2. - gavin] [ -Edit: More ensuing discussion follows- ] The Yooper -
Tom Curtis at 08:31 AM on 27 February 2011Climate sensitivity is low
scaddenp @137, out of a morbid curiousity, what thread? -
scaddenp at 07:39 AM on 27 February 2011Climate sensitivity is low
Guys, noticed RW asked at Realclimate: "’m wondering if someone can shed some light on this subject for me. I’ve searched around at length all over and cannot find a clear answer. The 3.7 W/m^2 estimated from simulations for the increase in ‘radiative forcing’ from a doubling of atmospheric CO2 – does the 3.7 W/m^2 represent a reduction in the atmospheric window or does it represent the half directed down due to isotropic re-radiation/redistribution (meaning a reduction in the atmospheric window of 7.4 W/m^2)???" Clearly absolutely nothing we have said has been understood at all. I doubt he will like Gavin's accurate response either. -
Climate sensitivity is low
RW1 - "I'm not getting any 'proof' here of anything, so I'm left to figure it out on my own." Actually, I will have to disagree with you. You've been pointed to the documentation, you have statements from several people who are quite familiar with line-by-line atmospheric calculations, and even George White sees a ~3.6 W/m^2 imbalance with his own runs of the HITRAN code. Unfortunately, as muoncounter pointed out, these efforts are met with disbelief, rejection, and (yes) denial - "I'm going to get to bottom of this. I'll be back when I know and can show the proof". I have the impression from this conversation that you will reject anything that does not conform to your preconceptions, and that is very sad. 3.7 or so W/m^2 is the difference in total planetary emissions upon doubling CO2, the amount of extra IR not leaving at a particular temperature, the change in outward directed energy. Please - we've offered this information honestly and clearly, as the best established data available. I would suggest you consider your own reasons for not believing it, and why you are so insistent that we are wrong. -
Rob Painting at 06:35 AM on 27 February 2011Dispelling two myths about the tropospheric hot spot
Dan, how did you know?.Moderator Response: [Daniel Bailey] Just a feeling.
Prev 1873 1874 1875 1876 1877 1878 1879 1880 1881 1882 1883 1884 1885 1886 1887 1888 Next


