


 Arguments


Recent Comments
Prev 1883 1884 1885 1886 1887 1888 1889 1890 1891 1892 1893 1894 1895 1896 1897 1898 Next
Comments 94501 to 94550:
-
2nd law of thermodynamics contradicts greenhouse theory
damorbel - For temperatures in the second model, add a second "named range" of "Surface_E", value of ~0.97 (a better surface estimate, once I looked it up), and another column starting at E5 containing: =SQRT(SQRT(B5/(Surface_E*5.6704*10^-8)))-273.15-4 Copy this cell and paste down the column. This reverses the Stefan-Boltzmann equation to get degrees Centigrade, with a "4" fudge factor (sets the ~18C final result back to ~14C, accounting at least in part for the surface variations and T^4 increase in radiated power). Not perfect, but a reasonable back of the envelope correction. Given this model and that a doubling of CO2 should result in an imbalance of 3.7 W/m^2, the effective decrease in emissivity of 0.606 * 236.3/240 =.597, which fed into the model results in a temperature rise of ~1.1C, just about what everyone expects from a CO2 doubling with no feedbacks. -
David Horton at 09:22 AM on 24 February 2011Carbon Cycle Feedbacks
We know that carbon uptake by plants could't happen fast enough in the past to prevent severe climate change, why on earth would you think it could happen now with the greatly reduced, fragmented, damaged forest remnants we have; with the further damage to those forests being caused by the changing climate; and with the continuing short-sighted effects of logging, clearing, wood-chipping, recreational use, prescribed burning. It is also worth noting that it takes hundreds of years for a forest to mature, ie to have taken up the maximum that can be absorbed by vegetation in that area given the parameters of topography, soil, moisture, nutrients and so on. We don't have hundreds of years. -
HumanityRules at 09:19 AM on 24 February 2011Hockey Stick Own Goal
99 dhogaza OK I look forward to seeing the Mann 98 bring dropped by the IPCC. -
dhogaza at 09:07 AM on 24 February 2011Hockey Stick Own Goal
HR:if I talk about early Mann reconstructions I'm stuck in the past, If IPCC 2007 refers to early Mann reconstructions it's......
Because it was written in 2007, therefore didn't have Mann '08 and other recent papers available for inclusion.Ah yes I see your logic now.
Apparently yours is that IPCC 2007 should've trotted out their secret time machine and fast forwarded until after those more recent papers were published, and included them? What do you think AR5 will include? Here's my guess ... those papers that came out 2007-2010. You're stuck in the past because you're posting in 2011, not 2007, when AR4 was published. -
scaddenp at 08:58 AM on 24 February 2011Hockey Stick Own Goal
Sorry Fig 6.13 of AR4, WG1. -
2nd law of thermodynamics contradicts greenhouse theory
damorbel - When I worked up the two spreadsheets, I transcribed the content as individual cells with values surrounded by quotes. I've had little (read that, 'no') success in copy/pasting entire spreadsheets as text - hence the approximate formatting. Sorry about the difficulties; if it doesn't work blame my typing! For the first spreadsheet the initial setup is a set of 4 columns, 3 rows, with the items in quotes in each cell in order (don't type in the quotes!). Then copy the last line (4 columns) and paste it into the next 20-30 to converge. Here radiation to space is what's left over when the atmosphere returns some to the surface, and it converges when outgoing=incoming. For the second spreadsheet, the emissivity driven model, there's a single line with a "named range" of "Emissivity" (getting a bit tricker), initial value 0.6. Two rows down there's a section 4 columns across, 3 rows high, with items in quotes in individual cells (don't put in the quotes!). Copy those last 4 cells and paste into the next 20-30 lines for convergence. Try different planetary emissivities to see how the surface energy changes. Here "Emitted" is what's sent to space, and it again converges when outgoing=incoming. These are radiation only models, lacking (in the first example) any convection/evaporation, in order to make the point. In the first, I'm just looking at radiative energies - 240 W/m^2 from the sun, and in convergence 240 W/m^2 to space as IR. Since it's such a simple model temps are not going to be accurate, but it clearly shows that in the presence of an absorbing/spherically emitting atmosphere the surface will be radiating more than the input energy in order to put the total input energy out to space. The primary take-home from the first model is that surface radiated energy goes up in the presence of a GHG containing atmosphere, and that only happens if the temperature goes up. In the second model we can look at temperatures related to those energies; it's a simpler yet more accurate model looking at only the radiative elements. 240 W/m^2 is indeed the incoming solar power. 0.6 is close to the Earth emissivity (zero dimensional model). 396 W/m^2 is the energy radiated from the Earth's surface (surface temp of 14°C which should radiate ~390 given an emissivity of .91-.95, but surface variations and the T^4 relationship raise that to 396). This really simple model quite accurately captures surface emissions and hence surface temperature. I was actually quite surprised at how closely this agrees with the data. In either case - re-emission back to Earth, which shows as reduced emissivity of the planet to space, results in driving the surface to emit more energy to get the incoming 240W/m^2 back out to space, and hence conserving energy. -
scaddenp at 08:58 AM on 24 February 2011Hockey Stick Own Goal
"Besides, no computer model can replicate MWP". I've seen this claim a lot. Seems at complete variance with Fig 6.13 which has output from 12 models. Or is this problems replicating an imaginary MWP? -
John Hartz at 08:55 AM on 24 February 2011Greenland is gaining ice
There's a new peer-reviewed paper on this topic: "The role of albedo and accumulation in the 2010 melting record in Greenland" by M Tedesco, et al, Environmetal Research Letters #6 (January-March 2011) This paper can be accessed for free at: http://iopscience.iop.org/1748-9326/6/1/014005/fulltextModerator Response: [muoncounter] See also the discussion on the Flanner thread. -
RickG at 08:55 AM on 24 February 2011Models are unreliable
Chemist1, Concerning your first link please note that it is a news article in Nature, not a peer reviewed study. Secondly, the error about the Himalayan glaciers in the IPCC report has long since corrected "by the IPCC". However, the Himalayan glaciers are receding, just not as fast as initially reported. There are many discussions concerning the Himalayan glaciers on this site. Please review Return to the Himalayas. -
Chemist1 at 08:32 AM on 24 February 2011Models are unreliable
Dikran the range of uncertainty is so wide that it makes long term projections or predictions unreliable. Short term projections are so-so, but not great, and some models are almost completely unreliable, which I will get into at a later date. -
Chemist1 at 08:29 AM on 24 February 2011Models are unreliable
Okay so here is my edited, kick off on why the models are unreliable, and the IPCC report's over reliance upon them, from peer reviewed papers is a very poor decision. First link:http://www.nature.com/climate/2010/1003/full/climate.2010.19.html First Quote: Initial studies of how the rivers will respond to ice loss show modest changes in stream flow — far from the IPCC report's dire scenario of rivers running dry. Even if the glaciers were lost completely, flows down the Indus would drop about 15 per cent overall, with little or no change in the dry-season flow, one recent study found9. Lall cautions, however, that climate models are poor at simulating rain and snowfall, especially for the Asian monsoons. “I wouldn't hold these models to be very accurate,” he says. In the absence of clear predictions of what's to come, close monitoring of changes in the mountains is all the more important, as rising temperatures will probably affect the whole water cycle, says Eriksson of ICIMOD. “There has been too much focus on the glaciers as such,” he says. “It's urgent to understand the whole [impact] of climate change on snow, ice and rainfall, and that is not happening.” Second Quote back a few sentences prior to the above quote: Cogley. Upmanu Lall, director of the Columbia Water Center at Columbia University in New York, agrees. Lall says the idea that the rivers could run dry because of shrinking glaciers seems to stem from a confusion about how much glaciers contribute to river flows, compared with the contribution from melting of the seasonal snowpack." Link 2, I am introducing because it because you can download it and and place it into GOOGLE Earth and look at data and so called trends yourselves as individuals. It also illustrates how short any decent temperature record keeping has been around and how few stations there have been. The download is free. http://www.climateapplications.com/kmlfiles.asp The above link can assist everyone in analysisModerator Response: [Daniel Bailey] Please note: You are responsible for the content of your copy/pasting from other sites when you then post it here. Your comment previously appearing as number 297 contained multiple allegations of impropriety. Repeated violations of the Comments Policy will also be deleted and could subject you to further, more rigorous moderation. Be aware. -
Follow-Up Case Study in Skepticism
thepoodlebites - You're quite welcome, glad to add my tiny bit of pocket change to a reasonable discussion. To be honest, I don't have enough information about ACRIM vs. PMOD vs. Frohlich to definitively say which measure is most appropriate; just that all of them seem to indicate low levels of solar variation that don't line up with temperature changes. And yes, Steig vs. O'Donnell looks to be quite the mess. I think it points out that the reviewed should not be able to identify and yell directly at the reviewers, and that researchers disagreeing with each other should likely not be reviewing each others work. Most unfortunate. -
Dikran Marsupial at 08:23 AM on 24 February 2011Models are unreliable
Chemist1@300 Uncertainty is not the same thing as unreliability. Unreliability implies that the models have errors that lie outside the stated uncertainty of the projections. GEP Box said "all models are wrong, but some are useful". You have not established that the models are unreliable, nor have you demonstrated that the stated uncertainty of the projections is so high that they are not useful. It is well known that GCMs don't work well at smaller spatial scales, but that doesn't mean they are not accurate in projections of global climate variables.Moderator Response: (Daniel Bailey) FYI: Chemist1's long link-fest originally at 297 contained an extensive copy-paste with multiple allegations of impropriety; it and 3 subsequent responses were then deleted. That is why the numbering sequence on comments is off right now. -
Albatross at 08:23 AM on 24 February 2011Hockey Stick Own Goal
muoncounter @94, "'unforced free oscillations' idea -- call it UFOs" Thanks for making me laugh...that is hilarious. -
Chemist1 at 08:17 AM on 24 February 2011Models are unreliable
Here are a few more links straight from peer review regarding strenghts, weaknesses and areas where serious need of improvement, exist: http://iopscience.iop.org/1748-9326/6/1/014008: " Abstract This study assesses the accuracy of state-of-the-art regional climate models for agriculture applications in West Africa. A set of nine regional configurations with eight regional models from the ENSEMBLES project is evaluated. Although they are all based on similar large-scale conditions, the performances of regional models in reproducing the most crucial variables for crop production are extremely variable. This therefore leads to a large dispersion in crop yield prediction when using regional models in a climate/crop modelling system. This dispersion comes from the different physics in each regional model and also the choice of parametrizations for a single regional model. Indeed, two configurations of the same regional model are sometimes more distinct than two different regional models. Promising results are obtained when applying a bias correction technique to climate model outputs. Simulated yields with bias corrected climate variables show much more realistic means and standard deviations. However, such a bias correction technique is not able to improve the reproduction of the year-to-year variations of simulated yields. This study confirms the importance of the multi-model approach for quantifying uncertainties for impact studies and also stresses the benefits of combining both regional and statistical downscaling techniques. Finally, it indicates the urgent need to address the main uncertainties in atmospheric processes controlling the monsoon system and to contribute to the evaluation and improvement of climate and weather forecasting models in that respect." http://onlinelibrary.wiley.com/doi/10.1002/wcc.60/full: "Abstract Computer models are powerful tools that allow us to analyze problems in unprecedented detail and to conduct experiments impossible with the real system. Reliance on computer models in science and policy decisions has been challenged by philosophers of science on methodological and epistemological grounds. This challenge is examined for the case of climate models by reviewing what they are and what climate scientists do with them, followed by an analysis of how they can be used to construct new trustworthy knowledge. A climate model is an executable computer code that solves a set of mathematical equations assumed to represent the climate system. Climate modelers use these models to simulate present and past climates and forecast likely and plausible future evolutions. Model uncertainties and model calibration are identified as the two major concerns. Climate models of different complexity address different question. Their interplay helps to weed out model errors, identify robust features, understand the climate system, and build confidence in the models, but is no guard against flaws in the underlying physics. Copyright © 2010 John Wiley & Sons, Ltd." These two last links with Abstracts included are not skeptical arguments against using GCM's or climate change. Yet they highlight regional issues, weather events, patterns,microclimate, and making projections based upon these and finding trends in climate. Not that these papers conclude nothing can be understood better or analyzed but that models still contain lots of unreliability, which is the topic of this thread. -
damorbel at 08:15 AM on 24 February 20112nd law of thermodynamics contradicts greenhouse theory
Re 344 KR You very kindly provided an excel sheet for doing calculations showing energy tranferred by radiation without any indication of the relative temperatures between the heat source and the heat sink. Now it is a fundamental of physics that, without knowing these temperatures, you cannot make any energy transfer calculations or predict any temperature changes. You claim that I do not understand your arguments, do you understand my need to know what the various temperatures are involved in you 'warming' model? PS Your EXCEL explanation will not load in my MS EXCEL, Would you be so kind as to provide a clearer version; perhaps just the cell identities and the cell entries? Thanking you in advance. -
dana1981 at 08:11 AM on 24 February 2011Hockey Stick Own Goal
protestant - I'm not saying I'm certain the divergence is due to the lack of proxy data. I'm saying your certainty that the divergence illustrates a problem with the proxies is misplaced and unwise. Moreover, once again you are scoring an own goal. If you are correct, and the proxies underestimate large temperature swings, then the prior temperature changes were larger than we think, which means climate sensitivity is higher than we think. But if you examine the figure I provided, you can see that the instrumental record and Ljungqvist proxy data match up quite well until about 1980, which constitutes about 85% of the instrumental record, only diverging at the end when there is little proxy coverage. The logical conclusion is that the divergence is due to a lack of proxy data. -
2nd law of thermodynamics contradicts greenhouse theory
damorbel Here's another Excel exercise. "Row 1: "Emissivity" "0.6" Right click the 0.6 and "Name a range" to "Emissivity" Row 3: "Sun" "Earth" "Emitted" "Difference" Row 4: "240" "=A4" "=B4*Emissivity" "=A4-C4" Row 5: "=A4" "=B4+D4" "=B4*Emissivity" "=A5-C5" Copy Row 5 and paste it into the next 20-30 rows. As the Earth emissivity goes down relative to a theoretic black-body, due to the widening/deepening GHG bands in the spectra of the total planetary emission, surface radiation must go up due to the difference (energy conservation) between incoming and outgoing radiation. I find an emissivity of 0.606 and input of 240 gives a surface radiation of 396, emission to space of (again) 240 on convergence. Interestingly enough, this is just about what the planetary emissivity has been calculated to be... -
muoncounter at 08:07 AM on 24 February 2011Hockey Stick Own Goal
"Models do not reproduce the behavior in temperature series (1940's)." No, they sure don't: IPCC AR4 WG1 Figure 9-5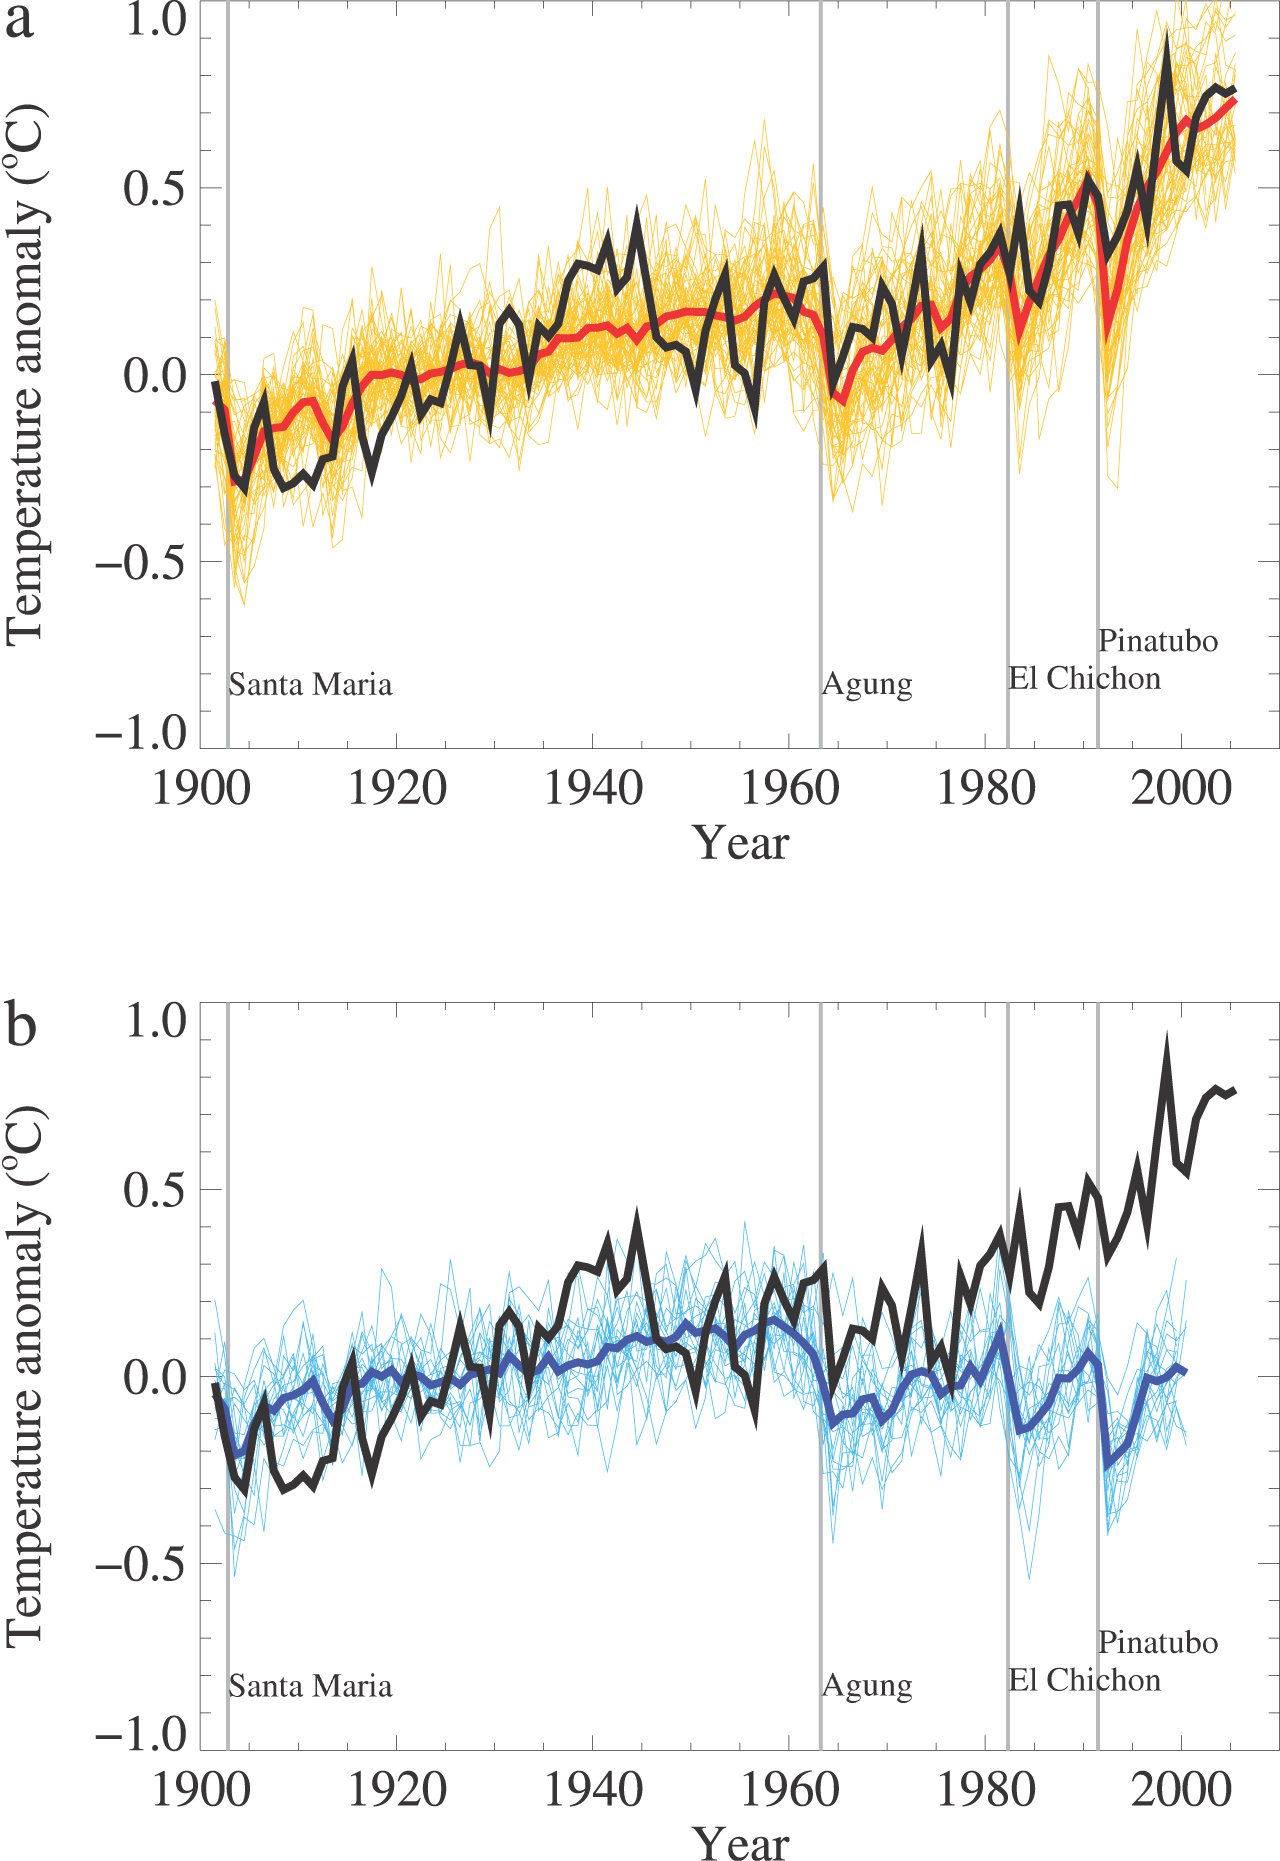 See Models are unreliable.
Or just chuck all climate models and basic physics out and go with the 'unforced free oscillations' idea -- call it UFOs!
See Models are unreliable.
Or just chuck all climate models and basic physics out and go with the 'unforced free oscillations' idea -- call it UFOs!
-
Albatross at 08:05 AM on 24 February 2011Hockey Stick Own Goal
protestant, You seem to be arguing in circles and using excuses to try and discredit whichever information is inconvenient to you. You have questioned the validity of the temperature data from the instrument record, then questioning the splicing, then introducing the red herring of transient oscillations, now you seem to be arguing that the paleo reconstructions are questionable (including Ljungqvist it seems). Well, Idso et al. sure are placing a lot of emphasis and weight on Ljungqvist (2010) and excluded the spliced temperature data from the instrumented record that ljungqvist (2010) included in his paper. All data have issues, that does not render them useless. You have been shown to be wrong about a few things on this thread, yet you insist on trying to obfuscate and detract from the own goal scored by Idso et al. PS: If you wish to challenge Tamino's work, then please do so at Tamino's site. -
thepoodlebites at 08:04 AM on 24 February 2011Follow-Up Case Study in Skepticism
# 80 Thanks KR, I found the ACRIM vs PMOD link after I posted #79. Actually, the paper I wanted to cite for PMOD TSI reconstuction is Frohlich, the observed trend since 1978 is not significantly different from zero. Shouldn't Figure 1 here be replaced by Fig. 1 in the Frohlich paper? Thanks for the lively debate on climate trends. I'm reading about the Steig vs O'Donnell controversy with the 2009 Antarctic temperature reconstruction. Apparently, PCA can be tricky with sparce data fields. I searched but couldn't find a thread on this topic. I'm sorry to read that the matter became overly personal. -
RickG at 08:02 AM on 24 February 2011Prudent Path Week
Over the past several days I have participated in discussions over several threads as many of us have. I have seen many very well thought out and well presented arguments with the best intentions of helping all to understand the many aspects of climate science. Conversely, I have observed many posts that seem to ignore the most basic principles of physics as well as the many requests to look at data and citations presented to them. Many contrarian arguments have been thoroughly debunked by addressing specific questions and providing scientifically supporting evidence only to have the originator of the argument to return and say their question was not addressed. I know many posters here as well as I have become somewhat frustrated with the experience. For the past 24 hours I have only observed posts from the "Recent Comments" page and begin to look at this from a whole new prospective. No doubt it was difficult for me not to respond to some of the posts, but I begin to realize something very important. Anyone coming to this site seeking information and understanding with an open mind can easily see what is happening in the climate debate. One side presents only science with supporting evidence and references from the scientific community. The other side continously ignores the information being presented and even refuses to read any of the many articles presented on this site already addressing their questions. Any open minded person visiting this site whether they post or not can easily see this and separate the wheat from the chaff. In my opinion, I think the contrarians are their own worst enemy, if by nothing else, the tone presented in their own posts. As someone said in the "Meet The Denominator" thread, "you are the gift that keeps on giving". Understand my above comments apply only to those posters who have no intention of engaging in meaningful debate and not the true skeptics who wish to discuss and exchange ideas. Thank you John, Moderators and everyone connected with SkS for following the "proper path", rather than the "prudent path", with such a high quality site for us all to learn and enjoy.Moderator Response: [Daniel Bailey] On behalf of John and the other moderators and the large community of regular posters & commentators (not to mention the lay readership at large) here: Thank you. You are a breath of fresh air & have succinctly summed up the nature and flavor of the debate going on here. -
muoncounter at 07:49 AM on 24 February 2011Hurricanes aren't linked to global warming
citizenschallenge, I think the problem may be that ACE blends wind speed and storm duration, as seen here in Bell et al 2000: ... accumulating Vmax^2 for all 6-hourly periods in which the system is either a tropical storm or hurricane, thereby also accounting for the number and duration of storms while at a tropical storm status. This modified HDP index is referred to as accumulated cyclone energy (ACE) index, and is both a physically and statistically reasonable measure of overall activity during a given hurricane season. This was a modification of 'hurricane destructive potential (HDP),' which was originated by William Gray in 1987. As a wind speed-duration index, ACE neglects rainfall. As we associate increasing sea surface temperature with more intense precipitation events, it is not unreasonable that ACE appears to have little or no trend. For example, Fran (1996, cat 3) has a higher ACE (26) than Katrina (2005, cat 5, ACE 20). Though lower in windspeed, Fran became a TS while well out in the Atlantic and thus had a much longer track. (wikipedia has detailed storm season histories; ACE data are tabulated here). Without including rainfall, ACE has the potential to misstate the energy redistribution taking place during a hurricane by a large amount: The rate of energy release for each mm/hour of rainfall is three times as great as the solar energy (~350 Watts/m2) that falls on the same surface area. Thus the precipitation process concentrates heat that was used to evaporate moisture from large expanses of the tropics by factors of ten to a hundred into those regions where rain occurs. While solar heating of the atmosphere takes place mainly at the surface, the heat released by condensation occurs at high altitudes where it has a greater impact on the atmosphere's large scale circulation. Averaged over the entire Earth the heating released by precipitation is about five times greater than that produced by variations in surface heating. -
protestant at 07:48 AM on 24 February 2011Hockey Stick Own Goal
And how do you confirm its due to lack of proxies? It is just an interpretation. Though it might be partly an explanation, but what is also clear from the earlier reconstructions is that the proxies do not follow measured temperatures so closely no matter how you train them. Therefore they are not as accurate as thermometers, no matter how you bake it. And there is a reason why Ljungqvist suggested extreme caution with thermometer interpretations, isn't there? Can you disagree with this? -
JMurphy at 07:45 AM on 24 February 2011Smoking, cancer and global warming
Chemist1, it's no use posting results of searches which will lead to biased work subsidised and backed by big government and the Pharma industry - haven't you learnt the ways of those who are underpinning the AGW 'scam' ? I want 100% evidence giving physical facts that prove that a smoker will die of lung cancer. -
JMurphy at 07:41 AM on 24 February 2011Smoking, cancer and global warming
rhjames, don't tell me you believe all those elitist scientists and their dodgy/fraudulent/wrong/biased/etc data ? And you believe that it is a consensus ? Well, you know how wrong any consensus can be, don't you ? Anyway, here are more 'facts' from a 'proper' scientist working tirelessly to expose the truth like a modern-day Galileo : It's Official - Smoking Doesn't Cause Lung Cancer... As to your belief about climate sensitivity, perhaps you had better read this thread (How sensitive is our climate? - there are also Basic and Intermediate versions available) and post there to show which "known science" leads you to trust a figure of "a 1 degC increase". -
Chemist1 at 07:40 AM on 24 February 2011Smoking, cancer and global warming
http://scholar.google.com/scholar?q=Smoking+cigarettes+kills&hl=en&as_sdt=1%2C33&as_sdtp=on Here. Now I know arguments from statistical uncertainty and probability may be invoked but the sample sizes, the replicability in actual individuals and groups of people,e the random assignment, the years of robust research and qualitative analysis provide the actual proof and not just 'evidence.' Newer published data: http://scholar.google.com/scholar?hl=en&q=Smoking+cigarettes+kills&as_sdt=0%2C33&as_ylo=2010&as_vis=0 -
Chemist1 at 07:38 AM on 24 February 2011Smoking, cancer and global warming
11 rhjames absolutely correct. Just to add a little: Many of the chemicals in cigarette smoke individually have support from numerous studies providing a some causal links between repeated exposure and cancer incidence and prevalence as well. In addition, global warming itself is not falsifiable, while other empirical studies are. 1 degree means nothing. -
dana1981 at 07:22 AM on 24 February 2011Hockey Stick Own Goal
protestant, I think this is the fourth time I'm saying this now. Ljungqvist only has 10 proxies extending to 1999. Assuming that the divergence toward the end of the 20th century between actual temps vs. proxy temps is due to a problem with the proxies rather than a lack of proxies is unwise. -
rhjames at 07:12 AM on 24 February 2011Smoking, cancer and global warming
JMurphy - this is a foolish comment you quoted. There is statistical conclusion at extremely high probability level that smoking kills people. The factors of stress, diet etc have all been accounted for in the studies. If someone smokes, we don't know they will die of lung cancer, but they have a significantly increased possibility of death by lung cancer. Take, 10,000 smokers, and some will die of lung cancer. To compare this with the likelihood of doubling CO2 will cause a 3 degC temperature increase is not valid. There is no data to back this up - only computer models and theory which are still based on very limited understanding of many contributing factors. If someone says that doubling CO@ might result in a 1 degC increase, then I'll accept that as consistent with known science. Anything beyond that is just guess work at this stage. -
protestant at 06:58 AM on 24 February 2011Hockey Stick Own Goal
Sigh,it seems I am not getting out of here. Robert, what has Steig vs O'donnell have to do with this? I am completely not interested in any rant written by DC nor Romm (nor Climateaudit). But what concernes is that Steig was Reviewer A and which is a disgrace. Don't you agree one shouldnt be a reviewer when your own work is critisized? I havent looked on the math by either side so I do not know which paper is right, but I tend to believe O'donnell is. But I am not willing to dig this any further since other details are more interesting, and besides, I have a day job. And if DC has anything against M&W then I wish him best luck in publishing it. As I said before I am not at the moment interested on discussing about the paper as a whole, but about the statement I cited. But I definitely need to point you out, that if you are reading blogs on a highly polarized issue, you *must* be reading and considering the points on both sides. I am sure you are doing it, but many people commenting these blogs are certainly not, thus biasing their opinions towards the 'side' they picked in the start. And btw, thanks for the decadal data you have calculated. The differences on our calculations seems to be because I have whole NH data, where you have just extratropical. I trust you and am not willing to spend any time checking the results. But I still dont see how that should be compared on data, which is necessarily smoother and doesn't respond to temperatures as good as thermometers. You must take into account, that if the proxies do not respond to temperatures as good *now*, why would they do it 500, 1000, 1500 nor 2000 years ago? -
robert way at 06:43 AM on 24 February 2011Hockey Stick Own Goal
Okay Protestant, actual data here Decade LJ2010 Hadcrut 30-90N 1880–1889 -0.337 -0.242 1890–1899 -0.25 -0.223 1900–1909 -0.293 -0.313 1910–1919 -0.296 -0.31 1920–1929 -0.171 -0.087 1930–1939 0.004 0.132 1940–1949 0.019 0.11 1950–1959 0.037 0.063 1960–1969 0.015 0.023 1970–1979 -0.074 -0.028 1980–1989 0.082 0.149 1990–1999 0.056 0.459 2000-2009 0.789 There were no "predictive techniques" used. [edit made by Dikran Marsupial] Regarding MW10, You do realize that they had multiple comments and responses to their paper showing flaws throughout correct? I'm just curious whether you took the time to realize that they implemented things wrong quite a bit. Including using local proxies to try and correlate with hemispheric temperatures rather than correlating to local temps and averaging to make a hemispheric average. Many more examples of errors are found here: http://deepclimate.org/2010/08/19/mcshane-and-wyner-2010/ [edit made by Dikran Marsupial]Moderator Response: As requested I have made edits to this post rather than deleting it; however this is an unnecessary imposition on the moderators, further transgressions will be deteled. -
protestant at 06:43 AM on 24 February 2011Hockey Stick Own Goal
#80. All I can say that you didn't understand what I am talking about. For example, Taimno's excersice on the recent 30 year trend *is* a period where also AMO is increasing (DelSole), and contributing this circa 0.08K/decade. Therefore he should have removed it. Tamino didn't demonstrate that AMO would alias effect global warming. Nope, njet, nada. If you had read Bob Tisdale's post (I see again the man was attacked by the commentators, not his arguments), Kaplan SST has a smaller trend in North Atlantic than Oi.v2 Reynolds or HadISST. Therefore he biased his result choosing Kaplan and removing GISS (with land data included, how dubious is that). His demonstration was highly erroneus. I never made such a claim that AMO would explain all of the observed warming, but there might be some indication that there is cycles like AMO on even centennial time scales (the variability on the late holocene, no forcing can explain it!) Ok, now I will disappear, for real. -
Albatross at 06:36 AM on 24 February 2011Hockey Stick Own Goal
protestant, The fact remains that this comment made in the "Prudent path" misinformation document is not supported by the data and is demonstrably false: "it was just as warm as, or even warmer than, it has been recently during both the Roman and Medieval Warm Periods" That statement of course does not suggest anything about how much more warming we will very likely experience in the coming decades-- it is thus also a red herring. Also, the fact remains that the overwhelming evidence points to a climate sensitivity near +3 K for doubling CO2 and taking into account feedbacks. -
protestant at 06:34 AM on 24 February 2011Hockey Stick Own Goal
#83. I will still anwer short: Models do not reproduce the behavior in temperature series (1940's). Only an explanation which includes those oscillations would. My clear point is, they do not (necessarily) generate heat (unless they are linked in changes to cloud cover, like ENSO is), but move heat around. This is enough to cause a short term (<65years) fluctuations in surface temperature. My point also ISNT that PDO (nor AMO) would explain *long term* trend. But the surely will when the trend is less than a full cycle. But I guess I had enough here, I will read any responses that might appear and then disappear. BB. -
robert way at 06:30 AM on 24 February 2011Hockey Stick Own Goal
Also, There was some commenter who insinuated that the use of GISS was because they supposedly "inflate" the warming. As I have shown before there is WIDE agreement amongst satellite and instrumental records, as well as including reanalysis datasets. http://www.skepticalscience.com/graphics.php?g=14 In fact, Hadley is the one whose station combination method has been shown to be dubious (by Roman M, a "skeptic") and therefore undersamples the actual warming. Furthermore, the european center for medium and long range forecasting who produce the most accurate of the reanalysis datasets (ERA) has also confirmed that Hadleys station combination method results in less sampling of the regions that are warming the most. I can even show you a direct example of this if you like? It is a huge annoyance that people continually make these claims. NASA data is used because it is the best representation of the trends, NASA assumes that the stations around the high arctic warm at the same rate as the high arctic whereas hadley just assumes they have the same trend as the global average. If you know anything about polar amplification you know which assumption is more accurate. Finally as I showed before in my post on temperature trends and Monckton, the Reanalysis datasets which include the most data agree much better with NASA than Hadley. So enough of the insinuations about selective method choice. There are in fact "better" methods and Hadleys is not better. -
protestant at 06:29 AM on 24 February 2011Hockey Stick Own Goal
Robert, I will not answer to Joe Romm's rant claiming Judy 'discredited'. You will definitely find blogs and writings where each of us and each and single one of the blogs in the internet are being 'discredited'. Have you read the two referenced I cited few messages back, about AMO? And please tell me, how do you get an almost one degree incline from mid 1900's if you calculated only decadal averages? As my calculations show above, the incline is less than 0,45degC, and I didnt use any predictive techniques. 2010 data is being used (downloaded from CRU) so that the graph ends where it should end, 2005. -
Follow-Up Case Study in Skepticism
thepoodlebites - Solar activity change hasn't been large enough to be significant since the late 70's; some measures (as you correctly point out) rising, some dropping, neither movement significant enough to change the climate based on our understanding of climate sensitivity. And statistically, random walk components including ENSO and PDO don't hold up (not numerically supportable) as drivers of the climate over oscillatory periods >11-15 years. For longer time scales the various forcings including CO2 emissions are the statistically relevant issues. -
johnkg at 06:24 AM on 24 February 20112nd law of thermodynamics contradicts greenhouse theory
I don't suppose RW1 or Co2isNotEvil can help in explaining things to damorbel? Would be nice to see the skeptics helping each other out rather than leaving all the hard work to KR :) -
muoncounter at 06:23 AM on 24 February 2011Hockey Stick Own Goal
Protestant, Apparently you do not understand the meaning of 'oscillation'? Consider finding the area under a sine curve over a full period; you always obtain 0. "Why do both, AMO and PDO STRONLGY correlate with temperatures?" Wow, then that must mean that correlation = causation? Thanks, we can use that basic principle to demonstrate CO2 -> increased temperature. For the lack of any long term effects due to the PDO, see the appropriate thread. Short answer: Ocean circulation moves heat around; it doesn't add heat. It is a response to a pre-existing non-uniform heat distribution. You really shouldn't need to see a link for that. This is not an oscillation thread; further oscillation discussion should go to the appropriate thread. -
Dikran Marsupial at 06:23 AM on 24 February 2011Hockey Stick Own Goal
NBModerator Response: Please, no more accusations of dishonesty, there have been enough warnings on this thread already. -
protestant at 06:22 AM on 24 February 2011Hockey Stick Own Goal
Dikran Marsupial: So now that I brought up McShane & Wyner, I hear some commenters starting to discuss about the paper overall. I am not interested in sucha discussion now. But here is the spesific statement I was referring to, and to which I fully agree: "It is not necessary to know very much about the underlying methods to see that graphs such as Figure 1 are problematic as descriptive devices. First, the superposition of the instrumental record (red) creates a strong but entirely misleading contrast. The blue historical reconstruction is necessarily smoother with less overall variation than the red instrumental record since the reconstruction is, in a broad sense, a weighted average of all global temperature histories conditional on the observed proxy record. Second, the blue curve closely matches the red curve from 1850 AD to 1998 AD because it has been calibrated to the instrumental period which has served as training data. This sets up the erroneous visual expectation that the reconstructions are more accurate than they really are." So far, I havent seen any evidence that would be in contradiction to this point. Even if you disagree with some points made in the paper, I dont think there should be any disagreement on this one. And this is my point. Using temperature data on top of proxydata should be done with extreme caution, and at least not with "predictive" smoothing excersises. What I also didn't get an answer to, is that what kind of smoothing Dana and Robert used. Was it Minimum Roughness, or something else with 'predictions'? Since rolling averages (or decadal if you wish, as Ljungqvist used) do not give even closely such a staggering result, it is a clear hint towards that something like this was being used.Moderator Response: Sorry, my responsibilities as moderator mean that I have had to withdraw from active discussion on this thread. -
Albatross at 06:21 AM on 24 February 2011Hockey Stick Own Goal
Protestant, I am not going to get drawn into a mud fight with you about various blogs on the internet. I would, however, urge you to be more skeptical about the true motives of some people claiming to be interested in "reconciliation". Tamino demonstrated that removing "the estimated impact of el Nino, volcanic eruptions, solar variation, and the residual annual cycle" the observed global warming signal is clearly evident. He also demonstrated that "Correlations with the AMO index do alias effects of global warming". Regarding DeSole et al., I will leave readers with these excerpts form their abstract: "This component, called the Internal Multidecadal Pattern (IMP), is stochastic and hence does not contribute to trends on long time scales, but can contribute signifi- cantly to short-term trends" and "While the IMP can contribute significantly to trends for periods of 30 years or less, it cannot account for the 0.8 C warming trend that has been observed in the twentieth century spatially averaged SST." Seems that you are seeing what you want to see protestant. And you still keep avoiding answering my question about climate sensitivity for doubling CO2 (with feedbacks). Why? -
2nd law of thermodynamics contradicts greenhouse theory
damorbel I've thought about the difficulty of getting this particular point through to you, and have a small Excel exercise for you. First row (1): "Sun" "Earth" "Atmosphere" "Space" Second row (2): "240" "=A2+0.5*C2" "0" "=B2-0.5*C2" Third row (3): "=A2" "=A2+0.5*C2" "=0.2*B2" "=B2-0.5*C2" Copy the third row and paste it in the 4th-20th rows. The "0" in the second line is to avoid a circular reference, but the actual guts take place in the third row. This represents solar input energy (240), surface radiated energy, energy intercepted/spherically radiated by the atmosphere, and energy radiating out to space. Constants (such as the 0.2 of IR intercepted by the atmosphere) are illustrative, but not tied directly to real values. The 0.5 radiated up and down from the atmosphere goes directly to space or the surface, so this is essentially a single-layer radiative atmospheric model without convection. What you will see is that the atmosphere, due to redirecting half of the energy back to the surface, warms it so that it radiates ~267 rather than 240. Meanwhile, the output to space is still 240, regardless. A cool object (atmosphere) has warmed a warmer object (the surface). Try constants other than 0.2 for IR absorption, and see how it goes; a 0.3 absorption brings the surface radiation to 282. Energy comes in from the sun, goes out to space - and reflecting insulation keeps the surface warmer than it would be otherwise, while maintaining the conservation of energy. Think about it. -
citizenschallenge at 06:14 AM on 24 February 2011Hurricanes aren't linked to global warming
MC, OK I've gone through it again with more care and I've look at some of the links below but am as confused as ever about the various claims. In particular, when someone waves that The FSU graph at #18: "Global Tropical Cyclone Accumulated Cyclone Energy" graph in one's face. Why no trend? Because Maue lumped all cyclones together and would have come up with something very different if he looked at just category 4, 5 storms? (is such a chart available?) And if one does that, what about being charged with cherry picking? -
thepoodlebites at 06:10 AM on 24 February 2011Follow-Up Case Study in Skepticism
# 76 I’m not disputing the surface warming since 1980, about +0.4 C in the UAH satellite record. I’m disputing the amount of the human component, specifically, CO2 induced global warming. There are alternative hypotheses that should be considered for both surface warming and droughts, including solar and SST variability, specifically ENSO and PDO. If the PDO shifts to more negative this decade with more La Nina’s than El Nino’s, then the global drought patterns will change and the Dai et al results will be more about drought patterns associated with persistent El Nino’s than any CO2-induced AGW signal. # 77 I have repeatedly pointed out that solar irradiance has not been dropping since 1960, according to LISIRD, TSI. The accuracy of PMOD reconstruction is in dispute, specifically, that the PMOD TSI trend is incorrect. But solar cycle 24 is weaker than 21-23 and it will be interesting to see how the global temperature record responds. -
damorbel at 05:48 AM on 24 February 20112nd law of thermodynamics contradicts greenhouse theory
KR you write:- ""Net" == summed, total, the amount actually moving after all elements are considered, etc." Follow your own logic, KR. The Earth's surface is a 'net' loser of energy; the upper atmosphere a net gainer. My conclusion is that 1/the surface is a net loser because it is warmer than the upper atmosphere so it (tends) to cool down, being a net loser of energy to the upper atmosphere. And 2/ the upper atmosphere is a 'net' gainer, therefore it tends to warm up with the (net +ve) heat gain from the surface since the upper atmosphere is cooler than the surface. No need for SoD's explanation or a visit to the good Dr. Spencer to understand this, is there? -
2nd law of thermodynamics contradicts greenhouse theory
damorbel - Rereading this thread, I have decided that it's not worth my while to rehash issues that have been discussed ad infinitum with you. You've been pointed at the appropriate information; I would suggest reading the thread over and working on understanding it. You've been given the data, you've been given multiple explanations - but your last post indicates you are repeating the same errors you've displayed from the very beginning. >300 comments later, and you're still holding to those physically incorrect views. Rehashing this topic with you yet again is a repetitive rhetorical exercise, unless you show some propensity towards learning. I'm not going to waste my time. Sorry about the rather harsh attitude; I'm just getting tired of people who simply refuse to learn. -
dana1981 at 05:42 AM on 24 February 2011Hockey Stick Own Goal
Harry Seaward - the first graph contains all the data from the studies in question. So it can't really be extended any further back in time, unless we attach data from different studies. -
protestant at 05:34 AM on 24 February 2011Hockey Stick Own Goal
Tamino didn't show anything about AMO. He just claimed it as a result of global warming and didnt substract it. His claims about AMO are also based on false calculations and interpretations, like substracting GISS from Kaplan to prove it where GISS does not use Kaplan SST, see here: http://bobtisdale.blogspot.com/2011/02/comments-on-taminos-amo-post_03.html). If you substract global SST anomalies (*the* nonlinear GW signal) from NA anomalies you get AMO, as you do by detrending NA. Same result. Just for the sake of this discussion, read the two references I just gave you (DelSole et al and Otterå) Also you are referring on dishonesty about ClimateAudit and claimed Climate etc. is a politically motivated site. Isn't that against your moderation policy? FYI Curry is a climate scientist and isnt keeping her blog for 'politics', but for truth seeking. I hope the rules are same for everyone here.Moderator Response: Indeed they are. Please leave the moderation to the moderators, and avoid inciting further discussion of topics that would contravene the comments policy.
Prev 1883 1884 1885 1886 1887 1888 1889 1890 1891 1892 1893 1894 1895 1896 1897 1898 Next


