


 Arguments


Recent Comments
Prev 1893 1894 1895 1896 1897 1898 1899 1900 1901 1902 1903 1904 1905 1906 1907 1908 Next
Comments 95001 to 95050:
-
RickG at 05:26 AM on 3 March 2011Climate Sensitivity: The Skeptic Endgame
Giles, I wonder if you are confused with the "5 to 95% uncertainty" description in the graphs and what that means. -
dana1981 at 05:23 AM on 3 March 2011Climate Sensitivity: The Skeptic Endgame
As I've said Giles, if you want to argue that every single independent line of evidence is somehow biased high, you're free to do so. However, studies based on accurate measurements, such as responses to recent large volcanic eruptions (as discussed in the "climate sensitivity is low" rebuttal linked in the article), are also consistent with the lower bound and range being discussed here. So frankly I don't really think your criticisms are valid. -
70rn at 05:21 AM on 3 March 2011Crux of a Core, Part 1 - addressing J Storrs Hall
I think you are totally missing the point in regards to people concerns regarding the above wuwt curve. It seems apparent that the 'instrumental record' displayed isn't data from the local site, or even the Greenland ice sheet as a whole (which has warmed 2 to 3 degrees over the past century); but appears to be a rather abstracted version of the global record as a whole. Whilst you may argue, with a degree of legitimacy, that the global temperature been used for comparison before, this in no way detracts from the fact that it's use on a strictly local curve is highly spurious. Especially when other, much more relevant, data is available, and particularly especially when that data shows a far greater degree of parity with any temperature spikes over the past 10K years since the last glacial period (and before that as well, for obvious reasons). Using a global average to compare with a specific local site is never robust - in most cases all it demonstrates is misleading at best, flat out fallacious at worst. That you make plain that those demostrating this are clearly aware of the data's purely localized nature, only serves to cast doubt on the agenda of such a presentation. -
Gilles at 05:13 AM on 3 March 2011Climate Sensitivity: The Skeptic Endgame
dana, I'm making the point that the use of "likelihood", based on a set of widely inaccurate measurements, is inappropriate. So, yes, I'm disputing the fact that " climate sensitivity is very unlikely to be below 1.5°C for 2xCO2", because I think that real scientists should be much more cautious when they do this kind of "statistics of results". And I explain why : if you do a statistics of results of numerical simulations of many complex systems, the result can be very far from reality. -
dana1981 at 05:04 AM on 3 March 2011Climate Sensitivity: The Skeptic Endgame
Giles #44 - I think the problem is that I don't see the point you're trying to make. You don't seem to dispute that climate sensitivity is very unlikely to be below 1.5°C for 2xCO2, correct? If your argument is just that the possible range of climate sensitivity values is wide, that's fine (Annan and Hargreaves would disagree with you), but most of the uncertainty is on the high end. Perhaps you could clarify exactly what point you're trying to make here. -
Gilles at 04:58 AM on 3 March 2011Climate Sensitivity: The Skeptic Endgame
going back to the initial topics Dana : "You are of course free to disagree, but as shown in the article, the conclusion that climate sensitivity is unlikely below 2°C and very unlikely below 1.5°C is supported by virtually every study on the subject using both empirical observational data and climate models." I don't disagree with this assertion - after all, this is just a kind of demographic study of models and measurements. I'm just saying that the interval of models and measurement is pretty wide, much much wider than what is usually considered as an "accurate" measurement in physical science, and that a demography of inaccurate measurements is not a very solid thing in science to measure a "likelihood" of anything - I gave precise examples in other fields, that is you believe in computer simulations, it is "very unlikely" that the sun oscillates or supernovae explode. -
Gilles at 04:50 AM on 3 March 2011Climate Sensitivity: The Skeptic Endgame
"making absurd claims to hijack everyone's attention and divert the subject of the discussion is what defines a troll, isn't it?" It may be, but my experience is that it is also often defined by "somebody who asks some damned irritating questions that I can't answer". You asked me for some references, did you read them?Moderator Response: [DB] Please see the response to you at 41 above. -
Daniel Bailey at 04:42 AM on 3 March 2011A Swift Kick in the Ice
For the curious:"Data released March 1, 20011 by NOAA’s National Snow and Ice Data Center shows that the seasonal extant of Arctic sea ice at the end of February, 2011, stood at a record low, well below the prior record set in 2005 and almost 3 million square kilometers below the average for that winter date, when sea ice is usually within days of its greatest seasonal extant for the year."
Pretty much a new minimum maximum (say that 3 times fast):
Gray line indicates 1979 to 2000 average extent I'd say that's a swift kick in the...ice. [ -Edit: fixed dates per guidance from michael sweet below; thanks michael! ] The Yooper -
Alexandre at 04:39 AM on 3 March 2011Climate Sensitivity: The Skeptic Endgame
Daniel #37 That crossed my mind too. BTW, making absurd claims to hijack everyone's attention and divert the subject of the discussion is what defines a troll, isn't it?Moderator Response: [DB] Everyone deserves the benefit of doubt. Until proven otherwise, Gilles should be considered a guest and seeker after knowledge here. :) -
Gilles at 04:39 AM on 3 March 2011Climate Sensitivity: The Skeptic Endgame
Daniel , thank you for noticing my contributions to RC - this is not a coincidence. Now you're free to answer my remarks, of course. Dana : you're confusing "scattering factor" with 95% confidence range. We are 95% confident that climate sensitivity lies above about 1.2°C. As KR #35 noted, almost all of the uncertainty you refer to is on the high end. So all you're arguing is that we can't rule out a scenario where the results of business-as-usual could be really, really bad. However, as I also previously discussed, Annan and Hargreaves put the sensitivity upper bound at 4.5°C with 95% confidence. If you believe their results, climate sensitivity is quite well-constrained." As I said, this kind of reasoning, applied to other problems, would conclude with a very high confidence level that solar cycles don't exist and supernovae don't explode. " Giles #32 - as Albatross noted (#34), unless you want to argue that we have far less coal reserves than we currently believe, the "we will run out of fossil fuels" argument is totally unrealistic. And Alexandre noted in #33, if that is the case, we'd darn well better start transitioning off of fossil fuels ASAP." So, if coal resources are reliable, so are oil resources, and you're also claiming that it is very unlikely that oil production would peak before all SRES scenarios predictions ? I think that's an interesting point that will be tested in the near future. How much are you ready to bet that oil production will exceed 100 Mbl/d , as all SRES scenarios predicted? I'm interested. But of course, I agree that we should try replacing fossil fuels ASAP - I'm just not really sure it is feasible. " I've addressed your point B previously by showing that the benefits of reducing carbon emissions outweigh the costs several times over. Technically I suppose you're right that it's an argument "skeptics" could make. Perhaps I should have specified "plausible" arguments." The real cost is not the cost of replacing fossil fuels by something else. It is in preventing the use of the spare fossil fuels for somebody else -especially the poorest people who need them the most. How far can you justify that fossil fuels should never be extracted even if poor people are starving juste on the above ground? that's not a virtual question, the development of China has pulled hundreds of million of people out of absolute poverty - but to my knowledge it has been achieved only through the use of fossil fuels.Moderator Response: [Daniel Bailey] Time to establish some ground rules, then. Let me first start by saying Welcome to Skeptical Science! There is an immense amount of reference material discussed here and it can be a bit difficult at first to find an answer to your questions. That's why we recommend that Newcomers, Start Here and then learn The Big Picture. I also recommend watching this video on why CO2 is the biggest climate control knob in Earth's history. Further general questions can usually be be answered by first using the Search function in the upper left of every Skeptical Science page to see if there is already a post on it. Or you can search by Taxonomy. If you still have questions, use the Search function located in the upper left of every page here at Skeptical Science and post your question on the most pertinent thread. Remember to frame your question in compliance with the Comments Policy and lastly, to use the Preview function below the comment box to ensure that any html tags you're using work properly. Keep the framing of your comments narrow and specific to the thread you post them on. Gish Gallops are frowned upon. Thanks! -
Charlie A at 04:38 AM on 3 March 2011Crux of a Core, Part 1 - addressing J Storrs Hall
 The above is from WUWT.
Note the "Central Greenland: caption in the upper right.
Compare with the Skeptical Science version, below:
The above is from WUWT.
Note the "Central Greenland: caption in the upper right.
Compare with the Skeptical Science version, below:
 Fig. 1: GISP2 as presented on Watts Up With That, conflating a local record with a global record.
Notice the removal of the "Central Greenland" caption.
==================
Let's move on into the article a couple of paragraphs:
Rob Honeycutt claims "Hall presents GISP2 as if it were a global record and makes no attempts to clarify that it is not nor does he even hint that he has any inclination that this is the case."
A simple scan of the article Honeycutt links to,Hockey Stick Observed In NOAA Ice Core Data shows the error of Mr. Honeycutt's statement.
The data is introduced as "It gives us about as close as we can come to a direct, experimental measurement of temperature at that one spot for the past 50,000 years."
Fig. 1: GISP2 as presented on Watts Up With That, conflating a local record with a global record.
Notice the removal of the "Central Greenland" caption.
==================
Let's move on into the article a couple of paragraphs:
Rob Honeycutt claims "Hall presents GISP2 as if it were a global record and makes no attempts to clarify that it is not nor does he even hint that he has any inclination that this is the case."
A simple scan of the article Honeycutt links to,Hockey Stick Observed In NOAA Ice Core Data shows the error of Mr. Honeycutt's statement.
The data is introduced as "It gives us about as close as we can come to a direct, experimental measurement of temperature at that one spot for the past 50,000 years."
-
robert way at 04:37 AM on 3 March 2011Climate Sensitivity: The Skeptic Endgame
The Inconvenient Skeptic at 22:14 PM on 2 March, 2011 You're also ignoring the cooling effect of sulphate aerosols which have a negative radiative forcing. But no, continue cherry picking as much as you like. -
robert way at 04:32 AM on 3 March 2011Climate Sensitivity: The Skeptic Endgame
The Inconvenient Skeptic at 17:49 PM on 2 March, 2011 , Include a 12-month smoothing in your graphic please and also answer why you decided to end in 1996 considering the volcanic aerosol loading of the atmosphere in 1992,1993 and 1994 were very important? -
Gilles at 04:26 AM on 3 March 2011Climate Sensitivity: The Skeptic Endgame
Alexandre and Albatross with pleasure : look towards people of ASPO, such as Aleklett, Laherrère, Rutledge http://www4.tsl.uu.se/~aleklett/powerpoint/20100609_Aleklett_kva.pdf http://rutledge.caltech.edu/ http://aspofrance.viabloga.com/files/JL_IPCCscenarios09.pdf they say all approximately the same : IPCC scenarios are basically grossly overestimating the size of fossil resources, especially oil and gas. And that "current path" is simply untenable, so extrapolations aren't justified. Note that the amount of "official reserves" is not criticized - the only point is just that IPCC doesn't really care of proven reserves, it assumes that expensive, unconventional resources could be extracted at the same pace or even a higher pace than the current conventional ones - which isn't justified by any real facts. If peak oil happens soon, which is more and more likely, then all SRES scenarios will fail on this point. KR : "Looking at that same graph, and at the numbers, you will note that the lower end of the range of 2-4.5°C is very solid, very little chance of the actual values falling below that level - " I disagree with you : unaccurate data and models are never "very solid", even on a statistical point of view. They can be prone to systematic biases. As an example, models of the sun can explain a lot of things, but not the 11-years cycle. That is, if you believe in computer models, they hardly describe activity cycles, and when they do, they are much shorter than expected. The 11-year cycle can be dismissed on a "statistical study" of the models - yet it does exist. In the same way , supernovae never explode in numerical models. That's a pity, but supernovae don't exist in the world of numerical computations. Based on numerical experiments, they are statistically impossible. Yet they do exist. So I am personnally rather reluctant in front of a "set of inaccurate measurements". "You seem to be arguing that natural forcings or feedbacks (outside the ones we know of, or poor measurements? Not clear...) will lead to overestimation?" No, I am talking about other causes than forcings and feedbacks - causes of change that are due to something else, changes in the oceanic circulation, atmospheric convection patterns, and so on - that can lead to a variation of the average temperature without a change of the average forcing.
Response:[dana1981] You are of course free to disagree, but as shown in the article, the conclusion that climate sensitivity is unlikely below 2°C and very unlikely below 1.5°C is supported by virtually every study on the subject using both empirical observational data and climate models. As mentioned in the article, you're basically arguing for the scenario in which every single line of evidence is wrong, because they're all very consistent on the climate sensitivity lower bound.
-
Daniel Bailey at 04:15 AM on 3 March 2011Climate Sensitivity: The Skeptic Endgame
Just as an FYI, someone also posting by the name "Gilles" has been clogging up threads over at Real Climate for over a year now. Not saying that this "correlation" means anything. In the wake of the Poptech, damorbel and RW1 threads, just wanted to point it out. The Yooper -
dana1981 at 04:11 AM on 3 March 2011Climate Sensitivity: The Skeptic Endgame
Giles #31 - you're confusing "scattering factor" with 95% confidence range. We are 95% confident that climate sensitivity lies above about 1.2°C. As KR #35 noted, almost all of the uncertainty you refer to is on the high end. So all you're arguing is that we can't rule out a scenario where the results of business-as-usual could be really, really bad. However, as I also previously discussed, Annan and Hargreaves put the sensitivity upper bound at 4.5°C with 95% confidence. If you believe their results, climate sensitivity is quite well-constrained. Giles #32 - as Albatross noted (#34), unless you want to argue that we have far less coal reserves than we currently believe, the "we will run out of fossil fuels" argument is totally unrealistic. And Alexandre noted in #33, if that is the case, we'd darn well better start transitioning off of fossil fuels ASAP. I've addressed your point B previously by showing that the benefits of reducing carbon emissions outweigh the costs several times over. Technically I suppose you're right that it's an argument "skeptics" could make. Perhaps I should have specified "plausible" arguments. -
KR at 03:56 AM on 3 March 2011Climate Sensitivity: The Skeptic Endgame
Gilles - "well, on the other hand, simple inspection of the Fig 2 in this post shows a scattering of almost a factor 10 in the estimates. So what's your definition of a 'reasonably well known factor'? " Looking at that same graph, and at the numbers, you will note that the lower end of the range of 2-4.5°C is very solid, very little chance of the actual values falling below that level - it would contradict just about all the data we have. We know about alligators near the Arctic circle and the "snowball Earth" - the data sets certain minima on what climate sensitivity could be. The high end is less certain - and I'm not going to take uncertainty indicating very high sensitivities as a good sign. There are definitely uncertainties in the data, although I believe you are overstating them - lots of lines of evidence support paleo reconstructions of CO2, solar activity, aerosol levels, temperatures, etc. And there are few issues indeed with Milankovic forcings. "The issue I see is that IF natural, unforced variability is important , it will generally lead to overestimate the sensitivity. But excluding an unforced variability is very difficult just because you have no way of knowing if it is unforced or not - so by making the assumption that everything is due to forcings, you will end up with a figure, which will be always biased to high values. " I have to seriously disagree. You seem to be arguing that natural forcings or feedbacks (outside the ones we know of, or poor measurements? Not clear...) will lead to overestimation? But that's only true if for each of the studies there is an unaccounted for forcing that adds to the effect. It's just as (un)reasonable to argue that said unmeasured forcings subtract from it. If there are poor measurements, they only widen the range, not bias it. -
Albatross at 03:55 AM on 3 March 2011Climate Sensitivity: The Skeptic Endgame
Gilles @33, We have mountains of coal to burn, mountains. We can easily realize the most optimistic scenarios, all of which bring us very close to +2 C warming, and right now we are following one of the most aggressive trajectories. Please provide evidence from a reliable and reputable source that we cannot. And even if, in the very unlikely event CS were less than +2 C, consider this: 1) The impact of ocean acidification on the ocean food web on which a huge portion of the population depends. See appropriate threads (and links) at SkS. 2) The fact that, on our current path, we will easily double CO2 before 2100. So doubling CO2 becomes arbitrary. There are other good reasons for reducing our GHG emissions, but I will leave it there for now. -
Alexandre at 03:51 AM on 3 March 2011Climate Sensitivity: The Skeptic Endgame
Gilles #33 About this part: A) that the amount of fossil fuels that we can really extract is far below most of SRES scenarios and that CO2 levels will never reach dangerous levels anyway. Now that's really good news. Can you give me some reference of this and make my day? Of course, that makes all the renewable energy stuff even more urgent, but still. -
Gilles at 03:36 AM on 3 March 2011Climate Sensitivity: The Skeptic Endgame
"Lou - thanks. Agreed, I think "sensitivity is low" will become the go-to "skeptic" argument, because frankly there's just no other way to argue that we shouldn't reduce CO2 emissions. And the refusal to support CO2 emissions reduction measures is the basis for almost all global warming "skepticism"." I disagree with that, Dana. There are at least two other possible reasons for arguing that we shouldn't reduce CO2 emissions, even with a 2°C sensitivity. A) that the amount of fossil fuels that we can really extract is far below most of SRES scenarios and that CO2 levels will never reach dangerous levels anyway. B) that even if some dangers are real, they do not exceed by far the wealth brought by the fossil fuels, and that mitigation is still a better choice. Just as we accept the casualties of car crashes, or a reasonable amount of pollution, or even we do not forbid the sale of alcohol or tobacco. Of course, this is not climate science - but it is still relevant to the public debate. -
Gilles at 03:31 AM on 3 March 2011Climate Sensitivity: The Skeptic Endgame
KR : well , on the other hand, simple inspection of the Fig 2 in this post shows a scattering of almost a factor 10 in the estimates. So what's your definition of a "reasonably well known factor" ? I doubt that any of the paleo records you are citing, that are essentially LOCAL, can give an accurate estimate of the global forcing. Aerosols and clouds are ill known, even now, I doubt very much that they are much well constrained hundreds of thousands of years ago. On average, I am not very comfortable with a general feeling of "well, of course, there is much scattering and a lot of unknown factors, but still everything is pretty well constrained". The issue I see is that IF natural, unforced variability is important , it will generally lead to overestimate the sensitivity. But excluding an unforced variability is very difficult just because you have no way of knowing if it is unforced or not - so by making the assumption that everything is due to forcings, you will end up with a figure, which will be always biased to high values. Then the statistical analysis of "how many studies show that the figure is above X" will also be biased as well. Is it not kind of an issue ? another issue is that the average forcing is by far not enough to define the temperature. During the northern summer, the Earth is farther away from the sun than during the southern summer (orbit ellipticity). But the averaged temperature is higher - because there are more land in the northern hemisphere. So if you take the basic definition of the sensitivity, it is actually NEGATIVE. In principle you could deal with that with averaging over a long period - but then you're facing the problem of possible long term changes in a series of factors (oceanic circulation, land coverage, and so on..). -
Albatross at 03:29 AM on 3 March 2011Climate Sensitivity: The Skeptic Endgame
Dana, Thanks. Keep at it-- the "skeptics" have nothing but obfuscation and it shows. Typo first line , second para (see bolded text below): "One of the most pAropular "skeptic" arguments is..." -
dana1981 at 03:28 AM on 3 March 2011No Illusions podcast interview (and elocution lessons from an 11 year old)
Maybe your daughter can give you some interviewing lessons!Response: I'm picturing a sequel to "The King's Speech"... "The Blogger's Interview" :-)
She was obviously buoyed by her speaking skills as last night, she challenged me to a "rematch" where Wendy would interview both of us and the first person to "umm" lost the competition. Unfortunately she won again! I'll be challenging her to a 3rd contest tonight - can't let an 11 year old get the better of me! -
dana1981 at 03:25 AM on 3 March 2011Climate Sensitivity: The Skeptic Endgame
Lou - thanks. Agreed, I think "sensitivity is low" will become the go-to "skeptic" argument, because frankly there's just no other way to argue that we shouldn't reduce CO2 emissions. And the refusal to support CO2 emissions reduction measures is the basis for almost all global warming "skepticism". -
Lou Grinzo at 02:51 AM on 3 March 2011Climate Sensitivity: The Skeptic Endgame
Very nice article, and, as always on SkS, the comment section is "interesting". My guess is that we'll be seeing much more of this argument that sensitivity is conveniently (for the deniers) low. The simple fact is that as real world events and scientific advances keep piling up not just evidence that ACC works exactly as we currently understand it, but evidence that's painfully clear to non-experts, the deniers will increasingly fall back on sensitivity. The fact that this argument leads to contradictions among their various positions and that it requires them to come up with other explanations for observed phenomena won't stop them. Such logical issues haven't been a hindrance in the past, after all. -
Lars Karlsson at 02:49 AM on 3 March 2011Climate Sensitivity: The Skeptic Endgame
The Inconvenient Skeptic, Where do your temperature data in the link from 4 come from? To me, it seems like they have been detrended. -
JMurphy at 02:38 AM on 3 March 2011Human CO2 is a tiny % of CO2 emissions
mikea01, the "IPCC experts" you mention don't actually exist as a body : the IPCC is an aggregation of thousands of scientists and their work. The IPCC Reports are the agreed output of much scientific input, agreed to by not only those who worked on the Reports but also by the vast majority of science and scientists from all branches. What is it that confuses you, and which bits (and why) do you consider to be "poor science" ? -
KR at 02:33 AM on 3 March 2011Climate Sensitivity: The Skeptic Endgame
Gilles - Actually, many of the factors are reasonably well known. Ice cores record plenty of information; CO2 levels, aerosols, local temperatures, proxies for solar activity, etc. The Milankovic forcings are tied to orbital dynamics, and those are predictable for millions (if not billions) of years into the past and future. I suggest that a look at the Climate Sensitivity is low/How Sensitive is our climate page might be useful. The intermediate version of the page points to a dozen or so separate papers estimating climate sensitivity in various ways, and the advanced version graphically shows the results they got. -
Gilles at 02:21 AM on 3 March 2011Climate Sensitivity: The Skeptic Endgame
thank you, bern, but this is still a little bit puzzling : how can you measure a sensitivity in the past if many ill-known factors contribute "significantly" to the forcing ? -
Arkadiusz Semczyszak at 01:39 AM on 3 March 2011Roy Spencer’s Great Blunder, Part 2
@From Peru „I suspect an ideological, right-wing common root on both positions.” Such thinking is the road to nowhere. Professor Z. Jaworowski radiologist, and V. Klaus economics professor, in his books "proving" that has Hitler and Stalin were in favor of clean environment - their leftist views formed the basis for the theory of AGW. It's absurd conspiracy theories. Skeptics are split into much more than we imagine supporters of AGW. Eg I do not agree with R.S. that is ENSO - PDO (internal climate forcing) decide on changes in cloud cover - and those of the ENSO-PDO (feedback). I agree that determines the nature - the sun (not AGHG), but in a much more complicated - and not chaotic. After the publication of the IV report, many papers on AGW supporters - who say they generally agree with the theory of AGW - rebel against allegations that the IPCC models did not appreciate, for example: QBO, volcanic effects on ozone, the effect of ozone on a pair water in the stratosphere and vice versa, lunar cycles, the newly discovered solar cycles, cycles of changes in UV solar magnetic cycles of geo-solar, ENSO impacts on phytoplankton (and vice versa) ..., that the respiration of peat is twice the pandas than estimated in the IPCC report, that are not reflect changes in regional Q10 reduces the actual amount of respiration by 25%, etc.. ... Recently for example, Mike Lockwood said that a slight change in the UV (energy - compared to RF CO2) has a huge impact on the jet stream - causes that I am in Poland for 3 weeks I have from 1030 to 1040 hPa and "suffer" from the arctic cold ... Though it shows the “feet of clay” and can be based on the great theory of AGW. R. Spencer (also R. Pielke) is certainly right in one thing: we know too little about natural climate variability. Really about how many regions we can say: “... strong late 20th-century warming (during the warm season) in western North America may have a considerable component of natural climate variability in the signal.”? (Tree rings and past climate in the Arctic, Juday et al., 2010). P.S. And evolution has much in common with the climate - for millions of years in practice it was not - occurred only a short time of rapid climate change. -
Bern at 00:42 AM on 3 March 2011Climate Sensitivity: The Skeptic Endgame
Gilles at #10: if you look at Dana's Figure 1 in the article, you'll see there are a number of different factors that can influence climate in quite significant ways. There's no reason why all of these should react similarly to Milankovic forcing - indeed, some of them (such as aerosols) are depending entirely on other sources, such as volcanism. It's the combination of all these, the total net forcing, that determines how the planetary climate responds to Milankovic forcing. For example, this SkS post explains how the additional CO2 we're dumping into the atmosphere may well over-ride the Milankovic forcing for tens or even hundreds of thousands of years. When climate scientists look at how the planetary climate reacted to Milankovic forcing in the past, and try to predict how it will react in the future, they need to take all these other factors into account. -
les at 00:35 AM on 3 March 2011Human CO2 is a tiny % of CO2 emissions
114 mikea01. 1/ "experts (or at least those who are knowledgeable about the science) do not agree on very much." you might conclude that if you like, but I'd suggest it's possible to draw another conclusion - there is a high level of consensus in the broad trends, but science always has room for improvement and clearing up details. 2/ " poor science in many of the arguments" - yes, but most the poor science and, indeed, argumentation, is confined to people motivated not to accept what's going on for one reason or another. - on a personal note, your posts contains a chain of assertions and non-sequitors, that I feel it may come under the umbrella of poor-argumentation it's self. 3/ you might be inclined to go for an "ultimate solution" of population reduction... but most governments would feel that that sounds to much like a "final solution". However, on that topic, the best means of getting population growth under control known to man is increasing the standard of living. The only exception to that seems to be the US to a small degree and in extreme cases. Improving wealth, by not using developing countries to dump our pollution in and evening out consumption between the rich and poor is a grand and very difficult strategy, however. -
Bern at 00:32 AM on 3 March 2011Climate Sensitivity: The Skeptic Endgame
It seems clear that TIS is cherry-picking data - choosing a period for examining temperature rise that starts in an abnormally warm year (the "1998 of the 50's", looking at the chart) and ending on a moderately cool one. It looks like exactly the same technique used by 'skeptics' to argue there has been no warming since 1998, and by a certain ex-astronaut to argue there's more arctic sea ice than there was 20 years ago... Others have touched on the other erroneous assumptions in TIS' posts - assuming that CO2 is the *only* driver of climate, for example. But all this is off-topic to this post (apart from the common thread of denying reality)... -
mikea01 at 00:22 AM on 3 March 2011Human CO2 is a tiny % of CO2 emissions
I am a lay environmentalist and I have to admit that I'm confused about the issue of Climate Change and specifically Global Warming. It seems to me that the comments on these pages are testament to the fact that the experts (or at least those who are knowledgeable about the science) do not agree on very much. Amongst the IPCC experts, we are told that there is a general concensus that it is definitely happening, yet there seems to be poor science in many of the arguments. Perhaps both sides of the debate are guilty of misinformating to some degree or other. I am inclined to think that in order to tackle most global issues, including Climate Change and polution, the ultimate solution is to significantly reduce the human population. Yet we never hear governments banging on about this, do we? All we hear are rather trivial suggestions about reducing use of plastic bags and putting flourescent bulbs in. Some arguments for and against are included in past issues of Nature MattersModerator Response: [Daniel Bailey] Welcome to Skeptical Science! In addition to the sage advice given by both les and JMurphy below, there is an immense amount of reference material discussed here and it can be a bit difficult at first to find an answer to your questions. That's why we recommend that Newcomers, Start Here and then learn The Big Picture. I also recommend watching this video on why CO2 is the biggest climate control knob in Earth's history. Further general questions can usually be be answered by first using the Search function in the upper left of every Skeptical Science page to see if there is already a post on it (given the plethora of posts [I get paid extra for using big words and alliteration :-) ] odds are, there is). Or you can search by Taxonomy. If you still have questions, use the Search function located in the upper left of every page here at Skeptical Science and post your question on the most pertinent thread. Remember to frame your question in compliance with the Comments Policy and lastly, to use the Preview function below the comment box to ensure that any html tags you're using work properly. I'm afraid parts of your comment are simply incorrect. The warming of the globe is an accepted fact. That humans are causing a good part of it is accepted at over a 90% scientific certainty level. Only the anthropogenic contribution (which did not exist in the paleo record) completes the picture, explaining the warming we can empirically see and measure in the absence of other forcings. Else we would be measuring a decades-long cooling trend, which we aren't. -
les at 00:22 AM on 3 March 2011Climate Sensitivity: The Skeptic Endgame
10, me.. "armies which are not fully destroyed" should, of course have been "armies which are not fully deployed" -
Alexandre at 23:29 PM on 2 March 2011Climate Sensitivity: The Skeptic Endgame
TIS #4 It's nearly a Gish Gallop, but addressing only this paragraph: Since CO2 levels were 310 ppm in 1950. It was only after 1960 that the CO2 levels started to significantly increase. I assume you consider a 10% increase (280-310ppm) "non-significant". Then the "significant increase" of CO2 after 1960 is considered to have happened after the significant increase of temps that began in the 70s. It's quite a feat to compress so many unsubstantiated claims in such a small text. -
Marcus at 22:44 PM on 2 March 2011Climate Sensitivity: The Skeptic Endgame
So, to sum up The Inconvenient Skeptics technique. Make a number of ludicrous, unfounded claims then-when people point out how they're clearly *wrong*, dismiss it all with a trite "I don't find that convincing"-without ever needing to provide a shred of evidence to back that claim. What does he think this is, WUWT? -
Marcus at 22:42 PM on 2 March 2011Climate Sensitivity: The Skeptic Endgame
TIS, to be honest, none of your claims to date have been very convincing to me. I've checked all your claims, & found them *all* to be wanting. See, TIS, I can dismiss your claims without proof just as easily as you. Fortunately, though, I *Have* provided proof of what a load of rubbish most of your claims are-you still haven't provided a single shred of *evidence* to back your claims-which puts you squarely in the same category as "Lord" Monckton. -
Marcus at 22:34 PM on 2 March 2011Climate Sensitivity: The Skeptic Endgame
Ah, TIS, I see that your "skepticism" is extremely selective. So because a few short years don't fit your "expectations" of what CO2 should have done-in spite of the fact that it can be easily explained by the fact that the bulk of the planet's 2.5 billion people didn't even *have* electricity at that time-or cars-& at least half of the remainder were off fighting a war in foreign countries. As has already been pointed out, the fact that most of Europe's economy was constrained by *rationing* is a *known* *historical* *fact*. As to your other claim, it's a load of rubbish. In spite of an overall decline in sunspot activity for the period of 1961-2000, temperatures rose at a rate of almost +0.12 degrees per decade. By contrast, when the rise in CO2 was a lot smaller, but sunspot numbers were rising extremely quickly (1901-1940), temperatures warmed at a rate of only +0.08 degrees per decade. How do explain that if sensitivity to CO2 is so low-or is this another claim made by "skeptics" that can't be backed up by hard facts? -
The Inconvenient Skeptic at 22:32 PM on 2 March 2011Climate Sensitivity: The Skeptic Endgame
#15 Marcus, Solar activity (I assume you mean sunspots) has never really been too convincing to me. I have run plenty of comparisons, but it always seems weak. Some of that poor correlation you refer to is high activity with low temperature. If the activity in the 1938 caused the warm 1940 period, then the peaks in the 50's and 60's should have caused more. The 1956-1960 sunspot activity might be the most active period in thousands of years, but the temps were not high. That is poor correlation. -
The Inconvenient Skeptic at 22:14 PM on 2 March 2011Climate Sensitivity: The Skeptic Endgame
Shoy, A few data points on a video are not convincing that WWII had no impact on CO2 levels. Regardless, there is little temperature rise from the start of monthly CO2 data until the 1990's. CO2 did rise a great deal in that same period of time. -
Riccardo at 22:09 PM on 2 March 2011Roy Spencer’s Great Blunder, Part 2
As for the problem of the rising of the emission level above the tropopause (Peter Offenhartz #8), the height of the tropopause depends on temperature. An increased GHG absorption will move both the tropopause and the emission level upward. In equilibrium and at wavelengths where the atmosphere is optically thick, the emission level will roughly be that corresponding to the effective temperature of the planet of about 220 K. In reality, the absorption coefficient depends on the number concentration of CO2 (number of molecules per meter squared), not relative concentration (ppm), and hence on pressure and altitude. Detailed calculation are required. -
Marcus at 21:55 PM on 2 March 2011Climate Sensitivity: The Skeptic Endgame
TIS-there are studies that shows an 80% correlation between solar activity & temperature variation for the period of 1900-1950. For the period of 1950-2000, that correlation fell to less than 40%. This drops to less than 20% for the period of 1980-2000. Put another way-sunspot numbers rose significantly during the first half of the 20th century, causing a relatively slow rise in global temperatures over this period. In the second half of the 20th century, sunspot numbers have remained either static-or have fallen-yet temperatures have risen *faster* than in the first half of the century. -
les at 21:51 PM on 2 March 2011Climate Sensitivity: The Skeptic Endgame
3. HuggyPopsBear "I recognize pollution is a problem of mankind and something needs to be done, but CO2 is not necessarily a pollutant as it has many benefits for sustaining life and plant growth." There is nothing which is necessarily a pollutant. Things are just pollutants when they are in the system in such quantities as to cause harm in some way. Noise and light are not necessarily pollutants but we're quite happy that they can be polluting. Equally many heavy mettles are more clearly pollutants but exist all over the show in small quantities. It's an oft used fallacy that because something is required for life it can't be a polluting; and even if, to some degree, more is better - it doesn't follow that to a higher degree, much much much more is better. Sure CO2 is required for life and, to some degree, more CO2 is good for plants directly. That makes no difference to it's impact on the climate and overall environment! Same's true for oxygen. We - and most animals - need it. To some degree we can perform a little better with a bit more. However we can't use more than our blood can carry on the one hand; and on the other hand oxygen is extremely dangerous and our bodies have to work very hard to avoid being harmed by it. You really have to understand the system under consideration to understand pollution! As for your previous comment "tax a probability" - really? Most countries have armies which are not fully destroyed, because there's a probability the'll be needed or a probability they will deter aggression. Many people have health insurance - and many countries have compulsory health insurance - at a level based on the probability of getting ill, with the impact of illness factored in. etc. etc. Finally, as for "governments greed" ... who knows - certainly not the arctic ice. It doesn't know whether your or my government is greedy or not, it just keeps on melting... -
shoyemore at 21:48 PM on 2 March 2011Climate Sensitivity: The Skeptic Endgame
TIS #12, Surely you exaggerate the "massive quantities" of CO2 released in 1937-1950. The world economy was far smaller than it is now - heavy industrial production was largely confined to a few countries in Europe, and to the US. The late 1930s saw a resurgence of depression in the US. That was reversed in the war, but the latter end of 1939-45 saw total devastation of German and Eastern European industry. Britain was still under rationing until the late 1940s. BTW, I though ice cores gave an accurate picture of CO2 levels prior to recorded observations from 1957 or so. Getting the data in this video should help Visualizing the History of CO2 -
Tom Curtis at 21:29 PM on 2 March 2011Crux of a Core, Part 1 - addressing J Storrs Hall
Charlie A @37, I'm sorry, I missed that part of Hall's article where he said, "Although I am using a regional temperature only, I am comparing it to a global temperature. Global temperatures show much less variation than regional temperatures because different regions of the world will be warming while others cool. Therefore any comparison between global and regional variation is essentially meaningless. But here goes..." I also missed that part where he said, "Although nineteenth century temperatures are much cooler than 20th century temperatures, I am treating the final temperature in this series, from 1855, as though it was representative of late twentieth century temperatures for rhetorical reasons." I especially missed that part where he said, "It is known that temperatures in the last decade are at least 1.44 degrees higher than the last point on this graph at the location of the ice core. This makes the late twentieth warming one of the most abrupt on the record, with the distinction that it, unlike the others on this record, was global rather than regional in extent." In fact, the only bits I noticed was where he persistently compared local to global temperatures as though that was a reasonable thing to do. If he had wanted to do an honest analysis, his graph would have looked like this: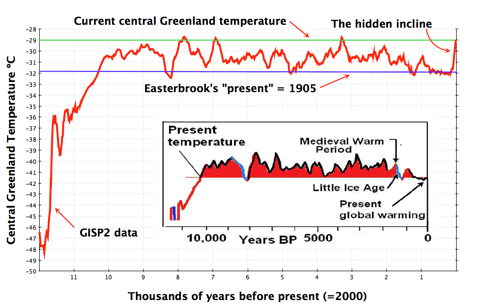 (With thanks to Gareth Renowden.)
The reason he didn't actually draw modern local temperatures on the graph is because it would have made it perfectly clear how utterly laughable is his entire argument.
(With thanks to Gareth Renowden.)
The reason he didn't actually draw modern local temperatures on the graph is because it would have made it perfectly clear how utterly laughable is his entire argument.
-
dorlomin at 20:08 PM on 2 March 2011Crux of a Core, Part 1 - addressing J Storrs Hall
Dr Hall shows us temperatures up to 100 years ago and demonstrates that local temperatures had been at least 3C warmer than it was 100 years ago therefor global warming is 'poppycock'. This is why they are skeptics. "If it can be shown to have been warmer at some point during the holocene than it was 100 years ago, atmospheric physics is a con job." Lets not forget Wattsup is the website that described all those paleoclimatologists who they describe as 'The Team' as belonging to a "Marxist orginisation". -
The Inconvenient Skeptic at 20:07 PM on 2 March 2011Climate Sensitivity: The Skeptic Endgame
Kevin, I have plenty of annual data, but imagine if I tried to interpolate monthly data with the annual variation included. In addition I strongly doubt that accuracy of the CO2 data you linked between 1937-1950. I struggle with the idea that there was no increase in CO2 during that period. There was enormous production during that period with massive quantities of CO2 released. Every production facility in the world was working at maximum capacity for portions of that time. I do appreciate the link though. Insolation changes over the past 100 years should be warming the winters and reducing the temperature difference between the poles and the equator as the tilt is very slowly decreasing. -
nigelj at 20:03 PM on 2 March 2011Climate Sensitivity: The Skeptic Endgame
Huggy Pops bear #2 A definitive answer is impossible as you cant put the planet in a laboratory. Its really that simple. All you can get is probabilities. Modelling is a substitute for not being able to put the planet in the lab. Its frustrating but thats the reality, and you just have to live with it or risk the ruin of the planet. -
Dikran Marsupial at 19:55 PM on 2 March 2011Prudent Risk
RSVP@23 No, of course I am not saying that. Some ecological niches require longevity to fully exploit, so fitness for a particular environment/niche is a compromise of many factors, longevity and evolutionary adaptability are only two of them. We don't need to use evolution as a measure of environmental change, there is plenty of direct evidence that the environment changes. We all know that, and it is entirely uncontraversial. BTW, if we lived forever, there would be no evolutionary adaption to viral and microbial pathogens (which don't live forever). So even if the environment were unchanging, we would not survive as a species if we lived forever, so your argument isn't even logically consistent.
Prev 1893 1894 1895 1896 1897 1898 1899 1900 1901 1902 1903 1904 1905 1906 1907 1908 Next


