


 Arguments


Recent Comments
Prev 1894 1895 1896 1897 1898 1899 1900 1901 1902 1903 1904 1905 1906 1907 1908 1909 Next
Comments 95051 to 95100:
-
muoncounter at 12:25 PM on 20 February 2011A Swift Kick in the Ice
RW1: "30 years is hardly enough data" But in a prior comment, you take some significance in what you describe as 'the past three years'??? Sorry, your seal story does not suggest 'a large degree of variability' -- because 1 year is hardly enough data to do that. -
RW1 at 12:19 PM on 20 February 2011A Swift Kick in the Ice
Tom (RE: 72), We don't know - there aren't enough specifics. The point is it suggests a large degree of variability even nearly 90 years ago. -
TOP at 12:18 PM on 20 February 2011A Swift Kick in the Ice
First off the graphic in Figure 3 showing the albedo of water in the 8-9% seems a bit high. I'd put is at 3-7.5%. Albedo The Arctic Circle is a line above which there is continuous sun in summer and no sun in winter. The high temperature anomaly in the Arctic this winter was not due to the greenhouse effect directly on the Arctic Ocean. It was due to heat being transported to the Arctic by global weather patterns. If you run the animation you see the transport of heat from as far south as the Sahara to the Arctic through a cluster of vortices that swirl around the arctic like giant hurricanes pulling warm air from southern climes and pushing cold air back down. Cold air can pour out of the Arctic into the more temperate areas such as caused the large snow events in the US and England. When this happens you get something like this:
  It should be obvious that the warming of the Arctic is not due to the greenhouse effect taking place in the Arctic. There isn't any to speak all year round and especially in winter.
You might say, "What about summer? Isn't there greenhouse effect due to the open water?" Not much because the albedo of the open water is so low that there is little long wave radiation or any other kind going up out of the water after the sun's rays hit it. All that energy is deposited deep in the water, CO2 or no CO2. So regardless of CO2, an ice free Arctic Ocean is going to contribute a lot to global warming during summer months.
What was not addressed in the article is whether the polar regions are any less effective in radiating energy into space in the winter seasons regardless of the ice state.
It should be obvious that the warming of the Arctic is not due to the greenhouse effect taking place in the Arctic. There isn't any to speak all year round and especially in winter.
You might say, "What about summer? Isn't there greenhouse effect due to the open water?" Not much because the albedo of the open water is so low that there is little long wave radiation or any other kind going up out of the water after the sun's rays hit it. All that energy is deposited deep in the water, CO2 or no CO2. So regardless of CO2, an ice free Arctic Ocean is going to contribute a lot to global warming during summer months.
What was not addressed in the article is whether the polar regions are any less effective in radiating energy into space in the winter seasons regardless of the ice state.
-
RW1 at 12:13 PM on 20 February 2011A Swift Kick in the Ice
Albatross, I'm not disputing that the documented period we have shows a downward trend, but 30 years is hardly enough data to show whether this is anything significant or just random noise of natural variability. Why hasn't the Antarctic shown the same trend? If anything, it's slightly increased over the same period. -
Tom Curtis at 12:11 PM on 20 February 2011A Swift Kick in the Ice
RW1 @65: 1) Some, not many, locations were still iced over at the 2007 minimum at 81.5 degrees latitude, mostly between the Canadian islands where they are protected from the influx of warm water from the Atlantic and Pacific; protected also from wind breaking up the ice; and also have a limit on the Ice Albedo effect because of the more constant albedo of the nearby islands. 2) North of Spitsbergen there is one location ice free at 81.5 degrees north on the February 19th Ice Extent. (Not the maximum, and not claimed to be the maximum, but still a winter ice extent). 3) Your report says, "EXPEDITIONS REPORT THAT SCARCELY ANY ICE HAS BEEN MET WITH AS FAR NORTH AS 81 DEGREES 29 MINUTES." The phrase "as xxx yyy as" is always used to indicate the furthest extent of which something is true. So multiple expeditions (possibly 2, possibly 20, we don't know) found ice free water were they expected to find ice, and the furthest north of which this was true (ie, one sighting by one expedition) found ice free water at 81.5 degrees north. Which was also true yesterday, during winter. I suspect the furthest northerly extent free of sea ice in the summer of 1922 was also just north of Spitsburgen as well. After all, in 1599, ie, during the LIA the southern coast of Spitsburgen (about 77 degrees north) was also ice free. -
muoncounter at 12:07 PM on 20 February 2011A Swift Kick in the Ice
Albatross, you beat me to it this time! RW1: I usually define 'accelerating' as describing the motion of an object where the first derivative and second derivative of position have the same sign; but we can just say 'speeding up'.
 -- both from Has Arctic sea ice returned to normal?
Pay attention to trends, not a year or two. But if you insist, here's how this year stacks up:
-- both from Has Arctic sea ice returned to normal?
Pay attention to trends, not a year or two. But if you insist, here's how this year stacks up:
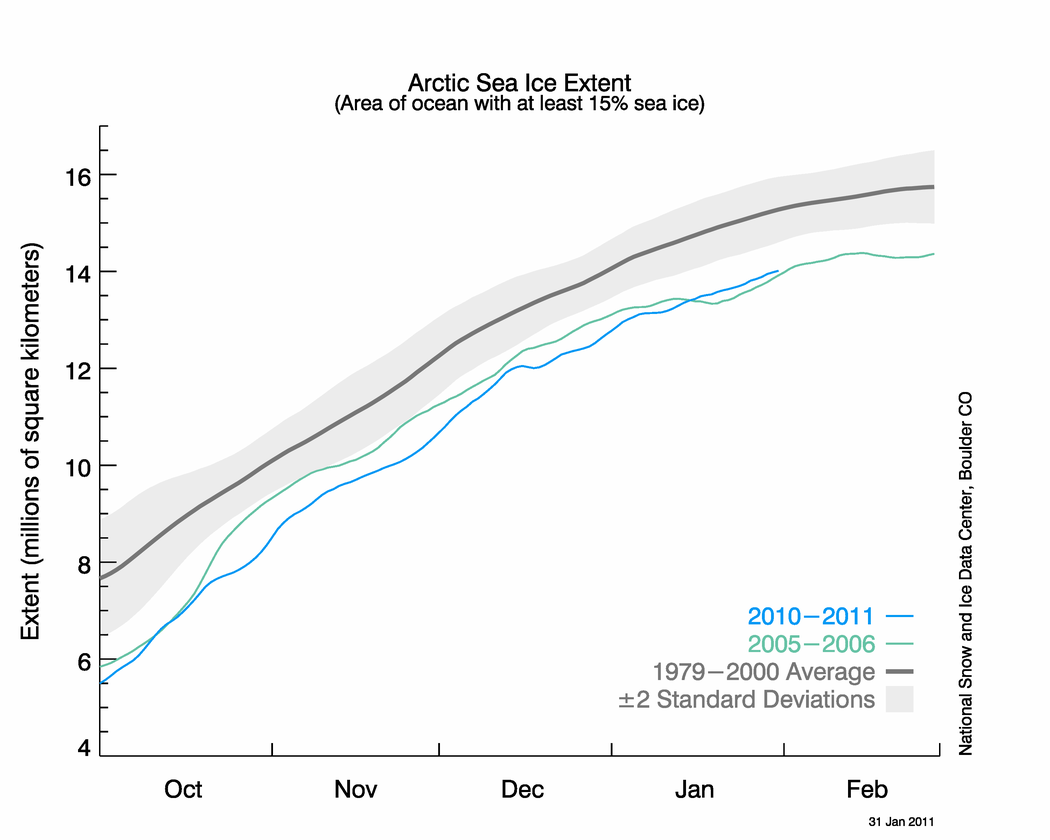 -- NSIDC sea ice news "Record low January extent"
You'll note that this year is more than 2 std devs below the average and playing tag with 2005-06 (the prior record low extent). The annual max occurs in March. There are websites where they bet on such things.
-- NSIDC sea ice news "Record low January extent"
You'll note that this year is more than 2 std devs below the average and playing tag with 2005-06 (the prior record low extent). The annual max occurs in March. There are websites where they bet on such things.
-
Bob Lacatena at 12:03 PM on 20 February 2011Skeptic arguments about cigarette smoke - sound familiar?
I think it's pretty obvious that a lack of smoking causes global warming. Think about it. People started to back away from smoking around the late seventies. When did the current warming trend appear to start? The only way to stop global warming is to push tobacco products (and to keep using fossil fuels). -
Albatross at 12:01 PM on 20 February 2011A Swift Kick in the Ice
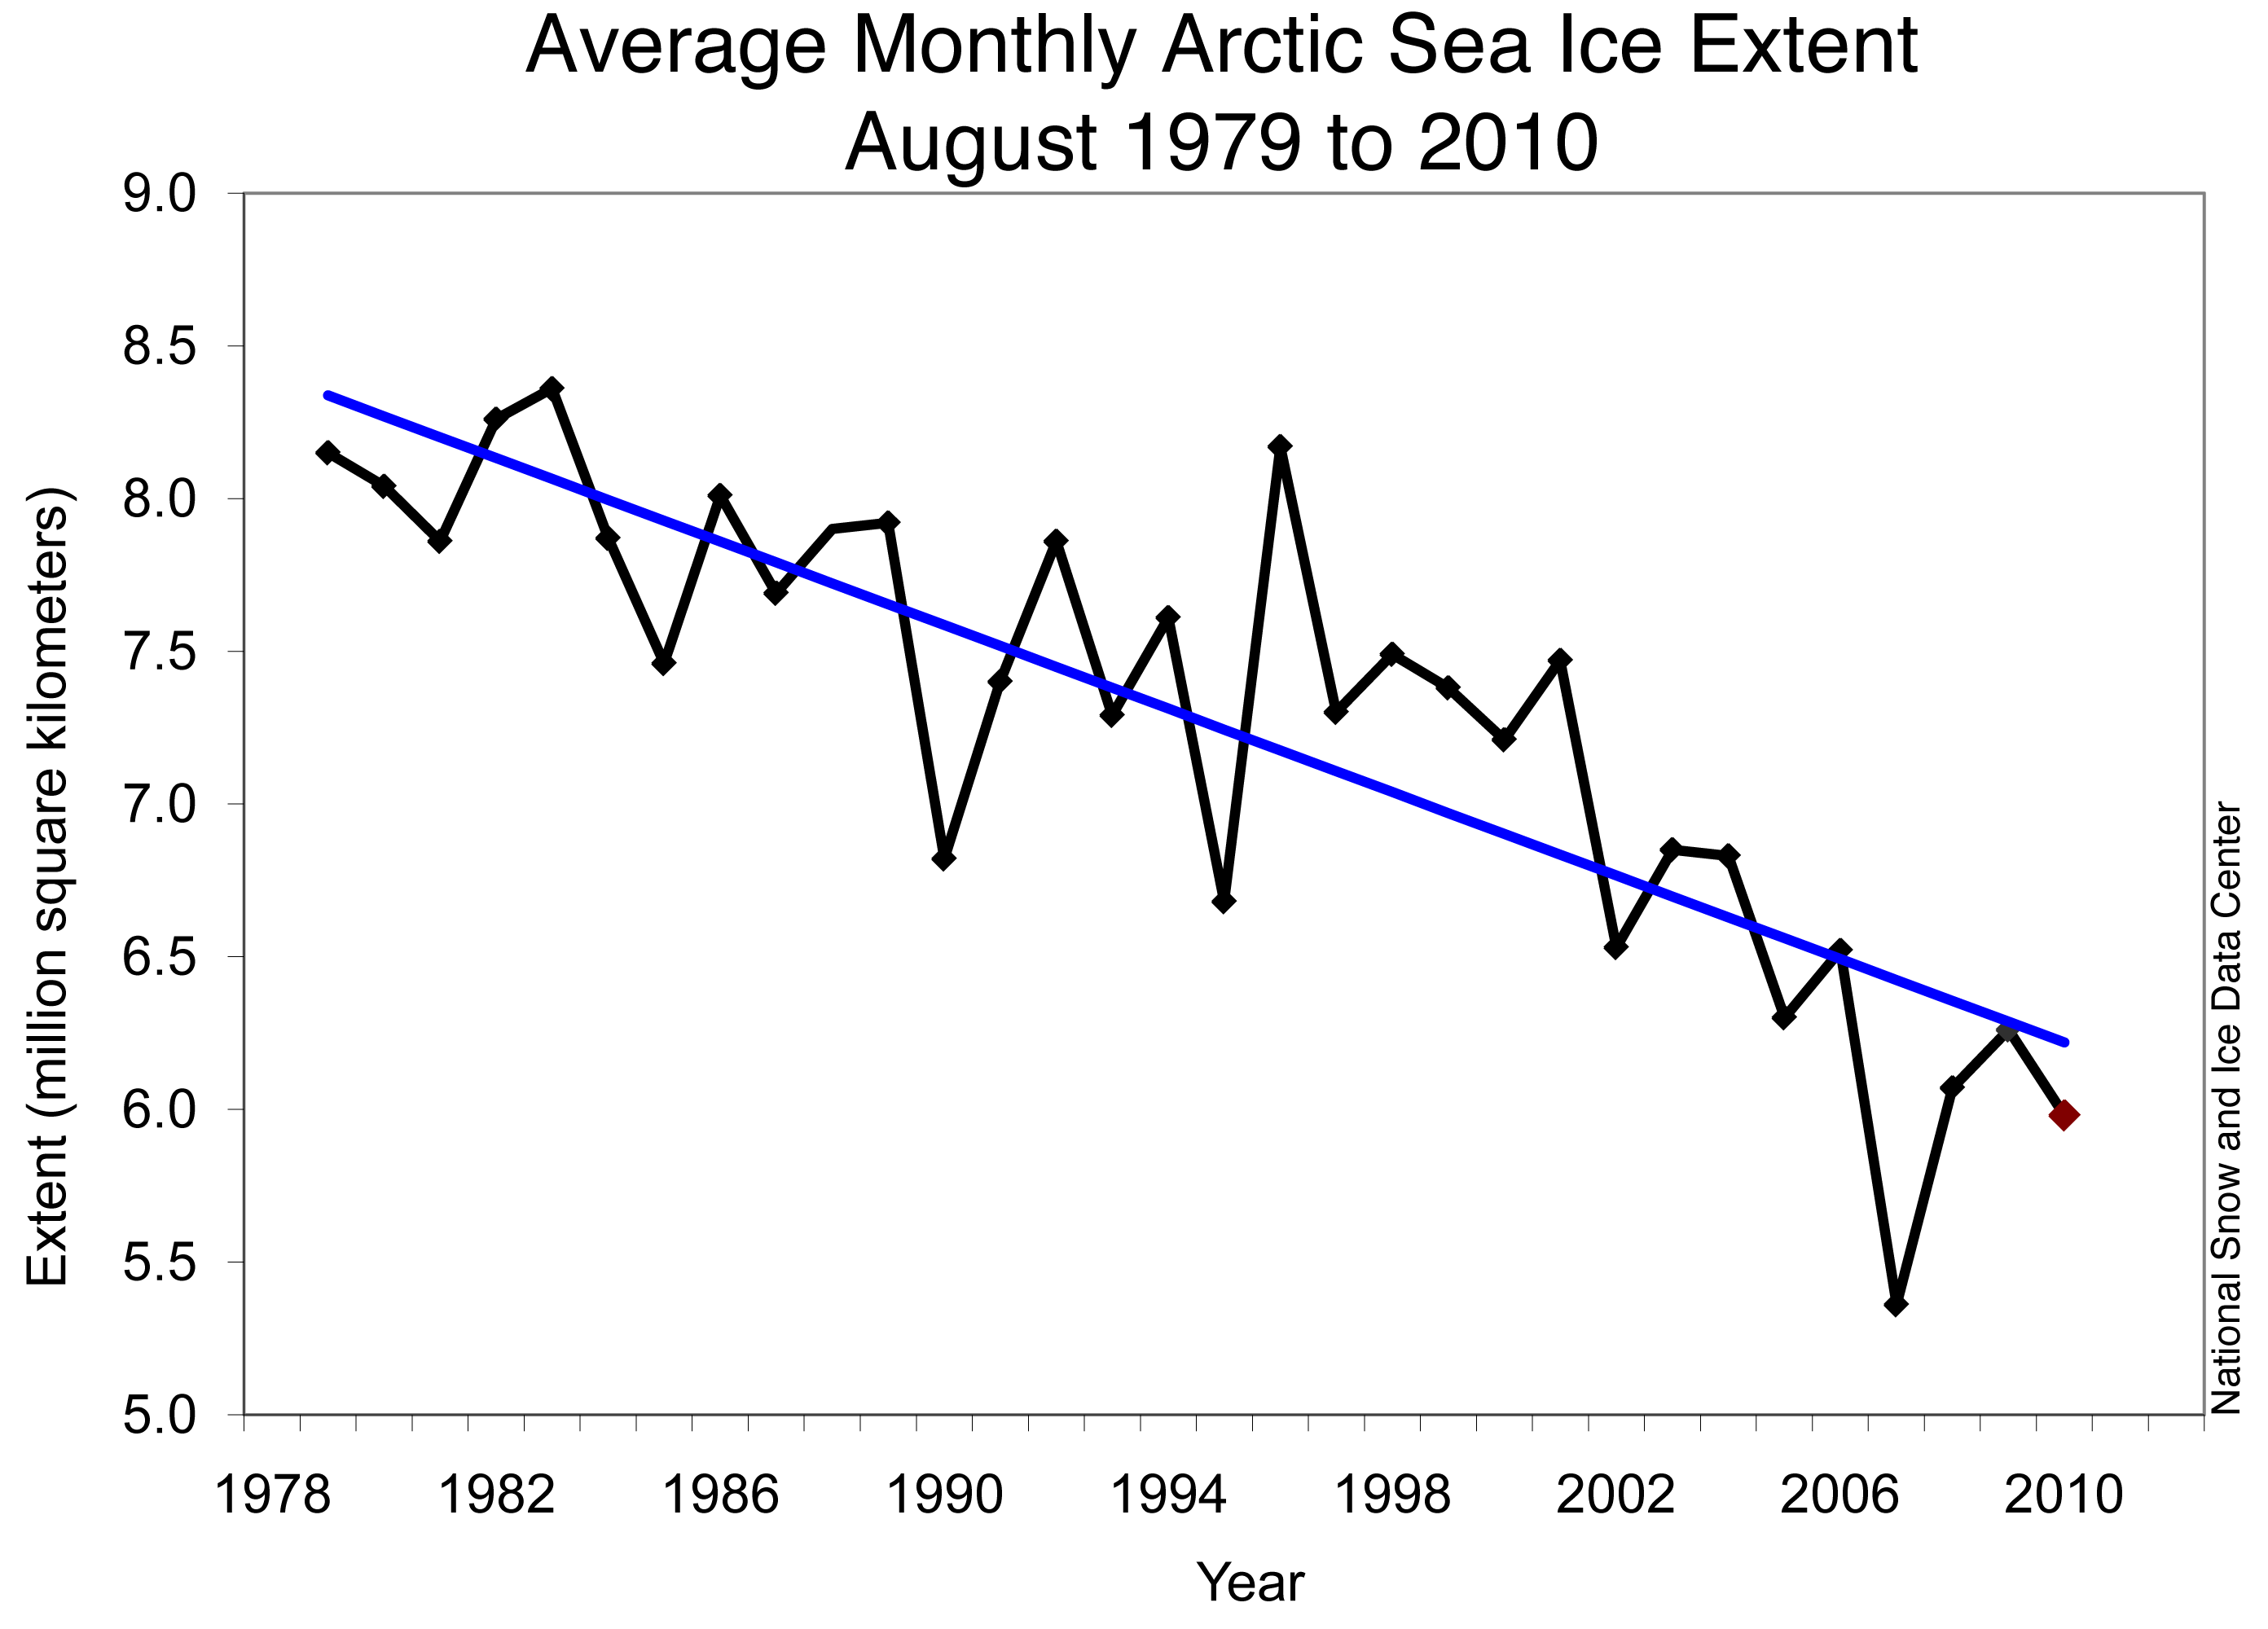
RW1 @68, Now you know very well, or should at least, that is is the long-term trends which count.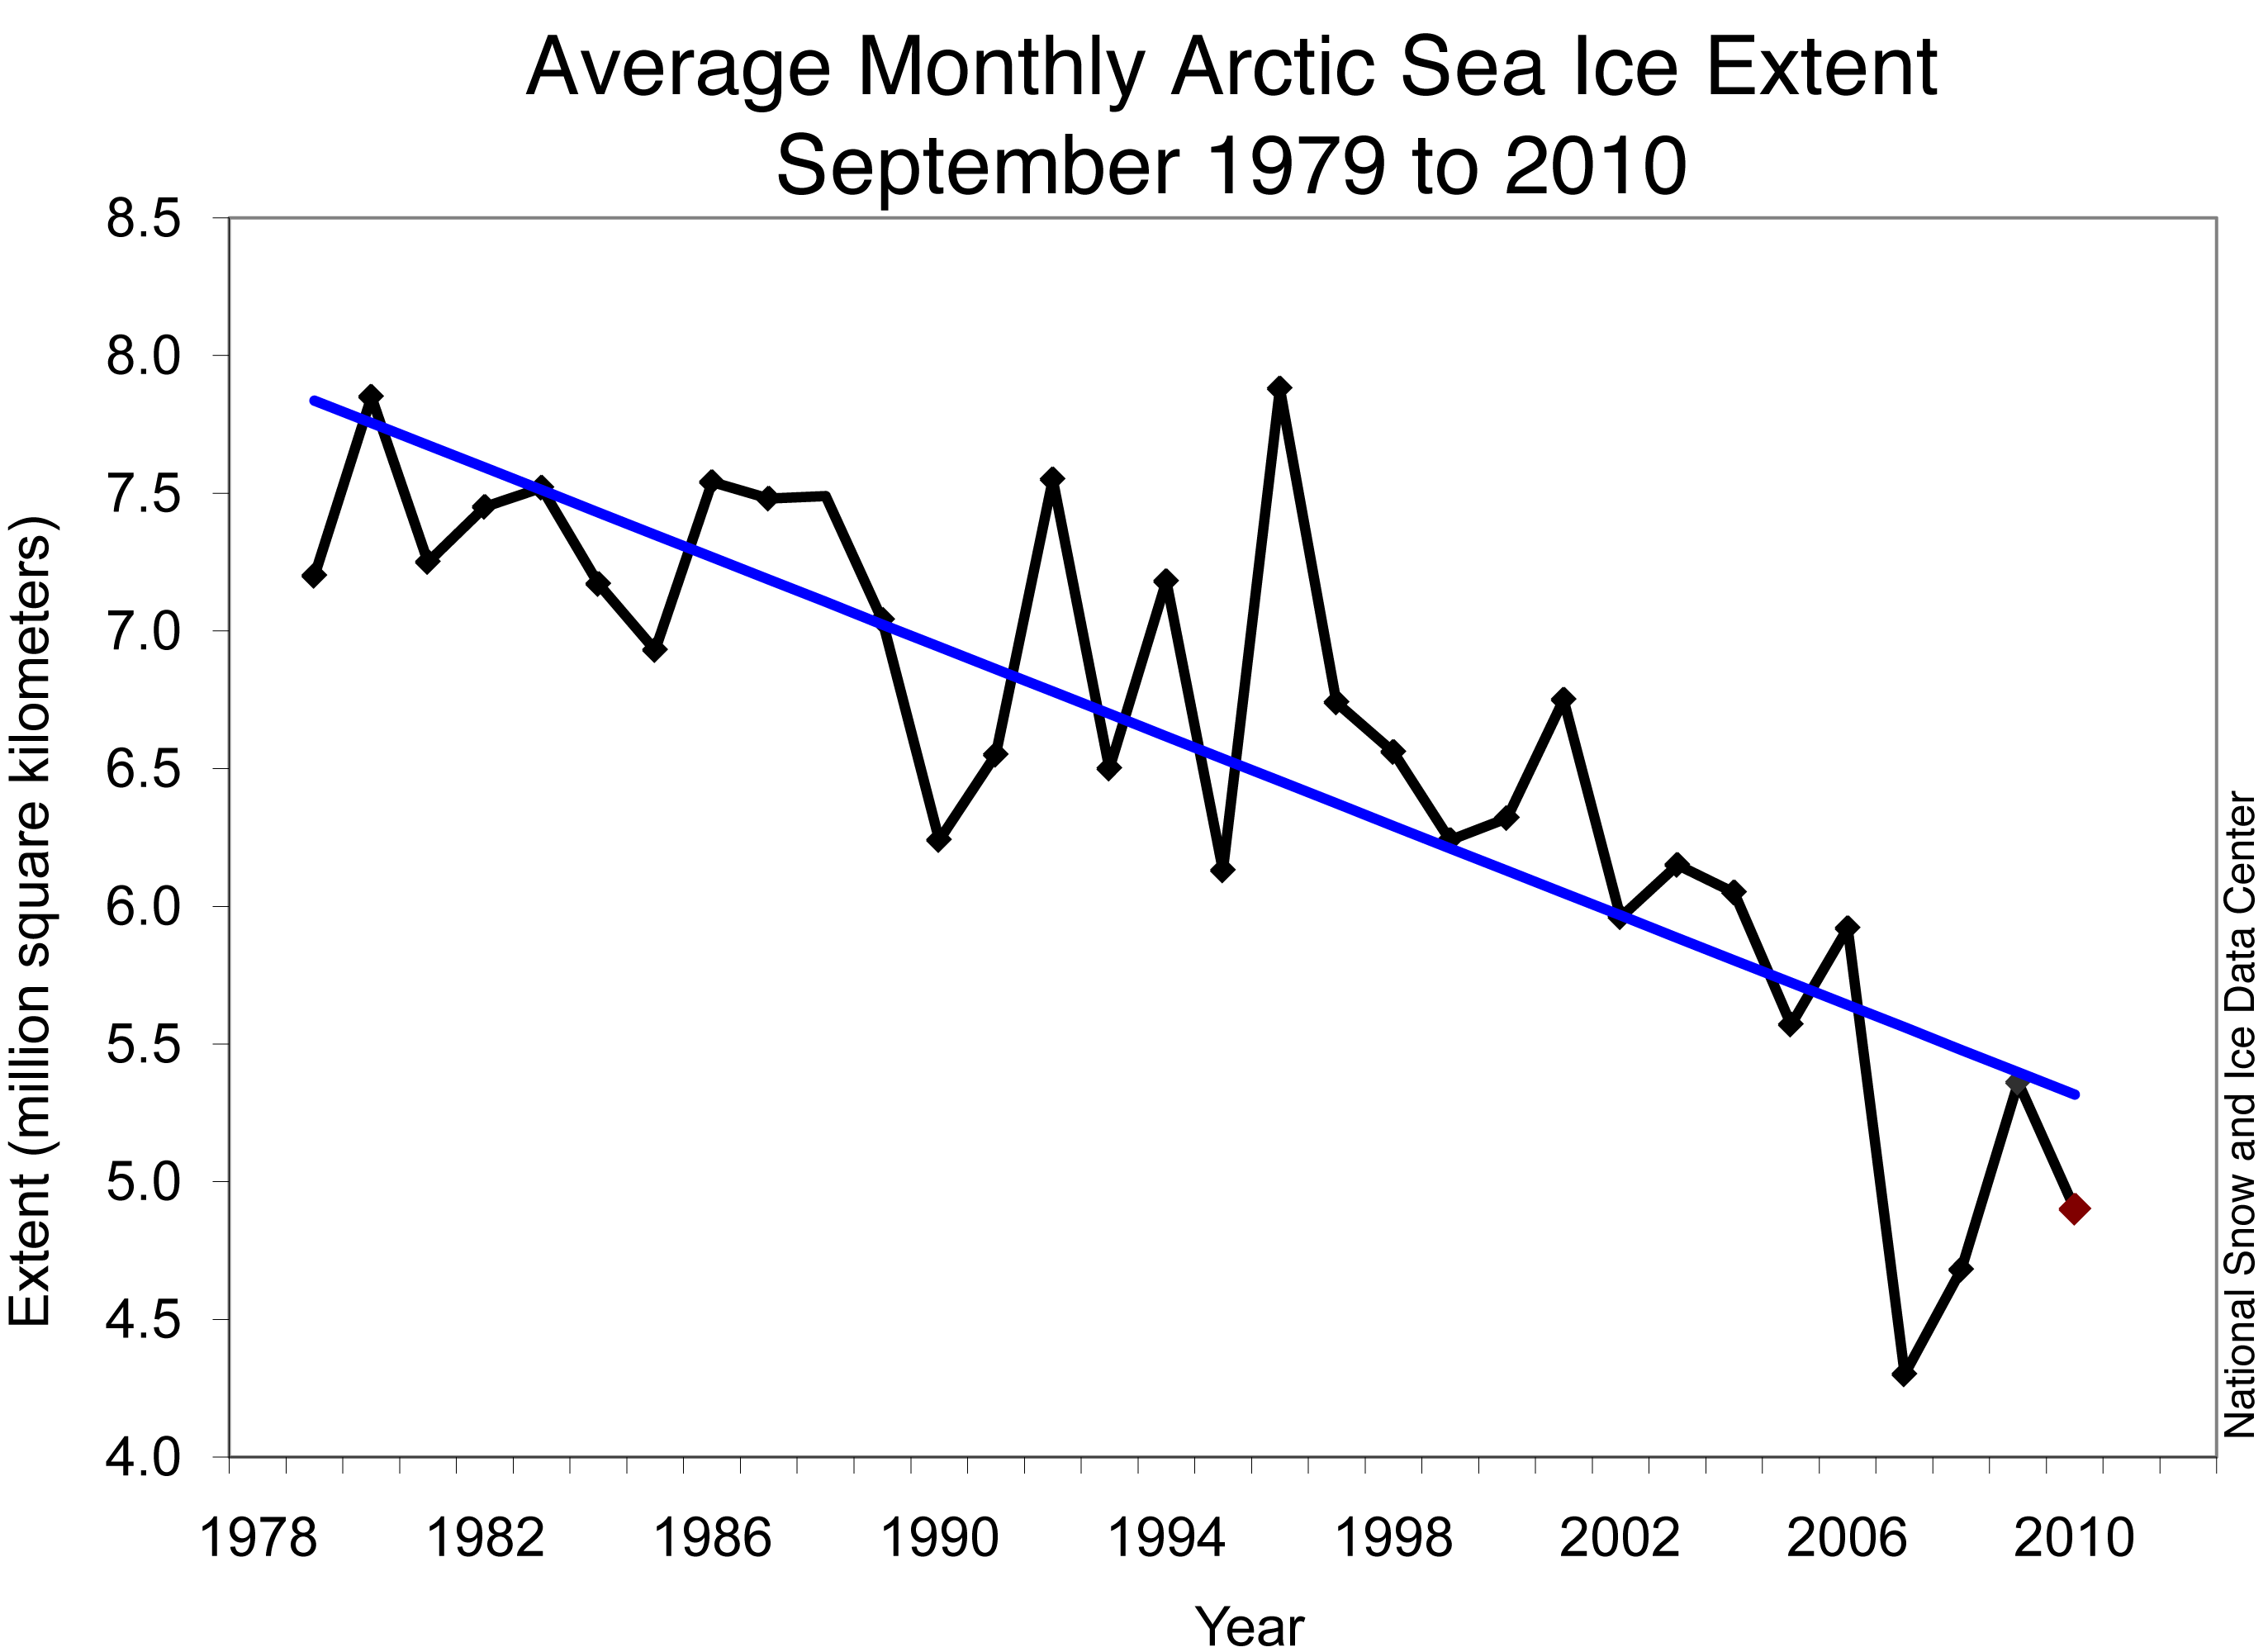 And the minimum in 2010 was the third lowest on record, not the fourth. And that the best fit to the data in the above graph is a quadratic not a linear model.
-
RW1 at 11:51 AM on 20 February 2011A Swift Kick in the Ice
muoncounter (RE: 64), "The trend of summer minima is down and accelerating." How can it be accelerating when the past 3 years have seen a larger summer minimum than the record low of 2007? -
RW1 at 11:47 AM on 20 February 2011A Swift Kick in the Ice
Tom, "but nor am I forgetting that the Earth is tilted on its axis, bringing much greater insolation to the poles in their respective summer season, both by increasing the angle of the incoming sunlight, and by increasing the length of the day." Even in the summer there is less and less insolation the closer you get to the pole. This was my initial point. -
michael sweet at 11:45 AM on 20 February 2011Skeptic arguments about cigarette smoke - sound familiar?
Climate skeptic Richard Lindzen has testified in court that the link between tobacco and cancer is not proven. -
RW1 at 11:40 AM on 20 February 2011A Swift Kick in the Ice
Tom (RE: 60), "@57, you appear to confused about which side of the argument you are on. You are arguing that high winter snowfall and ice formation will limit the summer melt, and hence the Ice albedo effect. But now your want to use a lack of correlation between winter ice extent and summer ice extent as proof that ice albedo effect is irrelevant." No, I'm simply using the lack of a clear correlation between winter ice and summer ice as an indication that a larger confluence of factors are contributing, especially since 2006 and 2007 were not particularly warm years, for example. -
Tom Curtis at 11:39 AM on 20 February 2011A Swift Kick in the Ice
RW1 @63, no, but nor am I forgetting that the Earth is tilted on its axis, bringing much greater insolation to the poles in their respective summer season, both by increasing the angle of the incoming sunlight, and by increasing the length of the day. Nor am I forgetting that even at the equator, the sun spends half the time out of the sky (it's called night), and a quarter of the time at low angles (its called morning and evening). The net effect of this, as clearly indicated by the charts, is that insolation across the tropics is near constant regardless of latitude averaged over the year, and that insolation withing the arctic circle is near constant regardless of latitude averaged over the year; but that between the Tropic of Cancer and the Arctic circle, insolation changes significantly for relatively small changes in latitude. -
johnd at 11:37 AM on 20 February 2011The Dai After Tomorrow
David Horton at 07:08 AM on 18 February, 2011, whilst the paper referenced, "Drought under global warming:" attempts to address global climate projections, I'm not sure how the projections in the paper for Australia, and by logical extension, Africa, India, Indonesia, all those countries bordering the Indian Ocean have been arrived at given the limited attention given to the cycles so far identified in the IO. Greater attention was paid to the Pacific ENSO cycles etc, the only mention of the IO was about "steady warming", put down to GHG global warming, with only one brief mention of decadal variations of SST in the IO. Nowhere was there any analysis of the IOD, despite it being identified over a decade ago, and much work having since been done which links the phases of the cycles to variations in the Australian climate. Prior to the identification of the IOD, researchers had found some correlation between droughts in Australia and the ENSO cycles finding reasonable correlation of droughts with El-Nino events, however when such findings were examined in reverse by others, only lower correlation of El-Nino events with droughts in Australia was found. It was only by incorporating the IOD into the calculations, that high correlation between drought events in Australia and events in both the IO and the Pacific were found. An extension of that was then finding the link between the various cycles that affect the other countries surrounding the IO, something that had been observed by some of the very early settlers in Australia, but only explained more recently. Given the significance of the IOD to the IO regional climate, I would have thought it would have been given as much attention as ENSO before any trends could be established or projected. I also note the early caveat in the paper, "Future efforts to predict drought will depend on models’ ability to predict tropical SSTs." At the moment this appears somewhat limited to perhaps one or two years out depending on the various models. Lastly, the statement "Regions like the United States have avoided prolonged droughts during the last 50 years due to natural climate variations, but might see persistent droughts in the next 20–50 years." seems to not rule out the possibility that perhaps despite all the projections, it will also be natural climate variations that might determine whether persistent drought over the next similar period of time occurs or not. All in all, given the repeated acknowledgement given to the difficulties predicting tropical SST variations on seasonal to decadal time scales, I am left with the impression that greater understanding of what might eventuate in the time scales projected is to be found in the historical perspective examined in the paper, rather than the modeling presented. The author virtually acknowledges this, stating, "Further advances in model developments may make it possible to predict drought on seasonal to decadal time scales." Whilst the OP claims the paper concludes on a somber note, I feel it concludes on an uncertain note by again noting the underlying deficiencies in the models used to make the projections presented. -
RW1 at 11:31 AM on 20 February 2011A Swift Kick in the Ice
Tom (RE: 62) "RW1 @59, what a revelation. Do you mean to say that in the summer of 1922 arctic sea ice had no more extent (ice free in some locations as far north as 81.5 degrees than it has in the winter of 2011:" I don't get it. At 81.5 degrees many locations were still iced over in the record low 2007 minimum, and all the areas at 81.5 degrees are iced over in the 2011 maximum you provide. -
muoncounter at 11:31 AM on 20 February 2011CO2 was higher in the past
Uncle Marc: Please take some time to get acquainted with SkS. See the newcomers guide, browse the 'Skeptic arguments.' There's a lot to learn; it will take some reading, but if you want to understand what's happening, it's well worthwhile. As far as the geocraft graph, see prior discussion starting with comment #6 on this thread, in which this graph gets debunked. -
muoncounter at 11:26 AM on 20 February 2011A Swift Kick in the Ice
RW1: "a much larger confluence of factors are determining how much ice melts or doesn't melt?" Into all of the accumulated threads on Arctic ice melt here on SkS (there are quite a few), you play the 'confluence of factors' card? Can you be any more specific? Offer some peer-reviewed science to back you up? "30 years isn't a very long period of time. The Artic climate is notoriously variable." We've posted the longer term reconstructions of Arctic ice on prior threads. The trend of summer minima is down and accelerating. Ice-free summers ... not too far off. You can find the graphics with 'Search'. "SEALS ARE FINDING THE WATER TOO HOT" Please. Quoting a single weather report from 1922 says nothing at all about climate and trends. -
RW1 at 11:12 AM on 20 February 2011A Swift Kick in the Ice
Tom (RE: 60), "RW1 @56, and you were wrong about the average as I clearly indicated. As the second graph shows, there is little variation in Top Of Atmosphere annual average insolation north of about 60 degrees latitude. Insolation at the surface is more complicated because of cloud cover, but as the third graph shows, there is again little variation over sea north of about 60 degrees, with an exception north of Europe." Are you forgetting that the Earth is sphere and as you get closer and closer to the poles the angle increases, resulting in less and less insolation? -
Tom Curtis at 11:11 AM on 20 February 2011A Swift Kick in the Ice
RW1 @59, what a revelation. Do you mean to say that in the summer of 1922 arctic sea ice had no more extent (ice free in some locations as far north as 81.5 degrees than it has in the winter of 2011: Well that certainly puts a whole new perspective on things!
-
Albatross at 10:56 AM on 20 February 2011A Swift Kick in the Ice
Nice try RW1 @59. Really, this silly argument that "it has happened before" is a ridiculous red herring used to confuse and mislead lay people. Of course scientists know very well that conditions warmed between 1910 and 1940-- no-one in the know is denying that. However, the rate of warming then not as great as in recent times. Also, that was a transient event, what we are in store is going to last much longer. Anyway, this has all been refuted before, b/c this Monckton Myth #12 that you floated has been soundly refuted here. -
Tom Curtis at 10:51 AM on 20 February 2011A Swift Kick in the Ice
RW1 @56, and you were wrong about the average as I clearly indicated. As the second graph shows, there is little variation in Top Of Atmosphere annual average insolation north of about 60 degrees latitude. Insolation at the surface is more complicated because of cloud cover, but as the third graph shows, there is again little variation over sea north of about 60 degrees, with an exception north of Europe. @57, you appear to confused about which side of the argument you are on. You are arguing that high winter snowfall and ice formation will limit the summer melt, and hence the Ice albedo effect. But now your want to use a lack of correlation between winter ice extent and summer ice extent as proof that ice albedo effect is irrelevant. In fact, the proof of its relevance is given in my immediately preceding post where I point out the correlation between minimum summer ice extent and springtime temperatures. For a large initial (springtime melt) to reliably reproduce large summer reductions in ice volume independent of the summer temperature suggests a strong feed back mechanism in which early ice melts drive later ice melts. -
UncleMarc at 10:48 AM on 20 February 2011CO2 was higher in the past
I've seen this graphic come up a few times to refute this argument and similar ones. Here's the original source: http://www.geocraft.com/WVFossils/Carboniferous_climate.html The page's author, Monte Hieb, is listed at the bottom. Poking around a little more on Google will give you a sense of his paleoclimate qualifications. -
RW1 at 10:40 AM on 20 February 2011A Swift Kick in the Ice
Rob (RE: 54) "No one claims that the trend is going to be a steady decline. You get year to year noise in the data, as expected. If you look at the annual sea ice extent you'll notice that it only rebounded to the long term declining trend line." 30 years isn't a very long period of time. The Artic climate is notoriously variable. Consider this report from the US Weather Bureau: "THE ARCTIC OCEAN IS WARMING UP, ICEBERGS ARE GROWING SCARCER AND IN SOME PLACES THE SEALS ARE FINDING THE WATER TOO HOT. REPORTS ALL POINT TO A RADICAL CHANGE IN CLIMATE CONDITIONS AND HITHERTO UNHEARD-OF TEMPERATURES IN THE ARCTIC ZONE. EXPEDITIONS REPORT THAT SCARCELY ANY ICE HAS BEEN MET WITH AS FAR NORTH AS 81 DEGREES 29 MINUTES. GREAT MASSES OF ICE HAVE BEEN REPLACED BY MORAINES OF EARTH AND STONES, WHILE AT MANY POINTS WELL KNOWN GLACIERS HAVE ENTIRELY DISAPPEARED." The problem is this is from 1922! -
Tom Curtis at 10:36 AM on 20 February 2011A Swift Kick in the Ice
RW1 @52: Seeing you are discussing ice melt, you should be discussing Ice Volume rather than Ice Extent: Large reductions in ice volume correlate very well with elevated arctic spring time temperatures, so temperature is the determinant of arctic ice melt. Wind strength and speed, along with the extent of multiyear (thick) ice are additional factors determining ice extent.
Of course, no body has claimed that the greenhouse effect or the ice albedo feedback are the sole determinants of global temperatures, let alone regional temperatures, which can vary based on a large number of factors, the most important of which regionally is the direction of prevailing winds.
So you can put that strawman firmly back in the basket.
Large reductions in ice volume correlate very well with elevated arctic spring time temperatures, so temperature is the determinant of arctic ice melt. Wind strength and speed, along with the extent of multiyear (thick) ice are additional factors determining ice extent.
Of course, no body has claimed that the greenhouse effect or the ice albedo feedback are the sole determinants of global temperatures, let alone regional temperatures, which can vary based on a large number of factors, the most important of which regionally is the direction of prevailing winds.
So you can put that strawman firmly back in the basket.
-
RW1 at 10:30 AM on 20 February 2011A Swift Kick in the Ice
Tom (RE: 55) "There will be less and less ice to melt, but as you point out, in winter that ice (and snow) comes back. Therefore the albedo can keep on decreasing as a result of earlier snow/ice melts and later snow falls and ice formation." Then explain why the winter maximum doesn't seem to be any indication of what the summer minimum will be? For example, why was the winter maximum less in 2006 than in 2007 yet the summer minimum was greater in 2006 than it was in 2007? -
Andy Skuce at 10:24 AM on 20 February 2011Skeptic arguments about cigarette smoke - sound familiar?
I might add another argument in favour of smoking:8. Smoking suppresses your appetite and helps keep you thin. We hear all the time about how obesity is nowadays the worlds worst public health problem, yet the fat alarmists never tell us how many lives are saved by tobacco keeping us trim.
Similar in some ways to the argument that cold kills more than seven times as many as heat does. I'm not sure if that particular argument has been rebutted here or not. Perhaps this: Heat stress: setting an upper limit on what we can adapt to -
cce at 10:20 AM on 20 February 2011Skeptic arguments about cigarette smoke - sound familiar?
Just read RJR CEO Colin Stokes' letter introducing Frederick Seitz as the head of the tobacco industry's medical research program. See if any of Stokes' arguments sound familier. http://legacy.library.ucsf.edu/tid/hzb66b00/pdf -
RW1 at 10:20 AM on 20 February 2011A Swift Kick in the Ice
Tom, "However you are simply wrong about the insolation at the North Pole. At the height of summer, insolation at the north pole is at least 37.5% greater than that at the equator, and remains so for at least a month:" I meant lower average. -
Tom Curtis at 10:05 AM on 20 February 2011A Swift Kick in the Ice
RW1 @46: "Not really. There becomes less and less ice to melt, and you'll never melt it all because half of the year the Artic is dark and the ice grows back. Also, as more ice melts, you get closer and closer to North Pole, which means lower and lower insolation." 1) There will be less and less ice to melt, but as you point out, in winter that ice (and snow) comes back. Therefore the albedo can keep on decreasing as a result of earlier snow/ice melts and later snow falls and ice formation. 2) However you are simply wrong about the insolation at the North Pole. At the height of summer, insolation at the north pole is at least 37.5% greater than that at the equator, and remains so for at least a month: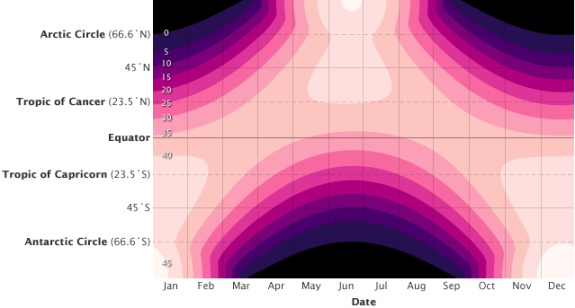 What is more, because of the structure of solar insolation, even the annual average is more or less constant above the arctic circle:
 So, what you are doing here is invoking speculations and errors of fact to refute empirical observations because in this instance you happen to prefer the model results. Your hoped for reduction of the effect will probably occur, but only once ice formation and snowfall are confined to those months and areas with no insolation, but by then the increased global warming due to the arctic sea ice albedo feedback will be an irreversible fact.
-
Rob Honeycutt at 09:53 AM on 20 February 2011A Swift Kick in the Ice
RW1... "Then why was the summer minimum in 2008 over 16% larger than the record low the previous year in 2007" No one claims that the trend is going to be a steady decline. You get year to year noise in the data, as expected. If you look at the annual sea ice extent you'll notice that it only rebounded to the long term declining trend line. -
Tom Curtis at 09:41 AM on 20 February 2011A Swift Kick in the Ice
Time for a dog pile ;) Norman, choice of the base line makes no difference to the relative anomaly. By choosing the last ten years for the baseline, you may make the current anomalies look small, but you have done so by making the negative anomalies for earlier in the century much larger. They, of course, don't show up on your map. But we could do the reverse, say, choosing 1900 to 1910 with equal legitimacy. -
RW1 at 09:11 AM on 20 February 2011A Swift Kick in the Ice
muoncounter (RE: 51), "So the time duration for your cooling-due-to-increased-albedo is shrinking." Then why was the summer minimum in 2008 over 16% larger than the record low the previous year in 2007, for example? What caused it to grow back (or melt less) just the next year and subsequent years after? How is this behavior consistent with positive feedback? Furthermore, why don't the smaller summer minimums in the Artic correlate with years where average global temperatures are generally higher and vice versa? If global warming is what is causing Artic sea ice melt and will cause more in the future, shouldn't this be the case? Or maybe a much larger confluence of factors are determining how much ice melts or doesn't melt? Also, what about the uncorrelated minimum trends in the Antarctic? What's your explanation for those? "And isn't that increased snowfall occurring in the winter, when Arctic albedo is irrelevant because there's little or no daylight?" Yes, but more snow can persist longer as the days and weeks move into the Spring - keeping temperatures colder, and thus reducing the overall amount of melting that occurs at summer minimum. -
muoncounter at 09:02 AM on 20 February 2011Skeptic arguments about cigarette smoke - sound familiar?
Nice post. It's especially relevant as the same people who put together the defense of cigarette smoking are working hard against the science of AGW. Here's one more: If everyone stopped smoking, it would put all those tobacco farmers out of work and that would harm the economy; that shows up at Economic impacts of carbon pricing. -
Rob Honeycutt at 08:04 AM on 20 February 2011Meet The Denominator
Alex... Great stuff. And well put. Just ordered a copy of the book. Their definition is interesting. It seems like it would eliminate most paleoclimate reconstructions that we rely on to understand climate today. But I'll check out the book. -
David Horton at 07:58 AM on 20 February 2011Skeptic arguments about cigarette smoke - sound familiar?
Good work Mac. A small point - "Actually fire and smoke is necessary for some plants and seeds to grow in parts of Australia" - isn't true. It would be more accurate to say that "the growth and germination of many plants all over the world can be enhanced by smoke sometimes". This smoke thing isn't an adaptation of Australian plants, isn't an adaptation to fire, and isn't related to smoke from burning Australian vegetation. Your point is still valid (smoke, like CO2, is "good for plants") though. -
Garbfonkel at 07:47 AM on 20 February 2011Skeptic arguments about cigarette smoke - sound familiar?
Oh, I sure recognize the first argument about cigarette smoke. I've heard it a lot of times. Great comparison between the arguments! -
Alex Poole at 06:46 AM on 20 February 2011Meet The Denominator
Here's the most conservative estimate for the denominator that I could find. It comes from The Atlas of Climate Change. I've scanned in a part of it here. Using the term 'climate change', they searched the database at Web of Science and found 17,761 papers published between 1971 and 2005. Bearing in mind that they define Climate change thus (my emphasis):
'A statistically significant variation in either the mean state of the climate or in its variability, persisting for an extended period (typically decades or longer). Climate change may be due to natural internal processes or external radiative forcing, or to persistent anthropogenic changes in the composition of the atmosphere or in land use. The UNFCCC, in its Article 1, defines it as: "a change of climate which is attributed directly or indirectly to human activity that alters the composition of the global atmosphere and which is in addition to natural climate variability observed over comparable time periods." This Atlas generally follows the UNFCCC's distinction between "climate change" attributable to human activities altering the atmospheric composition, and "climate variability" attributable to natural causes. Although often used to mean climate change, global warming is only one aspect of this - the increase in global mean temperature.'
850 papers is 4.8% of 17,761, making it very close to KR's estimate at comment 238.
Bearing in mind that they define Climate change thus (my emphasis):
'A statistically significant variation in either the mean state of the climate or in its variability, persisting for an extended period (typically decades or longer). Climate change may be due to natural internal processes or external radiative forcing, or to persistent anthropogenic changes in the composition of the atmosphere or in land use. The UNFCCC, in its Article 1, defines it as: "a change of climate which is attributed directly or indirectly to human activity that alters the composition of the global atmosphere and which is in addition to natural climate variability observed over comparable time periods." This Atlas generally follows the UNFCCC's distinction between "climate change" attributable to human activities altering the atmospheric composition, and "climate variability" attributable to natural causes. Although often used to mean climate change, global warming is only one aspect of this - the increase in global mean temperature.'
850 papers is 4.8% of 17,761, making it very close to KR's estimate at comment 238.
-
Alex Poole at 06:41 AM on 20 February 2011Meet The Denominator
I've been moved to post on this site for the first time due to the utterly depressing nature of this thread. Poptech - I'd never heard of you before this, and I wish you no ill will, but after 600+ comments you've come across as someone who's much more interested in arguing rhetorical points for the sake of it, rather than investing time in learning about climate science. Your debating style reminds me of an evasive politician, and as such you lose a significant amount of credibility. As for the rest of you commenting here, you're all understandably exasperated with this, but it's made you lose your cool many times, which also diminishes your credibility. Please find some way to avoid this kind of situation in the future, because it damages the reputation of this otherwise useful resource. -
muoncounter at 06:13 AM on 20 February 2011A Swift Kick in the Ice
RW1: "as more ice melts, you get closer and closer to North Pole, which means lower and lower insolation." Warm water seems to melt ice quite well. From a study quoted in Science Daily 28 Jan 2011: ... the rapid warming of the Arctic and recent decrease in Arctic sea ice extent are tied to the enhanced heat transfer from the North Atlantic Ocean, ... "Such a warming of the Atlantic water in the Fram Strait is significantly different from all climate variations in the last 2,000 years," "Furthermore, increasing temperatures can lead to increases in evaporation, which can lead to increasing snow accumulations, which in turn increase the earth's surface albedo and have a cooling effect, which in turn can cause more ice to grow back." Wishful thinking, RW1? Countered by Markus et al 2009, who find that warming temperatures are pushing the melt onset date earlier and the freeze onset later. For the entire Arctic, the melt season length has increased by about 20 days over the last 30 years. Largest trends of over 10 days/decade are seen for Hudson Bay, the East Greenland Sea, the Laptev/East Siberian seas, and the Chukchi/Beaufort seas. Those trends are statistically significant at the 99% level. So the time duration for your cooling-due-to-increased-albedo is shrinking. And isn't that increased snowfall occurring in the winter, when Arctic albedo is irrelevant because there's little or no daylight? -
muoncounter at 05:44 AM on 20 February 2011Global warming stopped in
1998,1995,2002,2007,2010, ????
Continued from comment here by Norman. "The interesting thing about the GISS anomaly map above is the choise of base=line (1951-1980). This was a relatively cooler period of time and to use that to show Arctic warming may distort what has recently been going on. I went to the GISS page ... GISS Arctic temp map using 2000-2010 as the baseline. " A baseline needs to be a long time period -- its supposed to represent an average condition, so that anomalies are relative to that average. Your 10 year baseline doesn't accomplish that. It is interesting to choose an historically relevant baseline and look at the relative anomalies. Prior to 1946, carbon emissions were increasing at a steady rate; however, after WW2, carbon emission rates exploded. So much so that the cumulative CO2 emissions from fossil fuels after WW2 virtually eclipses all CO2 emissions in the prior 150+ years (you can verify this with data and graphics readily available at CDIAC). So 1900-1946 is a relevant baseline period. Here is the anomaly for 1970-1980. Here is the 1980-1990 anomaly.
 Fast forward, here is the 2000-2010 anomaly.
 Look at the numbers in the upper right hand corner, which are the estimated global means for the period mapped. It's obvious that warming rates dramatically increased in the '80s, nearly 4 decades after the rapid increase in CO2 emissions began. Considering that it takes time for the warming effect of CO2 to be fully realized (see the 40 year delay thread) that result is not surprising.
Moderator Response: [DB] Your images aren't showing up anymore (and the links don't work so I no canna fix 'em). [mc] Aargh - should work now.
Look at the numbers in the upper right hand corner, which are the estimated global means for the period mapped. It's obvious that warming rates dramatically increased in the '80s, nearly 4 decades after the rapid increase in CO2 emissions began. Considering that it takes time for the warming effect of CO2 to be fully realized (see the 40 year delay thread) that result is not surprising.
Moderator Response: [DB] Your images aren't showing up anymore (and the links don't work so I no canna fix 'em). [mc] Aargh - should work now. -
sidd at 05:40 AM on 20 February 2011Deep ocean warming solves the sea level puzzle
Concur with zinfan94, I too calculate the same heat flux into the deep (deeper than 700m) ocean as the upper (less than 700m deep) ocean. I also find interesting the phase shift between the model and the data, which only has some small discussion on page 9. sidd -
Rob Honeycutt at 05:36 AM on 20 February 2011A Swift Kick in the Ice
Norman... Remember, we're trying to look at climate, not weather. Your choice of the most recent 10 years as a base line is wrong on many levels. 1) It's not statistically significant (too few years). 2) Comparing the past year to the most recent decade tells you absolutely nothing. Stick with a 30 year baseline. -
Albatross at 05:00 AM on 20 February 2011Deep ocean warming solves the sea level puzzle
Thanks for the feedback Zinfan, I am pretty busy right now, which means that I cannot devote as much time to this as I would like. Yes, it will be interesting to hear Trenberth's thoughts on this, and I'd be curious to know what Pielke Snr's and other contrarians' spin will be on this. Ari, I realise they do not have any new observational data for the deep ocean, but surely their model calculates deep water temperatures, b/c they do calculate the contribution from the deep water to the SSL? Then again, a closer read of zinfan's post suggests that the deep water contribution to SSL was determined as a residual.... Anyways, if zinfan's maths is correct then this paper is very exciting indeed, at least in terms of trying to close the planetary energy budget.Moderator Response: (DB) My first read-through yielded the same interpretation as Zinfan. -
zinfan94 at 04:33 AM on 20 February 2011Deep ocean warming solves the sea level puzzle
Albatross #8 Ari Jokimaki #9 and Ken Lambert #10 I read the paper last night, and found it very interesting. They used gridded satellite altimeter data for sea level and compared this to gridded ocean bottom pressure (OBP) from GRACE. They then took the upper level (700m) ocean heat content (OHC) info from XBT/ARGO and translated that into a steric sea level (SSL) contribution. The contribution of eustatic rise from ice sheet and glacier melt is removed, leaving the SSL contribution from the deep ocean heating in each particular grid cell. In these two paragraphs from the paper, they explain the deductive reasoning: [30] So far, we have mostly assessed the upper ocean (0–700 m) data, satellite SSH and OBP data, and compared them with the model. In this section we focus our attention on the deep ocean. Figure 12 shows the model deep ocean SSL below 700 m. Note that the seasonal variability in the deep ocean SSL is rather weak, particularly for the annual amplitude. This is consistent with the previous data assessment, suggesting that deep oceans contribute very little to the seasonal variability of the sea level. However, the story is different for the regional trends. The model suggests a significant deep ocean warming trend, particularly in the North Atlantic and along the Antarctic Circumpolar Current (ACC). The warming features appear closely related to the oceanic circulation and dynamics. As such they may provide an explanation as to why altimetry SLR cannot be adequately explained by the sum of upper ocean (0–700 m) SSL and ocean mass change calculated from GRACE (discussed in section 3). [31] In order to verify a possible hypothesis that connects the deep ocean warming to the missing part of the sea level budget closure, the following two conditions should be fulfilled: (1) The model deep ocean warming should be consistent with available bottom water measurements, and (2) its combination with the in situ upper ocean SSL and GRACE data should explain the altimetry SLR in both global mean and regional trends. In the following we discuss these two conditions in more detail. They estimate that eep ocean heating contributes about 1.1 mm of the observed 3.1 mm per year of sea level rise (SLR). The paper also shows significant regional deep ocean warming variation, with the Southern Ocean and portions of the Atlantic warming much faster. The authors compare the regional results with other studies and discuss many similarities and a few discrepancies. Although not discussed in the paper, this amount of SLR should translate into the deep ocean acting as a heat sink with a rough estimate that the deep ocean is taking as much as 70 x 10^20 J per year of the planetary energy imbalance, roughly the same as the upper 700m level. In essence, this would close the planetary energy budget, and confirm the planet is heating about 0.9 W per square meter, the estimated top of atmosphere (TOA) imbalance from AGW models (and roughly confirmed by measurements of outgoing longwave radiation). Dr. Trenberth has published extensively on the planetary energy imbalance, and it will be interesting to hear his views on the Song and Colberg results. This paper may go a long way in helping resolve the famous “Trenberth Travesty”. -
muoncounter at 03:46 AM on 20 February 2011A Swift Kick in the Ice
Norman: Don't you think a comparison of what happened last month to what happened in the last 10 years has a major sample bias issue? Like comparing what happened yesterday with what happened last week? For further discussion of recent surface temperatures, go to Global warming stopped in ... -
Ari Jokimäki at 03:32 AM on 20 February 2011Deep ocean warming solves the sea level puzzle
This new paper or Purkey & Johnson do not depend on the 0,64 W/sq.m figure. It's just used in Purkey & Johnson to compare their result. This new paper doesn't seem to use it in any way. -
Norman at 03:21 AM on 20 February 2011A Swift Kick in the Ice
The interesting thing about the GISS anomaly map above is the choise of base=line (1951-1980). This was a relatively cooler period of time and to use that to show Arctic warming may distort what has recently been going on. I went to the GISS page (At this time I do not know how to paste a map on a post so I can only send a link) and put in this last decade for the baseline. The Global temp for January is lower than the last decade and the Arctic warming does not look too severe except around Greenland. Going to the Arctic sea ice page this is explaine by a negative Arctic Oscillation: Quote from the page "Arctic sea ice extent for January 2011 was the lowest in the satellite record for that month. The Arctic oscillation persisted in its strong negative phase for most of the month, keeping ice extent low." The negative phase kept parts of the Arctic warmer but created much colder weather in other areas as this cold air was able to move much further south. GISS Arctic temp map using 2000-2010 as the baseline. -
ranyl at 02:36 AM on 20 February 2011A Swift Kick in the Ice
As someone else has eluded to, for the last 4 years the arcitc sea ice level has been well below 2SD deviations from the 1979-2000 mean. This means all things being natural variation that there has been a 1:100 year at least event in the arctic every summer for the last 4 which would be a rarity I'd of thought. It is most likely from sea ice extent estimates and arctic temperature reconstructions that the arctic hasn't had this little ice in the summer and this high a temperatures since the thermal maximum if not longer and the trend for temeprature change in keeping with the Northern hemisphere insolation averages was for a slow cooling until 100ppm of CO2 was dumped into the atmosphere in a very short period, when the arctic temperature suddenly started to rise again. The arctic really should be cooling all things natural! Due to natural variation 2010 should have been on the cold side, unless of course the recent paper in nature saying the solar max and heat in put min. is correct. However if it is correct then there is no accounting for the LIA cooling other than the very slight drop in CO2 at the that time, which would mean CS to CO2 is very significant, so lets maintain that low sunspot activity means lower general earth temperatures, thus the none activity from 2008-2010 should have been a signifcant cooling effect of about 0.1-0.15C from the mean, La Nina (which was strong) and El-Nino (which wasn't strong in early 2010 until May) somewhat cancle each other out but still overall a cooling effect! Do wonder if the earth has slipped into a new phase with a higher median temperature with 2010 representing a low year in the natural variance? Would be in keeping with chaos for the climate to start to do jumps or leaps from one phase of being to the next. Anyway it is more likely that despite being much warmer in the pliocene and previous inter-glacials that the arctic ocean was still only free of ice in the summer. Virtually ice free summers do seem inevitable by 2050 at the latest, this is sobering stuff, for it will accelerate warming locally as water will warm up alot more than it did basking in the long summer sun and will release this heat in the Autumn. Lots of amplification potential and less latent heat exchanges which mean the artic winter to summer temperature differential will be amplified. Interesting times, new weather patterns to emerge, extreme events to witness and new arctic tourist industry to set up. Swim with the, ?who knows? Lets face it CO2 emissions aren't seriously going down any time soon so what were does leave us? -
neilrieck at 02:28 AM on 20 February 2011Climate Models: Learning From History Rather Than Repeating It
Way back in December 2006 I attended a lecture on "climate change" at the Perimeter Institute for Theoretical Physics where the presented stated that "all climate models predict warming" and only differ on the point of no return. I just stumbled onto this lecture which can be viewed by clicking the following link: From here to eternity: Global Warming in Geologic Time -
angusmac at 02:28 AM on 20 February 2011Monckton Myth #13: The Magical IPCC
The MWP is is alive and well and it is shown in AR4. Northern hemisphere temperature variations from AR4 Figure 6.10c are shown below. I have deleted the instrumental temperature from HadCRUT2v data so that only proxy records are compared. Note that there is a distinct MWP comparable to the current warming period.
Moderator Response: [Daniel Bailey] Yes, if you hide the incline (wherein we've equalled the maximum temperatures reached in the Holocene Altithermal), then a regional temperature excursion like the MWP does become more evident. Do you have a point with this exercise?
Note that there is a distinct MWP comparable to the current warming period.
Moderator Response: [Daniel Bailey] Yes, if you hide the incline (wherein we've equalled the maximum temperatures reached in the Holocene Altithermal), then a regional temperature excursion like the MWP does become more evident. Do you have a point with this exercise?


Prev 1894 1895 1896 1897 1898 1899 1900 1901 1902 1903 1904 1905 1906 1907 1908 1909 Next


