


 Arguments


Recent Comments
Prev 1903 1904 1905 1906 1907 1908 1909 1910 1911 1912 1913 1914 1915 1916 1917 1918 Next
Comments 95501 to 95550:
-
adelady at 12:54 PM on 16 February 2011Monckton Myth #11: Carbon Pricing Costs vs. Benefits
Harry@39. ".... can this really be handled without creating a bureaucracy?" Well, it can be handled without creating an entirely new bureaucracy. There are 2 functions of government that modern societies have really got under control. One is administering taxes, the other is distributing benefits. (Leave aside my personal views about the efficiency of various systems in different countries.) A carbon tax differs very little from alcohol excises or customs duties or sales taxes. Name the taxable item, set the rate, impose the levy / tax / duty / excise. Every industrialised country has one or more established bureaucracies that could simply add this item to the other imposts they collect. A universal carbon payment looks a great deal like other near-universal payments. Child benefits, pensions, you name it. All you need to do is to get the recipients on the system, set the rate, choose the payment intervals, send cheques / transfer funds to bank accounts. The only complications will be those that already affect existing payments - nursing home residents, homeless people and all the similar bureaucratic headaches. But they're the same bureaucratic headaches, nothing new. -
Albatross at 12:46 PM on 16 February 2011Monckton Myth #12: Arctic Temperature Changes
Regarding polar amplification, don't forget Screen and Simmonds (2010). -
Daniel Bailey at 12:43 PM on 16 February 2011CO2 has a short residence time
@ koyaanisqatsi (22) Patience is a virtue (or so I'm told). Anyway: You're friend is nuts/wrong/misled/mistaken (your call which). Flask, in-situ, ice core: all datasets show increasing concentrations of a globally well-mixed gas. We can even see it from orbit: And over geologic time: Have a great day! The Yooper -
robert way at 12:42 PM on 16 February 2011Monckton Myth #12: Arctic Temperature Changes
Flanner et al. (2011) might address your previous point pertaining to the forcing at the poles. In particular note the following "On the basis of these observations, we conclude that the albedo feedback from the Northern Hemisphere cryosphere falls between 0.3 and 1.1 W m−2 K−1, substantially larger than comparable estimates obtained from 18 climate models." -
robert way at 12:39 PM on 16 February 2011Monckton Myth #12: Arctic Temperature Changes
Agnostic, I chose 64 to 90 N because its the easiest way to partition it in the Gistemp algorithm. It naturally includes that region as its own zone so it makes it easier to extract from that region. The other key point is that what defines the Arctic is very difficult to conclusively define. Lets consider this, northern Labrador is considered to be part of the Canadian East Arctic but the furthest north in Labrador is 60 N. The arctic treeline there is near 57 N which is very low and the mountains there have the only biome consisting of Arctic Cordillera outside of the very high Arctic. Mean annual air temperatures (MAATs) in the region are as low as -7°C. That region is excluded from my analysis but I could make very strong arguments for its inclusion. Nonetheless it is very difficult to conclusively define what is Arctic and what is not and you make an interesting point. -
Utahn at 12:29 PM on 16 February 2011Meet The Denominator
Poptech, I notice you conveniently neglected to answer my last question, so I'll pose it again. Granted that 850 papers on cigarette smoking exist that could be construed to "strengthen the skeptical position" against the consensus that smoking causes cancer, would you say that that is strong evidence against the consensus, or weak evidence, or could you tell? -
pbjamm at 12:13 PM on 16 February 2011Meet The Denominator
Poptech@385 "Deleting posts wholesale is censorship. Calling it violation of the comment policy does not change this fact." Nonsense. your comments have not been wholesale deleted from this tread as anyone reading it can easily see. If you have made comment that violate the policy they get deleted. Everyone here knows how this works. "I will accept editing of the part of my comments that violate this policy when it is evenly applied." It is highly unfair to expect the mods to edit your posts for you in order to keep the conversation civil. That is the job of the poster. Editing of comments would also open the mods up to accusations of context doctoring. -
Chris G at 12:06 PM on 16 February 2011Monckton Myth #11: Carbon Pricing Costs vs. Benefits
Harry S., I'm hoping Obama's budget request is not killed by congress, but my hopes are not that high. I think that in the US, the people that get elected are more often the ones who spend more on their campaigns. That means accepting donations from people with money, and the fossil fuel industry has more money than any other industry I know. And let's not kid ourselves; solving the climate change problem means putting them out of business, and they know it. I'm not saying that politicians necessarily change their opinions based on the donations they receive, but if you are in danger of being put out of business, you are going to support those who see things your way. All that means is that it is difficult to overcome the status quo, but it's not like everyone here didn't already know that. Already there are Republicans in congress who are saying that the $4 billion per year loss of fossil fuel tax subsidies would cost the US to loose jobs. Yeah, no kidding, shifting off of fossil fuels will cost jobs in that sector. The local Republican governor has stated that one of his main goals is to see a new coal plant built, because Kansas needs the energy. Why would a political figure feel the need to push forward a project in private industry? And the vast majority of the energy produced is contractually bound to Colorado; the energy left over is a few windmills worth; so, why does the governor feel that Kansas needs the plant? Pirate, Open up Google Earth and zoom in on an industrial agricultural area. You see roads, train tracks, and about every 20-40 km a town. That town will have a school, a hospital, and other infrastructure. Shift poleward and what do you see; none of that. In the case of southern Australia, you see ocean. You are supposing that shifting where we grow food will have no cost, even if we can grow food there. What if where you can grow food crosses national boundaries? Hadley cells will shift toward the poles and push the rain ahead of them. Thanks Glenn T, you have just repeated the all things that make me wonder why I bother to get out of bed in the morning. But, no matter what happens, my kids will be better off if I give them a good start in life. IMHO, I don't think we'll ever see 9 billion people on this planet. The world's resources are finite; there is a limit to the earth's carrying capacity; Malthus will be proven right in time. I just hope that we reach that limit softly. If the environment is seriously degraded, the earth's carrying capacity will be on a decline when our increasing population hits it, and that is a recipe for a major over-correction. There is a possibility that we will have a revisit of Easter Island on a global scale. In the local newspaper, there was a comment that might as well have said, "I don't want to have to give up luxury items; therefore, AGW is just a government conspiracy." and he had supporters. My hope is not high. I can't comprehend people who argue about the cost of repairing the electrical wires when their house is in danger of catching fire. Sorry, this is getting way to long, but weather has always introduced a certain amount of variability in food production, but we've optimized to certain means and variations about those means. and now we are changing them. Why would anyone think production will not be adversely affected? -
scaddenp at 11:56 AM on 16 February 2011Meet The Denominator
Poptech, still interested in your answer to the questions in #379. -
Marcus at 11:56 AM on 16 February 2011Meet The Denominator
"Deleting posts wholesale is censorship." Well you'd know, wouldn't you PopTech, as you frequently delete posts on your own site-even if they *don't* violate the comments policy. Not that you have to worry about that so much anymore, now that you've intimidated your dissenters into silence with the threat of releasing their personal info. As it happens, I've had a number of my posts here deleted wholesale because I crossed the line. However, unlike members of the Denialist Cult-who see a conspiracy in *everything*-I just take it in my stride & try & moderate my own comments in future. If you can't stand the heat.... -
scaddenp at 11:53 AM on 16 February 2011Monckton Myth #12: Arctic Temperature Changes
And more recent (with references to earlier reviews) Serreze et al 2009 -
mclamb6 at 11:53 AM on 16 February 2011Meet The Denominator
Poptech at 383: In relation to your claim that 850 papers is "a lot" or whatever language you used earlier in the thread. The whole point, once again, is that 850 papers (taken at face value) is meaningless as a statistic to bolster a particular view point absent a frame of reference to the overall body of peer review climate science relating to climate change. You cannot in good faith argue otherwise. -
Marcus at 11:52 AM on 16 February 2011Meet The Denominator
"Yes any increase in the number of papers (even by 1) would strengthen the skeptical position. It would be illogical to say that an increase would weaken it." What a load of nonsense. That would only be the case if the paper in question (a) told us something we didn't already know & (b) is backed up by firm evidence. Most of the papers you list tend to be rehashes of long disproved ideas, don't provide evidence to back them up or are-at best-skeptic neutral. Using papers like that doesn't strengthen the skeptic position, it weakens it by proving that your argument is so weak that you need to pad it out with nonsense. -
scaddenp at 11:51 AM on 16 February 2011Monckton Myth #12: Arctic Temperature Changes
Agnostic - there is this article on why. (It's not simple - its what the GCMs predict). -
JMurphy at 11:49 AM on 16 February 2011Meet The Denominator
"Actually they are not identical papers..." Who said they were ? "...another is a much longer paper with a more detailed analysis" Unproven. Prove it. "...as I have proven above" Strawman. What's that got to do with relevance to 'AGW Alarm' - whatever that means ? "All of this has been gone over many times ad nauseum with you." No it hasn't. Prove it. "...the link worked when I just checked it..." No, your link didn't work, which is why I got the error message. You are wrong again. "Not surprisingly I only receive emails on this from those not out to attack the list." Unsubstantiated. Prove it. "Those that are post these irrelevant things..." 'Irrelevance' is subjective and unproven. "Implying what I don't know..." Who implied that ? Prove it. (Actually, no-one needs to imply that, anyway) "I am not an admin of the CSA servers and have no control over their hyperlinks" Strawman. Who said you did or were ? Prove it. "Wow you guys are great, thanks for helping make my argument." Oh dear. You have an argument ? I can see why you would need others to make it for you...whatever it is. -
Marcus at 11:42 AM on 16 February 2011Meet The Denominator
So, what we're left with here is a list that is predominantly padding-papers which are out of date &/or have been thoroughly debunked; papers consisting of political or legal opinions not backed up by evidence; papers published in multiple journals (& *no*, Poptech, there is not sufficient difference between a 1964-1994 & 1964-1998 timeframe to justify counting it as a completely separate paper); papers published in journals with a clear political/ideological agenda-& with proven track records of below-par peer-review standards (like E&E & Cato Journal); papers that directly contradict each other; papers which don't actually support the skeptic view-& the list goes on. Yet even if this wasn't the case, what does this list actually tell us? That there is a dissenting opinion in the general community on the future dangers of AGW? Well that's hardly a great revelation. Yet the way Poptech & his followers flourish this "list", you'd think they'd stumbled on the smoking gun that "proves" that AGW is nothing to worry about-yet the list provides no such ammunition. Yet every time they pull out a reference to "the list", its with the air of a chess player yelling "Checkmate". Its not Checkmate Poptech-its not even "Check"-just a restatement of what was already known (that those predominantly from the Far Right don't believe global warming is real-whoop chook). -
Riduna at 11:36 AM on 16 February 2011Monckton Myth #12: Arctic Temperature Changes
I thought that the Arctic was defined either as the 10C isotherm or the tree-line (both of which are moving north) and was internationally recognized as all areas north of the Arctic Circle. Extending it as far south as 64N does seem a bit generous. Even so, Robert Way again shows that Monckton has yet to make a substantive statement on global warming, its causes and effects which is either accurate or excludes misrepresentation of peer reviewed science. I still don’t understand why global warming produces temperature change in the Arctic 3 times greater than in the tropics. Surely this can not be attributed solely to lower albedo due to sea-ice melt? -
Marcus at 11:33 AM on 16 February 2011Meet The Denominator
Hey Poptech, how can a claim be libelous when you have actually admitted to the relevant facts? Here in the real, rational world (as opposed to Denialist Central), posting someone's personal info-without their permission-with the intent of silencing them is what we call *intimidation*-& intimidation is the tactic of a thug. Just because you refuse to accept that truth about yourself doesn't make it any less true-no more than an alcoholic who denies they're not abusing alcohol. Its certainly no different from your mate Monckton who-when faced with the exposure of his Snake Oil Salesman routine-threatened to try & have someone sacked from their job. -
scaddenp at 10:51 AM on 16 February 2011Meet The Denominator
Poptech, your list is there to bolster the idea that AGW is not real/not alarming. Ie no action required. I have a couple of questions. 1/ Do you consider the BAU scenario outcomes in IPCC WG2 for 2100 "alarming"? I am guessing not. 2/ If you are wrong, then what future data would cause you to change your mind? (eg world mortality rate, insurance costs, food price index, or even climate indicators like ice extent or sea level?). For your chosen index, what level would they have to get to by 2050 for it to be "alarming". Note that I am quite aware that climate now is well within our ability to adapt, but the movements to reduce CO2 are based on premise future change will indeed be costly. -
Dikran Marsupial at 10:47 AM on 16 February 2011Meet The Denominator
pbjamm@376 - try counting the peer reviewed papers cited in the IPCC WG1 scientific basis report, there look to be many more than 850. The references in the IPCC report also have the benefit of actually supporting the argument being made ;o) -
pbjamm at 10:33 AM on 16 February 2011Meet The Denominator
I did a quick count of the peer reviewed papers supporting AGW on the Global Warming Links page and came up with a scant 408 unique papers! Best get to work if we ever want to catch up. -
CO2 has a short residence time
drrocket - "...nature is indeed a net source of CO2 in warming epochs, such as the last 50 years..." Not quite right. Warming decreases ocean solubility for CO2, and in the absence of other effects will outgas until the partial pressure of CO2 matches solubility and oceanic concentrations of CO2 complexes. However, if the partial pressure rises, as is the case with our emissions, then the ocean will absorb CO2. It's a race between decreasing solubility due to warming and partial atmospheric pressure, and atmospheric pressure is well in the lead right now. The oceans are a CO2 sink, sequestering ~45% of our emissions. -
Dikran Marsupial at 09:56 AM on 16 February 2011CO2 has a short residence time
drrocket@19 wrote "First, nature is indeed a net source of CO2 in warming epochs, such as the last 50 years." No, that simply isn't true; if it were true, the annual rise in atmospheric carbon would be greater than anthropogenic emissions instead of less, becuase both man and nature were contributing to the rise. This is a simple bit of accounting, and the uncertainties involved are too small to have any bearing on the conclusion. While temperature does affect uptake of CO2 by the oceans, the fluxes also depend on the difference in partial pressure of CO2 between the atmosphere and surface waters, so if atmospheric CO2 rises, ocean uptake increases. This is known physics. "Third, your claim that the "then the observed rise will be greater than anthropogenic emissions, as the annual rise is equal to total emissions minus total uptake" is false, if by your second use of the word emissions you are referring to your immediately preceding phrase, "anthropogenic emissions"." No, by "total emissions", I meant total emissions, i.e. anthropogenic emissions plus natural emissions. "The annual rise must be equal to the total inputs minus the total uptakes. " yes, that is the very basis of the mass balance argument that proves that the rise is anthropogenic. "Fourth, your ultimate claim that "the natural environment is a net carbon sink rather than a source" is false. Take a look at the Vostok Record, for example, a period in which man surely had no effect. Sometimes the natural environment is a net sink, sometimes a net source." Irrelevant, I am stating what is observed to be happening now, not thousands of years ago. However, the paleoclimate data strongly suggests that the rise is not natural. In the Vostok data you only see a change in CO2 of 100ppmv in response to the sort of temperature change you see at the start of an interglacial (about 10 degrees C), whereas now we have seen a rise of 100ppmv with a temperature rise of less than a degree. So can you explain why the oceans are suddenly so much more temperature sensitive now than they have been for the last 800,000 years? There are parts of AGW theory that are uncertain; that the rise in CO2 is of anthropogenic origin simply isn't one of them. -
PT_Goodman at 09:56 AM on 16 February 2011CO2 has a short residence time
Maybe someone can help me. I think I've figured this out, but I'm not sure. At NASA OCO , it is stated (within the first paragraph) that: "Measurements from a global network of surface stations indicate that atmospheric CO2 increased by 1% annually over the past 40 years -- i.e., from 326 ppmv in 1970 to 389 ppmv in 2010." If atmospheric CO2 increased annually by 1% between 1970 and 2010, and the CO2 concentration was 326 ppmv in 1970, then wouldn't the 2010 CO2 concentration be 326*(1.01**40)= 485 ppmv? OK, this is what I think is happening. In reality, the 1% increase is in emissions. But only 43% of that remains in the atmosphere on average. Thus, we would see an increase in atmospheric CO2 concentration of 326*(1.0043**40)=387 ppmv, which is consistent with the 2010 MLO CO2 concentration of 389.78 ppmv. I am trying to debate a GW skeptic and that person simply says that NASA is "lying." It's not clear what NASA would be lying about. Can someone help me out? Is my thinking correct? -
Climate sensitivity is low
A question for the group - I hope this is a reasonable place for it, and even more that I'm phrasing this intelligibly. Given that we have raised the CO2 concentration quite high, it's now high enough that the oceans are acting like a sink despite their warming (above solubility pressures) - the oceans are absorbing 2ppm/year or so. If we maintain, as we are doing now, a CO2 concentration above that which would induce CO2 output by the oceans, does that remove one of the feedbacks (CO2 outgassing from said oceans) from the climate sensitivity calculations? In other words, does the forcing by CO2 emissions block the CO2 element of forcing feedback, and thus reduce climate sensitivity?? -
muoncounter at 08:39 AM on 16 February 2011CO2 has a short residence time
drrocket: "not trivial because MLO sits in the plume of Eastern Equatorial Pacific outgassing" There's no discernible difference between the monthly MLO CO2 concentration and any station around the world at a comparable latitude -- island or landlocked, no difference. See the thread MLO is a volcano for further information and comments. -
Rob Honeycutt at 08:06 AM on 16 February 2011Meet The Denominator
Plilippe... "This obviously indicate that the 850 number is inaccurate. The numerator is all puffed up..." Awww... That means PT is back down to ~0.1% again. So sad. He was doing so well for a little while there. -
Harry Seaward at 07:39 AM on 16 February 2011Monckton Myth #11: Carbon Pricing Costs vs. Benefits
From a carbon taxing proposal I've seen in the US: 1. Tax carbon at it's source. 2. The tax will rise at a set rate over a 10 year period. 3. Costs of goods and services will necessarily rise. 4. To offset those costs - 100% of the tax revenue will be distributed to the public as "dividends". 5. There will be no administrative costs. Without getting into a discussion of the validity of a carbon tax, can this really be handled without creating a bureaucracy? -
muoncounter at 07:38 AM on 16 February 2011It's the ocean
On another thread, friend BP linked to Compo 2009, claiming that ocean heating supposedly drives land heating. ... recent ocean warming ... has increased the humidity of the atmosphere, altered the atmospheric vertical motion and associated cloud fields, and perturbed the longwave and shortwave radiative fluxes at the continental surface. This proposed mechanism doesn't seem to make any sense, but it does argue for strong positive water vapor feedback. -
Philippe Chantreau at 07:33 AM on 16 February 2011Meet The Denominator
LOL, that was a good one Dhogaza. If nothing else, this rather miserable thread by SkS standards led to a closer examination of Poptech's list. So far, on the very limited focus of numerator only, we've learned: - Some papers do not appear to support PT's position at all, regardless how "alarm" is defined (such as the Feynmana paper pointed by Albatross a while back) - Some papers don't exist at all (see above) - The same paper can figure up to 4 times. This obviously indicate that the 850 number is inaccurate. The numerator is all puffed up... -
JMurphy at 07:28 AM on 16 February 2011Meet The Denominator
And it seems that the little list is relying heavily on papers by the Idso family - mainly Sherwood (with 66), but a total of 69 altogether. Nearly half of them are from the 80s, though, and very few from this millenium. Up-to-date stuff, eh ? When you combine that with the usual suspects of Michaels, Lindzen, Douglass, Singer, Christy, Spencer, Soon, McIntyre, Loehle, McLean, De Freitas, Carter, the Pielkes (especially Jr, who didn't want his papers included in the list), Morner, Eschenbach, Svensmark, Scafetta, Boehmer-Christiansen (!), and about a dozen others with anything between two and five papers each, you're looking at a list which has about 30 people contributing something up to a third of the total. Take them away and you're left with the likes of David Bellamy, Beck and Gerlich, etc, as well as all those waved through on Energy & Environment, and from journals, etc. with no normal link to output concerning AGW, let along 'AGW Alarm' - whatever that means. I.E. It's a joke. -
RickG at 07:10 AM on 16 February 2011Monckton Myth #11: Carbon Pricing Costs vs. Benefits
Pirate, Longer growing seasons don't help if the productive agricultural zones move into areas where agriculture cannot take place.Moderator Response: ... and more info is in "It’s not bad" and "CO2 is not a pollutant." -
Eric (skeptic) at 07:01 AM on 16 February 2011CO2 has a short residence time
drrocket, a warming ocean can be a net sink of CO2, see /Seawater-Equilibria.html -
apiratelooksat50 at 06:52 AM on 16 February 2011Monckton Myth #11: Carbon Pricing Costs vs. Benefits
I've read most of the working links above. Do the background documents take in any of the positive effects global warming: longer growing seasons, increased crop productivity, lower heating costs in winter, etc... -
drrocket at 06:45 AM on 16 February 2011CO2 has a short residence time
Marsupial at 11:08 AM 2/15/11, Your logic is peccable. First, nature is indeed a net source of CO2 in warming epochs, such as the last 50 years. That is Henry's Law, never mentioned by IPCC. Second, the observed rise could be anything. We don't have the powers of perfect observation. The problem is not trivial because MLO sits in the plume of Eastern Equatorial Pacific outgassing, where the CO2 concentration depends primarily on local temperature. Further, what is "observed" from MLO is a highly processed record, far from raw data. For example, >> Each CO2 concentration record, C (t) was decomposed into a seasonal function, consisting of four harmonics, and a seasonally detrended function, according to the relation [C(t) = C_seas(t) + C_annual(t)] (2.1) where [C_seas(t) = (1-γt) * sum((a_k*sin(ω_k*t) + b_k*cos(ω_k*t)), k = 1 to m] (2.2) >>In the second expression γ (a "gain factor") and the factors, a_k and b_k, denote constants obtained via a fit to the data; t denotes the time in years; ω_k the angular frequency, equal to 2πk; and m the number of harmonics, chosen to be 4. The seasonally adjusted function, C_annual, is expressed by a spline function in which the annual average of the integral of the squared second derivative is set to a predetermined value to provide a nearly uniform degree of smoothing of all of the records. The actual function is established in several steps involving intermediate functions (see Keeling et al. [1989a, p. 167 and pp. 218-227]) to assure stability in the calculation and to determine monthly averages that take into account the actual dates of each observation. The isotopic record, δ13C(t), is treated similarly. Keeling, CD, et al., "Exchanges of Atmospheric CO2 and 13CO2 with the Terrestrial Biosphere and Oceans from 1978 to 2000, I. Global Aspects, June, 2001, p. 5. "Predetermined"? "Nearly uniform"? "Smoothing"? "Intermediate functions"? "Assure stability"? Read how other stations were "identified" with MLO data, how data were adjusted according to "a long-term trend line proportional to industrial CO2 emissions". Id., p. 6. These "data [that] have iconic status in climate change science as evidence of the effect of human activities" [AR4, ¶1.3.1, "The Human Fingerprint on Greenhouse Gases", p. 100] are over-masticated, over-celebrated, and over-fraught with opportunities for subjective influences. Third, your claim that the "then the observed rise will be greater than anthropogenic emissions, as the annual rise is equal to total emissions minus total uptake" is false, if by your second use of the word emissions you are referring to your immediately preceding phrase, "anthropogenic emissions". The annual rise must be equal to the total inputs minus the total uptakes. Fourth, your ultimate claim that "the natural environment is a net carbon sink rather than a source" is false. Take a look at the Vostok Record, for example, a period in which man surely had no effect. Sometimes the natural environment is a net sink, sometimes a net source. -
RickG at 06:10 AM on 16 February 2011PMEL Carbon Program: a new resource
Rob, have you looked at the topic Why ocean heat can’t drive climate change, only chase it? -
Rob Painting at 06:02 AM on 16 February 2011PMEL Carbon Program: a new resource
Hopefully the 2nd to last paragraph makes sense. Looking at it now it's a bit ambiguous discerning fossil fuel CO2 from total carbon forms in the oceans (DIC). -
Rob Painting at 05:56 AM on 16 February 2011PMEL Carbon Program: a new resource
I made a comment specifically about coastal upwelling Yes, and you've been asked twice already, how this novel CO2 production line is supposed to work. Like all skeptic ideas it lacks coherence. It still doesn't look much like muoncounter's graph. Your eyecrometer "filter" is in need of adjustment. Muoncounter's graph appears to be that of dissolved CO2 in the oceans (given the concentration levels). The graphs you have linked to are for all forms of carbon dissolved in the oceans, which includes bicarbonates and carbonates (very important for shell/skeleton building marine critters). The salient point being that all graphs show carbon accumulating in the upper ocean, exactly as science expects. The large injection of fossil fuel CO2 is accumulating too fast for natural processes to mix it throughout the water column. -
dhogaza at 05:46 AM on 16 February 2011Meet The Denominator
Waste Management, a journal "designed for scientists, engineers, and managers, regardless of their discipline, who are involved in scientific, technical and other issues related to solid waste management".
Well, the paper's a form of solid waste, so it landed in the right place, no? :) -
muoncounter at 05:31 AM on 16 February 2011PMEL Carbon Program: a new resource
Here's another reference for anthropogenic CO2 in the oceans: Sabine et al 2004 A number of key points: -- CO2 is not evenly distributed throughout the oceans. The highest vertically integrated concentrations are found in the North Atlantic. ... By contrast, the Southern Ocean south of 50°S has very low vertically integrated anthropogenic CO2 concentrations -- anthropogenic CO2 invades the ocean by gas exchange across the air-sea interface, the highest concentrations of anthropogenic CO2 are found in near-surface waters. Away from deep water formation regions, the time scales for mixing of near-surface waters downward into the deep ocean can be centuries Given that time scale, I'm not sure I get the significance of the pre-1994, post 1994 change. -- Globally, only 7% of the total anthropogenic CO is found deeper than 1500 m. The only place where large concentrations of anthropogenic CO2 penetrate to mid and abyssal depths is the North Atlantic --the ocean has constituted the only true net sink for anthropogenic CO2 over the past 200 years. Without this oceanic uptake, atmospheric CO2 would be about 55 ppm higher today than what is currently observed (~380 ppm). That's critical. If the rate of ocean uptake is decreasing (and Sabine makes the suggestion that it is), the result would be an acceleration of atmospheric CO2 concentration. Bad news all around. Here is a representative figure, highlighting the differences between 3 ocean basins. It is somewhat consistent with the figure from Key posted above, perhaps because Key is the 3rd author in the Sabine paper.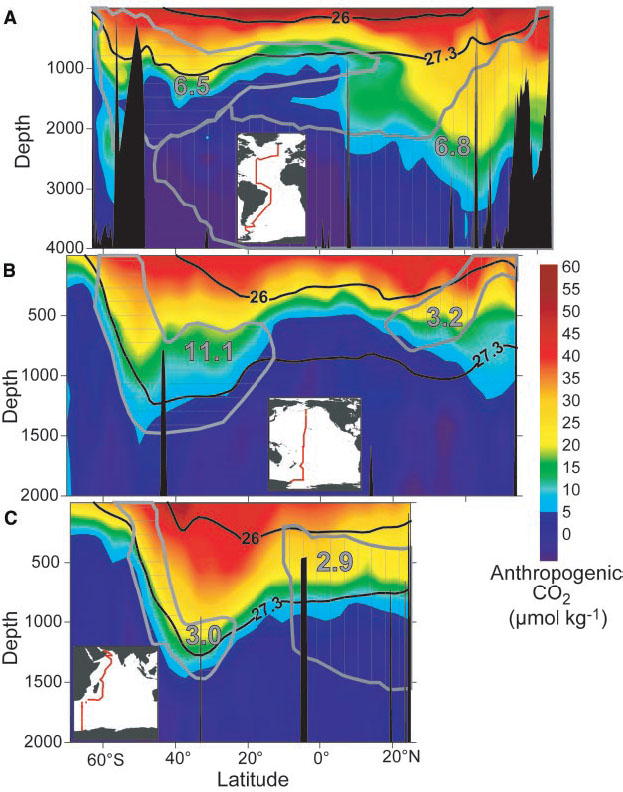 This is obviously a complex and very dynamic problem. Hopefully the availability of the PMEL data will help sort out what's going on.
-
JMurphy at 05:18 AM on 16 February 2011Meet The Denominator
Addendum to above - '...three journals (one of them twice)... mclamb6, there seems to be no abstract or copy available of "Global warming: Failed forecasts and politicized science", from that obviously relevant journal Waste Management, a journal "designed for scientists, engineers, and managers, regardless of their discipline, who are involved in scientific, technical and other issues related to solid waste management". That particular gem came from, wait for it...P.J.Michaels, and the link from that little list goes to Hit Count is 'Zero' with recQuery =, i.e. nowhere. -
mclamb6 at 04:46 AM on 16 February 2011Meet The Denominator
Edited from 369: Criticism of the quality of my research would be subjective and therefore solely in the of the beholder. -
mclamb6 at 04:45 AM on 16 February 2011Meet The Denominator
Yes, Poptech, we understand why the Pielke paper is on the list over his objections. You have created a vague definition of "AGW Alarm" that is found no where else other than on your web site. The definition is filled with sufficient wiggle room and entirely "subjective" language such that it can be stretched to include or exclude nearly anything at your whim. There is no quality control check, other than the barest of bare references to what constitutes "peer reviewed" and also because "quality" is "subjective". Armed with this definition and claiming to control the "context" of same, you include whatever you see fit, irrespective of the objections of the authors of said papers. Now, a couple of questions: are there any papers on your list for which there is no abstract available AND that you have not personally read? You've argued that "quality research" has no objective meaning. Suppose I took seven temperature readings at my house at the same time for seven consecutive days. I then author a paper "Global Warming at my House", complete with a statistical analysis of my results; references to appropriate literature, etc. By hook or by crook, I get my paper published. Are you arguing that criticism of said research would be subjective and therefore solely in the eye of the beholder? In other words, all research and resulting papers may have merit, regardless of objectively flawed methodology? -
Rob Honeycutt at 04:26 AM on 16 February 2011Meet The Denominator
I think Poptech has done an adequate job of chopping down the size of the denominator here. Good work Pop! Now, taking all his criticisms into account we are left with something in the neighborhood of 500,000 papers. So, we're giving him the benefit of the doubt on both sides of the equation. That leaves him with something in the range of 0.2% of papers challenging AGW. -
muoncounter at 04:22 AM on 16 February 2011Meet The Denominator
Eric: "there is no censorship here." Thank you for pointing this out. It's odd that PT confuses 'censorship' with the Comments Policy that tries to keep things civil. Posts that violate said policy tend to get deleted. Those are the rules established by John Cook, the owner of the site; it's expected that you play by the owner's rules. If PT has redefined violation of an established, mutually beneficial policy to mean 'censorship,' it must be another 'example' of his own version of what is supposed to be a common language. I'm also fascinated by this contradiction: pt: "Declaring a paper unscientific does not make it so." But when PT declares this post to be meaningless, we are just supposed to believe. As they say, the truth is out there. -
JMurphy at 03:51 AM on 16 February 2011Meet The Denominator
The following four papers from that little list are basically the same paper submitted to four different journals : Changing Heat-Related Mortality in the United States, (Environmental Health Perspectives, Volume 111, Number 14, pp. 1712-1718, November 2003) Robert E. Davis, Paul C. Knappenberger, Patrick J. Michaels, Wendy M. Novicoff Decadal changes in heat-related human mortality in the eastern United States, (Climate Research, Volume 22, Number 2, pp. 175-184. September 2002) Robert E. Davis, Paul C. Knappenberger, Wendy M. Novicoff, Patrick J. Michaels Decadal changes in summer mortality in U.S. cities (International Journal of Biometeorology, Volume 47, Number 3, pp. 166-175, May 2003) Robert E. Davis, Paul C. Knappenberger, Wendy M. Novicoff, Patrick J. Michaels Seasonality of climate–human mortality relationships in US cities and impacts of climate change, (Climate Research, Volume 26, Number 1, pp. 61-76, April 2004) Robert E. Davis, Paul C. Knappenberger, Patrick J. Michaels, Wendy M. Novicoff Is it really that easy to pass off the same basic paper as four 'unique' ones ? And as Michaels has his name next to another 26 papers on that list, it is easy to see how quickly the numbers add up from using papers (even from 'relevant' magazines like WASTE MANAGEMENT and the CATO JOURNAL) by a limited number of so-called skeptics. -
michael sweet at 03:39 AM on 16 February 2011PMEL Carbon Program: a new resource
Guinganbresil, You are doing a good attempt to look at the data, but I am not sure you have the graphs right. Muoncounters data is comparable to the bottom graph on your chart. His data is a summary of a bunch of graphs like your bottom chart. If I look at your bottom chart, it resembles Muoncounters graph. Muoncounters graph is more complete since it is a summary of a bunch of graphs. The points where the carbon goes down cancel out after averaging many graphs. The upper graphs on your chart show the normal carbon distribution, which is not what we are interested in. We are interested in the change due to humans. Be careful about criticizing others data if you are not sure what you are looking at. Remember that the scientists Muoncoumter linked to are professionals at looking at this data. -
Utahn at 03:16 AM on 16 February 2011Meet The Denominator
Ron I'm not finished :) -
Ron Crouch at 03:03 AM on 16 February 2011Meet The Denominator
I think PT has been given more latitude than he deserves. I can think of a few forums that would ban you from posting after just one warning PT. Consider yourself lucky that the folks here have allowed you to continue. Perhaps the best solution here would be to allow him to continue to rant, but put him on ignore mode. All we seem to be accomplishing is to feed his need to stir the pot. You will never convince him he is wrong about anything. ( -snip- )Moderator Response: [DB] A little less descriptive word imagery, please. The purpose of this post has already been served. -
Trueofvoice at 02:55 AM on 16 February 2011PMEL Carbon Program: a new resource
Guinganbresil, The difference in the charts is that muoncounter's is tracking the increase in anthropogenic CO2 (the only source on the rise) dissolved in seawater whereas yours deals with total CO2, anthropogenic + non-anthropogenic. Anthropogenic CO2 resides mostly in the upper oceans because it is absorbed at the surface. In addition increasing temperatures create a more stratified ocean, acting as yet another barrier to transport of anthropogenic CO2 to the depths.
Prev 1903 1904 1905 1906 1907 1908 1909 1910 1911 1912 1913 1914 1915 1916 1917 1918 Next


