


 Arguments


Recent Comments
Prev 1944 1945 1946 1947 1948 1949 1950 1951 1952 1953 1954 1955 1956 1957 1958 1959 Next
Comments 97551 to 97600:
-
Oceans are cooling
RW1 - You are still not looking at this from a standpoint of penetration depth. Given the thermal conductivity and circulation patterns of the oceans, it takes time for heat to reach the deep ocean, and hence short term seasonal variations do not penetrate very far into the ocean mass. The total mass changing temperatures up and down is a relatively small portion of the ocean thermal mass. A constant offset, on the other hand (like the current energy imbalance) held over what is now multiple decades - that has time to affect deep waters, and affect the average temperatures. If I take a brick and repeatedly pass a hot torch and a block of ice over the top of it, the bottom of the brick will change temperature almost not at all. If, on the other hand, I sit an electric blanket on it all day, the bottom of the brick will warm up. Penetration depth, and time for heat transfer! -
Ron Crouch at 15:31 PM on 23 January 2011A Case Study in Climate Science Integrity
#42 Tom Yeah. I know that was your point. Sorry if it sounded as if my frustrations were directed specifically at your comment. If governments would only face global warming with the same tenacity that they apply to terrorism. -
MikeCoombes at 15:26 PM on 23 January 2011Monckton Myth #6: Global Sea Ice
Tom Curtis@13 I think you misread the intent of the comment and I was too much in professor mode. I am always telling my students that a single number by itself is not the basis for a conclusion and that they should not expect me to dig through the rest of their lab report for the data that backs them up. The sentence is saying that a million is a big number so that it is big effect. It is the converse of the the argument that 350 ppm of CO2 is a small number and so can only have a small effect on climate. Neither is a scientific argument. Big and small are relative terms and need other numbers for context. Simply adding that the decline is in fact a 5% long term decrease will greatly increase the chances that a reader will agree that Monckton is an ass. I hasten to add that I don't think James Wright is trying to pull a fast one. He has done a great job and presented lots of evidence but the intro could still use a few tweaks. I hope he sees my comment as a friendly suggestion. -
RW1 at 15:20 PM on 23 January 2011Oceans are cooling
Robert S (RE: 41), "Ah, I wondered if this was your issue. Nonlinear, RW1, Nonlinear. As the Earth warms, the more it emits (a la Stefan-Boltzmann), the less the imbalance becomes = less energy builds up in the system per unit time. Temperature will follow a roughly logarithmic curve with a horizontal asymptote at the new equilibrium temperature." Some of the nonlinearity was factored in because it's not +100 W/m^2 for the whole 6 months. OK, how should we calculate the non linear response given these knowns (+10C surface air and about 5 C ocean)? Let's run the numbers - it still isn't going to be anywhere near a decade. -
Steve Meacher at 15:19 PM on 23 January 2011The Climate Show #5: Green roofs and Brisbane floods
# Daniel Bailey (2) I've had another look at Leif's original calculation. He was actually not looking at total increased water vapour in the atmosphere (as John is) but at increased total precipitation over land. Although I disagree with some of the details of his calculation, I reckon his result is about right. I get around 1.6 "Lake Superiors" additional precipitation over land, globally. Given recent media statements that twice the volume of Sydney harbour was flowing daily through Wivenhoe Dam, I thought it might be interesting to estimate how many extra "Sydney harbours" of rainfall Australia might expect. Based on 1989 rainfall (BoM) of 3,713 cubic kms. an increase in precipitation of 4% translates to an extra 267 Sydney harbours falling across Australia each year. -
RobertS at 15:04 PM on 23 January 2011Oceans are cooling
"If the equilibrium response time were a decade, then we should expect at least an accumulation of over 20 C a year air and about 10 C ocean, correct? Over ten years, that amounts to over 200 C air and 100 C ocean." Ah, I wondered if this was your issue. Nonlinear, RW1, Nonlinear. As the Earth warms, the more it emits (a la Stefan-Boltzmann), the less the imbalance becomes = less energy builds up in the system per unit time. Temperature will follow a roughly logarithmic curve with a horizontal asymptote at the new equilibrium temperature. "This is interesting. I though the AGW theory is saying the opposite of this - that is most of the warming is in the pipeline and yet to occur?" No - ~0.8C seen so far, ~0.6 to go. But this issue is complicated by other forcings and a gradual (but increasing) buildup of CO2. That's why I gave the hypothetical Earth example to simplify things. -
muoncounter at 14:27 PM on 23 January 2011Arctic sea ice has recovered
Continuing from here, comment #23. "the 30's to 50's drop from very large extents to less large is only a bit less in magnitude." No, the '30s to '50s drop is a lot less in magnitude. Here is a graph of the Walsh data set, txt file here. Red is September min, blue is March max. Perhaps the variations reported by Mahoney et al 2008 in the Russian arctic are the mid-century blips. By way of contrast, we're on the downward Nantucket sleigh ride.
-
muoncounter at 14:18 PM on 23 January 2011Monckton Myth #6: Global Sea Ice
#23: We're now well away from the original topic of this thread. Continuing ice discussion on the Sea ice has recovered thread. -
Eric (skeptic) at 14:17 PM on 23 January 2011Monckton Myth #6: Global Sea Ice
For the Antarctic, there is some historical discussion here http://www.igsoc.org/annals/1/igs_annals_vol01_year1980_pg103-112.pdf but not ice extent data, just "considerably greater" numbers of icebergs in the late 1800's than the 1970's. -
Eric (skeptic) at 14:13 PM on 23 January 2011Oceans are cooling
RW1, please look at the paper I linked in #31 which gives an estimate of the seasonal ocean heat storage (5×10²² J trough to peak). Then compare that to the seasonal increase in TSI (need to integrate the increased power over the same portion of the year). Unfortunately I do not have the numbers to do that. Then compare the two and see how much of the extra solar energy made it into the ocean in one season. -
RW1 at 13:56 PM on 23 January 2011Oceans are cooling
Robert S., "On a hypothetical Earth where we instantly doubled the CO2 from 280ppm to 560ppm, the bulk of the temperature change would indeed be felt within the first few years, but full equilibrium is not reached for a century or longer according to climate commitment studies (try Meehl 2005" This is interesting. I though the AGW theory is saying the opposite of this - that is most of the warming is in the pipeline and yet to occur? -
Eric (skeptic) at 13:45 PM on 23 January 2011Monckton Myth #6: Global Sea Ice
The Russian data shows that a drop about 30% larger from the early 80's to 2005 compared to the drop from the 30's to the 50's. The data covers less than 1/2 of the Arctic, but the temperature change is representative of the Arctic as a whole (Fig 9 in the link #21). The Walsh and Johnson paper shows just a small rise from 53-77 which is proportionally less than the Russian data. It might be more representative of that time period but unfortunately doesn't go earlier. I am convinced the current drop is dramatic and the current extent was made much smaller due to feedbacks from prior season open water and late refreezing. The issue is that the 30's to 50's drop from very large extents to less large is only a bit less in magnitude. -
RW1 at 13:45 PM on 23 January 2011A Case Study in Climate Science Integrity
Robert, I responded in the ocean/heating cooling thread. -
RW1 at 13:44 PM on 23 January 2011Oceans are cooling
Continued from another thread: Robert S., "No one is claiming that. The fact that there are large seasonal temperature variations in no way contradicts a long equilibrium time. With seasons we are not talking about equilibrium time because, as Tom says, the hemispheres do not reach equilibrium with the max and min values of insolation and albedo. No where even close." OK, let's run some numbers. The northern hemisphere surface air temperature increase at peak summer is over 10 C on average. The sea surface temperature increase is about 5 C. This is an enormous accumulation of heat in a very short period of time - only 6 months, during which only part of the +100 W/m^2 peak solar energy is forcing the hemisphere. Let's say hypothetically speaking, the earth were to suddenly remain at its maximum summer tilt angle permanently. If the equilibrium response time were a decade, then we should expect at least an accumulation of over 20 C a year air and about 10 C ocean, correct? Over ten years, that amounts to over 200 C air and 100 C ocean. That is obviously way too high, don't you think? Let's shorten the time span to only 2 years. That would still amount to over 40 C air and 20 C ocean. That still seems too high, doesn't it? -
muoncounter at 13:30 PM on 23 January 2011Arctic sea ice has recovered
Hits just keep on coming. Reduced ice extent decreases the albedo, which in turn reduces the negative feedback (and that increases the net positive forcing, no?) Flanner et al 2011: Radiative forcing and albedo feedback from the Northern Hemisphere cryosphere between 1979 and 2008 We find that cryospheric cooling declined by 0.45 W m−2 from 1979 to 2008, with nearly equal contributions from changes in land snow cover and sea ice. On the basis of these observations, we conclude that the albedo feedback from the Northern Hemisphere cryosphere falls between 0.3 and 1.1 W m−2 K−1, substantially larger than comparable estimates obtained from 18 climate models. -
muoncounter at 13:04 PM on 23 January 2011Monckton Myth #6: Global Sea Ice
#21: "point of the chart is to show the natural variation." Which it shows very well. The natural variation is tiny compared to the unnatural change. Here's one of the papers from the link I gave in #20: Walsh and Johnson 1979: Arctic sea ice data from the 1953–77 period are digitized onto a set of 300 monthly grids covering the polar cap. ... The time series of total Arctic ice extent shows a statistically significant positive trend and correlates negatively with recent high-latitude temperature fluctuations. I don't know the magnitude of the 'significant positive trend,' but the title of this paper includes the word 'fluctuations'. See the graph here. The mere existence of fluctuations is to be expected -- note that in subsequent literature the word 'fluctuation' is replaced by words like 'collapse'. -
Eric (skeptic) at 12:30 PM on 23 January 2011Monckton Myth #6: Global Sea Ice
#20 muoncounter, it is a smaller area and it is the max extent and it ends before 2000, so obviously a lot less of a drop. You are correct that the AGW variations show up in the min extent more. The point of the chart is to show the natural variation. Here's the Russian data analyzed in a study http://seaice.alaska.edu/gi/publications/mahoney/Mahoney_2008_JGR_20thC_RSI.pdf Unfortunately it only starts in 1933 and then only in summer (defined as Jul-Sep). Figure 8 it shows the summer ice extent dropping into the early 50's, then a slight rise to the early 80's and then dropping more steeply to the end of the study 2005/6. Once again a limited area so the drops are scaled correspondingly, about 1/2 million sq km from the 1930's to the 1950's and a bit more than that from the early 80's to 2005. -
RobertS at 12:29 PM on 23 January 2011A Case Study in Climate Science Integrity
Should be ...because of the massive difference between absorbed solar in winter vs. summer. Any further discussion will be in the ocean heating/cooling thread. -
RobertS at 12:23 PM on 23 January 2011A Case Study in Climate Science Integrity
"In effect, what's being claimed here is that the far smaller imbalance from CO2 will take way longer to reach equilibrium than the much larger seasonal imbalance from the Sun, and that doesn't add up." No one is claiming that. The fact that there are large seasonal temperature variations in no way contradicts a long equilibrium time. With seasons we are not talking about equilibrium time because, as Tom says, the hemispheres do not reach equilibrium with the max and min values of insolation and albedo. No where even close. The hemispheres don't need to reach equilibrium (or anywhere even close) for such large temperature variations to be observed because of the massive difference between absorbed solar in winter vs. solar. On a hypothetical Earth where we instantly doubled the CO2 from 280ppm to 560ppm, the bulk of the temperature change would indeed be felt within the first few years, but full equilibrium is not reached for a century or longer according to climate commitment studies (try Meehl 2005). A larger forcing, like what is seen hemispherically with the seasons, will take even longer to equilibrate, with the initial temperature change over the first year being considerably larger than what is seen in the doubled CO2 case. -
muoncounter at 12:19 PM on 23 January 2011Monckton Myth #6: Global Sea Ice
#19: "a natural decline in maximum extent prior to recent AGW-related declines" Eric, the scale of your max extent graph in #19 shows a drop (the curve labeled NS) of less than 1 million sq km. The scale on the graph in #2 has the winter curve at 15-16 million sq km. So the pre-AGW variations you're talking about would appear on the scale of the noise on the large scale graph. You should also be looking for minimum ice extents (usually September). There are reconstructed data sets available. -
RW1 at 12:08 PM on 23 January 2011A Case Study in Climate Science Integrity
Moderator, OK, we'll take it over there. -
RW1 at 11:59 AM on 23 January 2011A Case Study in Climate Science Integrity
Robert S. (RE: 45), "During the winter (in either hemisphere) oblique angles and less time above the horizon means far less solar energy absorbed at the surface for that hemisphere than in the summer. Very basic stuff. The difference between absorbed solar in the winter vs. summer is much larger than the 4 Wm-2 imbalance from doubled CO2, and so it requires much less time to see a given temperature change deltaT. The hemispheres are no where near equilibrium and they don't need to be to see a large change in temperature." I know. The point is the proportional amount of change that occurs over such a short period of time is way too large to support years or decades to reach equilibrium. -
Eric (skeptic) at 11:56 AM on 23 January 2011Monckton Myth #6: Global Sea Ice
#17 Albatross, Monckton is wrong and I don't think there's anything more to say about it. But michael sweet insisted on using data prior to 1980 and implied that it is flat. #16 nigelj, I posted above because I am "skeptical" that the current record lows are all AGW in origin. Certainly the drop since 1980 has been exacerbated with arctic warming and local feedback especially in recent years. Also, with certainty, earlier declines were natural particularly in max extent (April graph above) as there were less severe winters after the 1880's. The AGW effects show up more in min extent since extent doesn't take into account thickness. #18 dhogaza, I think flat linear is not a good fit at least for maximum ice extent (perhaps better for minimum) because of harsher winters up to the end of the Little Ice Age. The Nordic sea ice extent data in this study http://journals.ametsoc.org/doi/full/10.1175/1520-0442%282001%29014%3C0255%3AAATOSI%3E2.0.CO%3B2 shows a natural decline in maximum extent prior to recent AGW-related declines (post this chart from figure 2).

This is local, not global, as I noted in #5. There is no accurate world wide data prior to the satellite era, just Nordic data and Russian data. -
RW1 at 11:51 AM on 23 January 2011A Case Study in Climate Science Integrity
Robert S. (RE: 45), "I think you're a tad confused. Tom is referencing the fact that a larger energy imbalance will lead to more dramatic temperature changes over a given amount of time than a smaller imbalance. Newton's law of cooling will teach you that; try sticking one cup of hot coffee in the freezer and another on the counter and wait ten minutes..." We are talking about equilibrium time. I'm well aware that a larger energy imbalance will lead to a larger temperature change over the same period of time than a smaller energy imbalance. That is not the issue. A better analogy is a large pot of water on the stove with the burner on low and the water temperature at equilibrium with the burner. If you turn up the burner from low to high, the equilibrium time is not accelerated as a result of the larger imbalance, though of course the final equilibrium temperature will be much higher. On the other hand, turning up the burner only a very small amount above low does not result in a longer equilibrium time, though of course the final equilibrium temperature will only be a little bit higher. In effect, what's being claimed here is that the far smaller imbalance from CO2 will take way longer to reach equilibrium than the much larger seasonal imbalance from the Sun, and that doesn't add up. -
Tom Loeber at 11:23 AM on 23 January 2011It's freaking cold!
Interesting, JMurphy. I read that article but have yet to look at the video. I find comments 15 and the last, 36, to be most cognizant without relying on character assassination which seems to make up the gamut of the rest of the comments. Appears the reason why he is still employed as he is relies on a reputation for largely having been correct in his analyses and predictions. Should we totally discount him for some mistakes when he has largely been proven correct? Regarding that last comment, #36, I use B99 in my truck and my Mercedes that is made from waste vegetable oil. I also ride my bike as much as possible for any short commutes. I am developing a wind mill that I think will bring the cost down as well as increase the areas that are feasible for reaping electricity from the wind. After all is said and done, me thinks actions speak louder than words. I have found that many cater to the idea that words speak louder than actions, incredible as it may seem.Moderator Response: [muoncounter] Further off-topic excursions will be deleted. -
dhogaza at 11:02 AM on 23 January 2011Monckton Myth #6: Global Sea Ice
"looking at the trend more closely year by year, your data shows a reasonable fit between declining sea ice which seems to start on average in roughly 1910 and rising temperaturs which also started significantly in around 1910." It does look as though a horizontal line would give a much better fit for the first 50 years or so of data on his graphs, especially the lower two which are June and August. If Eric wants to dispute this, maybe he'll run the regression for that period of time? Also, he's presenting data for three months for the nordic sea, only, and is presenting this as evidence of something ... global, apparently. -
Albatross at 10:54 AM on 23 January 2011Monckton Myth #6: Global Sea Ice
"Skeptics" on this thread seem to be missing the message and point here. It is really quite simple. This is what Monckton claimed: "[T]he global sea ice record shows virtually no change throughout the past 30 years, because the quite rapid loss of Arctic sea ice since the satellites were watching has been matched by a near-equally rapid gain of Antarctic sea ice." That statement has been shown by analysis of the data to be completely incorrect. So either you support Monckton's deceit and misinformation, or you support the facts. This is not an opportunity for "skeptics" to argue that sea ice decreased before or was lower before et cetera. Please take those arguments to the relevant threads. -
JMurphy at 10:53 AM on 23 January 2011It's freaking cold!
Well, Tom Loeber, I hope you now realise that it doesn't state what you thought it did ? More about Joe Bastardi from ClimateProgress. -
RobertS at 10:48 AM on 23 January 2011A Case Study in Climate Science Integrity
RW1, "We are talking about equilibrium response time - not rates of heating. Unless you want to argue that smaller increases in radiative forcing take longer to reach equilibrium than larger ones? If so, under what law of thermodynamics would this occur?" I think you're a tad confused. Tom is referencing the fact that a larger energy imbalance will lead to more dramatic temperature changes over a given amount of time than a smaller imbalance. Newton's law of cooling will teach you that; try sticking one cup of hot coffee in the freezer and another on the counter and wait ten minutes... During the winter (in either hemisphere) oblique angles and less time above the horizon means far less solar energy absorbed at the surface for that hemisphere than in the summer. Very basic stuff. The difference between absorbed solar in the winter vs. summer is much larger than the 4 Wm-2 imbalance from doubled CO2, and so it requires much less time to see a given temperature change deltaT. The hemispheres are no where near equilibrium and they don't need to be to see a large change in temperature. I apologize to the mods for continuing this off topic conversation. Great post though, Dana. -
Tom Loeber at 10:46 AM on 23 January 2011It's freaking cold!
Thanks for linking to the paper JMurphy. I just read it "Our discovery of an ecologically sudden demise and back-stepping signature in reef-crest deposits from the Yucatan is therefore compelling evidence for a sea-level jump with a similar rise rate during the late stages of the last interglacial. This jump implies that an episode of ice-sheet instability, characterized by rapid ice loss, occurred late during an interglaciation that was warmer than present." Wanted to see that video, Michael. Perhaps you could just post a direct link to it? I don't know. Watched that video Truevoice and I don't see how your and the article's conclusions match the evidence. -
Albatross at 10:36 AM on 23 January 2011The Climate Show #5: Green roofs and Brisbane floods
Camburn, I think you underestimate the satellite-derived precipitation data. Please read more about the SSM/I data and there validation. I'm afraid to tell you that rain gauge and radar (especially C-band) data are also fraught with problems, they are not the panacea that some think them to be-- I have worked with both platforms and can attest to the fact that they have issues. Yet, I do not dismiss the research done using them simply b/c they provide inconvenient or uncomfortable results. Regardless, I pretty coherent, robust and substantive picture is beginning to emerge with time using data from multiple, independent precipitation observation platforms. Further, the observations suggest that the models are likely underestimating the increase in precipitation intensity (see the papers by Zhang et al. and Wentz et al above). Please apply your "skepticism" properly and not uni-directionally. -
michael sweet at 10:11 AM on 23 January 2011It's freaking cold!
Sorry my link has been deleted. Apparently Accuweather does not like it when they are transparently stupid. Today Bastardi is showing a temperature chart of January over the USA and claiming that it shows the globe has cooled. -
Trueofvoice at 10:02 AM on 23 January 2011It's freaking cold!
Let's also not forget Bastardi's inability to recognize a temperature anomaly map early last year. Typing from an iPad, so I'll have to link the hard way: http://climateprogress.org/2010/03/24/accuweather-joe-bastardi-anti-science-meteorologist-sea-ice/ -
RW1 at 09:51 AM on 23 January 2011A Case Study in Climate Science Integrity
Tom (RE: 33), "RW1 @29, you seem to alleging that because a seasonal cycle which results in a 200+ w/m^2 variation in insolation at mid latitudes causes an appreciable change in temperature within a year, that therefore an approximately 4 w/m^2 forcing will heat the ocean to the equilibrium temperatue in less than a year." Not quite. I'm simply saying that the amount of ocean temperature change that occurs every year in each hemisphere would be impossible if the equilibrium response time to increases in radiative forcing were on the scale of years or decades. "You allege this despite the fact that the lower the difference between net energy in and out, the lower the rate of heating;" We are talking about equilibrium response time - not rates of heating. Unless you want to argue that smaller increases in radiative forcing take longer to reach equilibrium than larger ones? If so, under what law of thermodynamics would this occur? "and you allege this despite the fact that even for seasonal variations the ocean never reach the equilibrium temperatures associated with the maximum and minimum of insolation." I'm well aware the seasonal variations of the oceans never reach equilibrium; however, the rate and amount of heating that occurs is way too fast to be years or decades.Moderator Response: [muoncounter] Further discussion of ocean heating must go to the appropriate thread. Further discussion of laws of thermodynamics must to to that thread. -
michael sweet at 09:44 AM on 23 January 2011It's freaking cold!
Check out this video of Joe Bastardi to see how "accurate" he is. In it he criticizes the NSIDC for inaccurate graphs of the sea ice, compared to several other graphs. The actual issue is that Bastardi cannot read the graphs and is completely wrong. Bastardi also calls the ice area "close to average" when in fact it is close to the record lowest level. The NSIDC corrected him and he apologized. Anyone who cites Bastardi as a reliable source needs to learn how to read graphs. -
nigelj at 09:39 AM on 23 January 2011Monckton Myth #6: Global Sea Ice
Eric the Sceptic #5 Your graphs shows a decline in sea ice from around 1850 to the present, represented as a simple dashed straight line fit to the curve. A temperature or CO2 increase over the same period would show the same straight line fit as a rising trend. So what are you being sceptical about? Your data doesnt go back quite far enough, but looking at the trend more closely year by year, your data shows a reasonable fit between declining sea ice which seems to start on average in roughly 1910 and rising temperaturs which also started significantly in around 1910. Ice core data shows CO2 rising significantly from around 1880. Solar activity was also strong around 1900 to mid century and likely an influence. So I cant see why you being sceptical or what your point is. -
JMurphy at 09:34 AM on 23 January 2011It's freaking cold!
Tom Loeber, as already noted, your link (and the actual paper) does not back-up your interpretation. As Sphaerica writes, the melting mentioned in the paper is not stated as causing a rapid cooling, therefore your statement that "recent evidence that melting of the caps immediately preceeded major swings of the climate into major ice age conditions is another thing suggesting that warming leads to cooling" is not true. Not only is the "evidence" not recent (the paper being nearly two years old), it merely shows that ice-sheets melt when temperatures rise, leading to a rise in sea-level. And you don't need to read the paper to know that glaciations follow inter-glacials at regular intervals. -
Bob Lacatena at 09:33 AM on 23 January 2011It's freaking cold!
The Eemian interglacial period began about 130K ago and ended 114K ago. 121K is almost dead smack in the middle of that. The article was about sea level rise. If you go find the paper, I'm sure that you'll find it was about sea level rise. You are choosing to infer some correlation between ice melt, sea level rise and the onset of a glacial period. No such correlation is stated by either the article or the study in question, so it fails to support your position that the earth is going to start cooling. -
Tom Loeber at 09:30 AM on 23 January 2011It's freaking cold!
Sphaerica, thank you for at least partially admitting your error. I do wonder though at the idea that 121,000 years ago was " seven thousand years before the earth had descended into the next glacial period." Without referencing, that appears to contradict what I recall the quite well established record suggests. -
michael sweet at 09:27 AM on 23 January 2011Monckton Myth #6: Global Sea Ice
Jonathan @ 10: The graph I linked in number 1 shows the ice extent. The graph that you see first on Cyrosphere Today shows sea ice area. The extent is the amount of sea covered by more that 15% ice. The area is the total amount of ice only, so it is smaller. I think you are comparing the 2010 ice area to the ice extent in 1980. The NSIDC likes to graph sea ice extent (IJIS also graphs extent). Cryosphere Today likes to graph area. The two data sets are very similar in trends, but you have to be careful not to directly compare them. -
Bob Lacatena at 09:15 AM on 23 January 2011It's freaking cold!
Tom, 98. In looking back into the numbers (121K ago), they look like they were referring to what amounts to the last half of the interglacial as the "terminal phase." That said, this fell at the midpoint (the high point) of the interglacial. [I was confused because "terminal phase" is a term commonly used for the abrupt and extreme warming which marks the very beginning of an interglacial, but the end of a glacial period.] But the period discussed in the article was still seven thousand years before the earth had descended into the next glacial period. The melt was not the cause of the coming glacial, nor was it even a sign of an impending descent into a glacial period. It merely came at the point of peak temperatures, which also marks the beginning of the decline (which is triggered by changes in the earth's orbit, axial tilt, etc.), so the person quoted described it as a terminal period. You're interpretation of what was said is still incorrect. Melting Arctic ice is neither a cause nor a sign of impending cooling. -
Trueofvoice at 09:07 AM on 23 January 2011It's freaking cold!
Tom, Sphaerica knows exaxtly what he's talking about, your own comprehension is what is in question. An interglacial is a period during an ice age in which ice does not dominate the planet. This means the interglacial itself is a "terminal phase" of glacial dominance. You don't understand ice ages, you don't understand the terminology and you seem to be unaware of the difference between a newspaper and a scientific publication. Grab a copy of "The Physics of Glaciers", read it, then come back and we can discuss your difficulties.Moderator Response: [muoncounter] This thread is about cold weather as an aspect of or objection to global warming. Further discussion of ice ages belongs on We're heading into an ice age. -
Trueofvoice at 08:58 AM on 23 January 2011It's freaking cold!
Tom, So you didn't read it. Good to know. You still haven't responded to the fact at hand: you linked to an article which you claimed provided evidence of polar ice melt being linked to rapid cooling, when in actuality the article discussed melting due to warming during the previous interglacial. Your own link stands in complete contradiction to your assertion. At this point I can no longer tell if you simply don't understand the science, or are being deliberately obtuse. -
Tom Loeber at 08:47 AM on 23 January 2011It's freaking cold!
Sphaerica "during the terminal phase of the last interglacial period." You interpret that to not mean what it says? -
Tom Loeber at 08:46 AM on 23 January 2011It's freaking cold!
The article is reporting of a scientific publication. Even the publication itself is an article. "Did you even bother to read it? Trueofvoice, could you lay off of the ad hominem please? I don't think it adds to your credibility.Moderator Response: [Daniel Bailey] A simple question does not constitute an ad hominem. If you think it does, you should perhaps look the phrase up. -
Bob Lacatena at 08:41 AM on 23 January 2011It's freaking cold!
Tom, 94, You have completely misunderstood this quote from that article, and the context of the article."We constrain this jump to have occurred 121,000 years ago and conclude it supports an episode of ice-sheet instability during the terminal phase of the last interglacial period."
"The terminal phase" is the period immediately following a glacial period, i.e. a period where temperatures suddenly and abruptly warm, taking the planet out of (not into) a glacial period. "Terminal" refers to the end of the glacial period, not the end of the interglacial period. The article is discussing the rapid and large sea level changes which can occur during those termination events. That is completely the opposite of your interpretation:"I think the recent evidence that melting of the caps immediately preceeded major swings of the climate into major ice age conditions is another thing suggesting that warming leads to cooling."
-
Trueofvoice at 08:41 AM on 23 January 2011It's freaking cold!
Tom, Your link is to a newspaper article, not a scientific publication. More importantly, the article is regarding rapid sea level rise during the previous interglacial. It says nothing about melting ice caps initiating an ice age. Did you even bother to read it? -
Tom Loeber at 08:32 AM on 23 January 2011It's freaking cold!
Hi JMurphy. "We constrain this jump to have occurred 121,000 years ago and conclude it supports an episode of ice-sheet instability during the terminal phase of the last interglacial period."
-
Tom Curtis at 08:31 AM on 23 January 2011Monckton Myth #6: Global Sea Ice
MikeCoombes @13, here is the graph of global sea ice area Tamino reproduces in the update linked in the main article: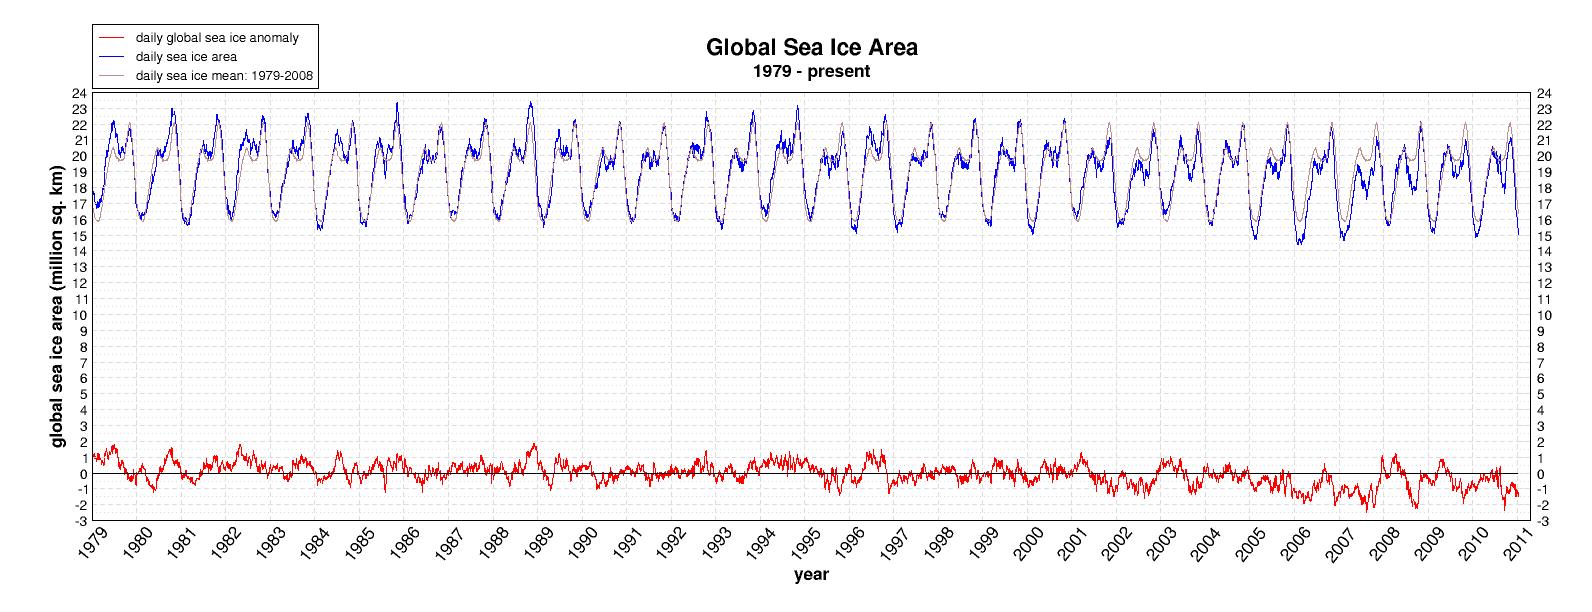 By eyeballing the graph, I estimate the annual average sea ice area is around 19-20 million square kilometers. The sea ice area anomaly over the last few years has averaged (by eyeball) around -1 million square kilometers, which represents a 5% decline. The sea ice extent anomaly seems to be of similar magnitude, ie, around a 5% decline.
Given that, are you inclined to agree with Monckton, or James Wright and Tamino?
By eyeballing the graph, I estimate the annual average sea ice area is around 19-20 million square kilometers. The sea ice area anomaly over the last few years has averaged (by eyeball) around -1 million square kilometers, which represents a 5% decline. The sea ice extent anomaly seems to be of similar magnitude, ie, around a 5% decline.
Given that, are you inclined to agree with Monckton, or James Wright and Tamino?
-
Bob Lacatena at 08:29 AM on 23 January 2011It's freaking cold!
Tom, 91,all of that last post of yours appears to be an attempt to deride my character
Not your character, I am deriding the quality of the information you post and the debate tactics that you use to present it....you wont look at Bastardi's presentation of satellite data...
Something written, yes. Video blogs, no. If you make a claim, and someone requests a cite, you are obliged to comply or else your statement must be dismissed as unsupported by evidence. So far, several people have asked you for cites, and you have not complied once....you claim to know his stance exactly.
I never made any such claim. He is a well known AGW denier. I've seen any number of false and misleading statements by him. I have never seen a truthful or well reasoned statement by him. There are any number of people who have achieved the status of untrustworthy in the subject of climate science, and for me he's one of them. I will not waste my time looking at his claims until he succeeds in publishing a paper in a peer reviewed journal. Until then, it's just another guy coming up with crazy theories based on an incomplete and incoherent background in science. But so far, what you've presented is that you like his statements, and to you they seem true, so everyone else should accept that. My position is that you have presented only (1) his claims and (2) false statements, or (3) true statements which either fail to actually support his position or else simply confuse the reader. You're going to have to do better than this if you want to succeed in making a valid point.
Prev 1944 1945 1946 1947 1948 1949 1950 1951 1952 1953 1954 1955 1956 1957 1958 1959 Next


