


 Arguments


Recent Comments
Prev 1945 1946 1947 1948 1949 1950 1951 1952 1953 1954 1955 1956 1957 1958 1959 1960 Next
Comments 97601 to 97650:
-
curley hippy at 02:30 AM on 9 February 2011Newcomers, Start Here
Recently in the UK there was an episode of the brilliant bbc science series Horizon called Science under attack (I recommend trying to track it down and watch it). It concentrated mainly on the climate change argument and why it is under such scrutiny in the press and among people on the internet. It raised a good point that scientists need to do more to get there arguments across in the press and this website seems like an excellent tool for doing this. Are you doing anything to get this information out there? Are you the top link in google searches on these topics for example? I realise that it's easier said than done but I think promoting this website and it's content is very important -
Albatross at 02:28 AM on 9 February 2011Crichton's 'Aliens Cause Global Warming'
RSVP, "The issue is not about whether CO2 causes global warming, rather that science is used to establish authority, and therefore policy, and therefore power." Nonsense. This is fallacy and transparent strawman and it is getting incredibly tiresome. And it is about time 'skeptics' were called out on it. Chris Colose made this very apt and insightful post yesterday (originally posted here), and it calls the "skeptics" on their game-- "What is clear to me is that climate scientists are now being held to standards which are not typical of any scientific discipline, or for that matter, held to standards which skeptics do not want to put upon themselves. On the first point, it is now apparently perceived as “bad” when scientists come to a conclusion that is robust enough to be well accepted by the majority. I have never seen claims of the sort that “gravity people” are engaging in indoctrination, or the indoctrination of cell theory, the indoctrination of soil science, or the dogma of electrons. Strangely, this only applies to conclusions about climate change, or maybe evolution (and especially in America). In most fields, consensus is thought of as a consequence of a convergence of evidence over time in a particular subject-matter, and one goes to authorities (doctors for medical diagnosis, lawyers for legal advice, etc) for insight. Most people seek the explanation with the most support, which is then echoed by the experts in the field. Some, on the other hand, will leave 100 doctors that give them a certain diagnosis, and then approve of the one that tells them to meditate, take secret forest herbs, and pray five times a day to cure their illness. People go to calculus textbooks to learn calculus, and yet no one goes to an sociologist to learn by the segments of the heart and brain. However, in climate science, apparently ‘authority’ is a logical fallacy, and textbooks and classrooms can be replaced by random opinions on a blog. What’s even more startling, is that the personal communiation of scientists through e-mails can actually change the laws of physics! What all of this shows is that many people simply cannot think rationally about climate change, nor do they have the capacity to diagnose proper information from nonsense. And once they pursue nonsense, it is very difficult to convince them that they are wrong. You cannot convince such people that Pat Michaels, Singer, Marano, etc don’t actually have anything to say, or that WUWT is a disinformation source. It’s not that the information to show they are nonsense is unavailable, it’s that the information MUST be wrong. It is also clear to me that climate scientists must now become babysitters to every half-baked idea out there, otherwise they are being dogmatic. They must write detailed responses to people who think the greenhouse effect isn’t real. It is also clear to me that the so-called ‘skeptics’ are allowed to make up whatever they want at will without consequence, and create a large but ill-thought out laundry list, and that we must play this game or else we’re being ‘dogmatic.’ If a climate scientist make one mistake, or a date gets screwed up in the middle of a 1000 page document about glaciers, it will receive international attention. However, if ‘skeptics’ toss out 8 conspiracy theories, 10 logical fallacies, and 17 arguments with ZERO thought put into them, then it is a good thing that we get to hear all sides. Then, when one item on the bucket list is knocked down, they can just jump tot he next item. In the meantime, they are just as valid as everyone else’s idea, since the criteria for acceptance is 101% certaintly in everything." Bravo! -
Dikran Marsupial at 02:25 AM on 9 February 2011Crichton's 'Aliens Cause Global Warming'
RSVP@9 wrote "If an investigation or study is based on accepted "science", it cannot be adding anything new." No, most science proceeds in a rather incremental manner, based on accepted adeas and adding a novel extension, which often is rather small and so easily digested by the research community or based on a novel combination of accepted ideas that hadn't previously been considered. Science mostly proceeds via small steps by dilligent but unexciting work. The general public often don't get to hear about that sort of work as it doesn't have much appeal for the media, but that doesn't mean it doesn't happen or that it isn't the way the majority of science works. "And if it is adding something new, this new discovery has not yet become "accepted" science." See above, most of the time the extension is small and well supported by the paper and hence (if useful/relevant in the first place) is accepted almost immediately. The papers that take a long time to become accepted are those that (assuming they are correct) require a considerable change in current thought or are presented without adequate experimental or theoretical support. As they say, extrodianary claims require extrodinary evidence. "if it isnt based on accepted science, it likely to be bogus" Most claims that accepted science needs to be overturned *are* bogus. Every now and again you will get someone turning up to a physics department with proof that Einstein was wrong, or maths department with a short proof of Fermats last theorem, etc. But for every Einstein, there are a thousand Dunning-Kruger eccentrics. "even if the petrolium should never run out, the oxygen will" interesting suggestion, care to expand? -
Bernard J. at 02:23 AM on 9 February 2011Articgate: perpetuating the myth that Arctic sea ice has recovered
...and Mouncounter's (and my) graphic as it stands today is here. -
Bernard J. at 02:20 AM on 9 February 2011Articgate: perpetuating the myth that Arctic sea ice has recovered
For the record, I've just noticed that Stu N's graphic link will automatically update to the latest data, and eventually wander away from the current point. Today's graphic, as posted by Stu, is cemented here. -
dorlomin at 02:15 AM on 9 February 2011Climate Change Impacts on Ocean Ecosystems
why has the ph in the Atlantic changed so much quicker than other bodies? -
Bernard J. at 02:13 AM on 9 February 2011Articgate: perpetuating the myth that Arctic sea ice has recovered
Muoncounter at #19. Ironically, I posted the same graph at Deltoid yesterday. It's important though to be very clear about distinguishing between 2006 and 2007, with respect to the winter maxima, and Stu N made this point for me when I myself skipped over it. I was more concerned about the overall trend compared to 2007, and where it is heading, but if we're not careful it's quite possible that we could be accused of the sort of cherry-picking that Peter Gleick indulged in. That's one mud-hole I don't want to be wallowing in! -
Bibliovermis at 02:07 AM on 9 February 2011Crichton's 'Aliens Cause Global Warming'
New science becomes accepted science through the presentation of complete evidence, not whining about being the victim of the status quo. -
RSVP at 01:53 AM on 9 February 2011Crichton's 'Aliens Cause Global Warming'
Crichton's lecture was not in defense of science, but in pointing out opportunism. The issue is not about whether CO2 causes global warming, rather that science is used to establish authority, and therefore policy, and therefore power. This point aside, a very circular condition seems to emerge here. If an investigation or study is based on accepted "science", it cannot be adding anything new. And if it is adding something new, this new discovery has not yet become "accepted" science. (And in the worst of cases, if it isnt based on accepted science, it likely to be bogus.) On the otherhand, there are also things that do not require science to be known. For instance, even if the petrolium should never run out, the oxygen will. So at some point, regardless of global warming, alternative forms of energy will take over. -
mozart at 01:39 AM on 9 February 2011CO2 is not increasing
Ten years ago we would have said the curve was flat....and it's an odd explosive growth model that has it's highest observation 13 years ago in 1998.Moderator Response: [Daniel Bailey] Not at all flat; current levels are the highest in over 400,000 years (you must be looking at the South Pole station data curve):

-
Global Warming and Cold Winters
mozart - I have replied to your last post in the thread here. Note that the "Recent Comments" link at the top of the page will take you to current conversations - most people monitor that, so moving to another thread doesn't mean that current readers will lose track of the conversation. However, new readers will actually be able to find relevant posts if you stay on topic. Please respect the Comments Policy and stay on topic, commenting on relevant threads. I'm actually quite surprised your last few comments have survived moderation, considering how you have failed to stay on appropriate topics despite requests. -
CO2 is not increasing
mozart - Reply here, as it's a much more appropriate thread. It's well worth reading the topic, also see the video in post #9, also graphs in #12, and in particular #17. Exponential growth has a nasty effect of slamming in hard down the line, much more people expect. Your CO2 emissions scenarios are grossly overoptimistic. -
Arkadiusz Semczyszak at 01:00 AM on 9 February 2011Climate Change Impacts on Ocean Ecosystems
@Ann Period in many parts of the world, certainly warmer than the present-called Older Peron, this is period known in many cultures 'paradise': “At least a few commentators — anthropologists, folklorists, and others — have linked era of the Older Peron transgression and the Neolithic Subpluvial with tales of a "time of plenty" (Golden Age ; Garden of Eden) that occur in the legendary backgrounds of many cultures.” Enhanced biological carbon consumption in a high CO2 ocean, Riebesell et al., 2007. : “Here we show that dissolved inorganic carbon consumption of a natural plankton community maintained in mesocosm enclosures at initial CO2 partial pressures of 350, 700 and 1,050 atm increases with rising CO2. The community consumed up to 39% more dissolved inorganic carbon at increased CO2 partial pressures compared to present levels, whereas nutrient uptake remained the same.” Briefly about the lands: more efficient photosynthesis takes place at higher temperatures and CO2 - see figure here. Commentary on the figure quoted above is as follows: “The upper curve is the same for C4. From this it is clear that at double CO2 concentration, not only has the efficiency of C3 crops improved tremendously, but the temperature at which optimal photosynthesis occurs in C3 increases up to that of C4. Thus the vast majority of food crops will benefit hugely by increased CO2, and even more so by increased CO2 coupled with warming” In many parts of the ocean current was noted a significant increase in NPP. However, the NPP of the ocean yet we know very little ( Pratt, 2010.). Hoegh-Guldberg conclusions are strongly premature.Moderator Response: [Daniel Bailey] Problems with Riebesell et al 2007 have been noted (in abstract form here and in full text form here). As far as your next bit, partaking of material sourced to an extreme denialist blog is disappointing, Arkadiusz. Original peer-reviewed published sources are best for credibility. -
mozart at 00:52 AM on 9 February 2011Global Warming and Cold Winters
KR just a small addendum to your thought on doubling CO2. We have already increased CO2 by 24% since 1900 with a very modest effect on temperatures....that's a known relationship. So I see little reason to ignore that and go back to a pre industrial revolution base. What's of interest is the the likely future growth of Co2 and the temperature sensitivity to those changes. On the former point I would direct you to the Mauna Loa measurements...http://www.esrl.noaa.gov/gmd/ccgg/trends/. If you split the CO2 trends into decades, you find an average 81/90 of 1.545..91/2000 of 1.543....2001/2010 of 2.039 ppm per year increase. So we actually had a flat decade in the 90s, where CO2 was accumulating no faster than the 80s. A volcanic phenominon? In any case if you then include the 2000s, it would not be unreasonable to say we seem to be accelerating growth at a smoothed trend of 0.25 ppm per decade. At that rate it would take us 8 decades to get to a 4ppm per year increase. But many factors could intervene....slower global growth rates than in this China phase, carbon efficiencies per unit of energy, and the loss of our oil reserves. All of which would extend this number. -
muoncounter at 00:42 AM on 9 February 2011Articgate: perpetuating the myth that Arctic sea ice has recovered
#25: "I don't think anyone can seriously claim ... " That is really a multi-part statement. The claims are made: See the quote at the top of this post. Greenland glaciers have been advancing since 2006, Artic [sic] sea ice has returned to 1989 levels of coverage, and snowy, cold winters and cool summers have dominated northern North America and Europe The serious aspect is that these claims get repeated. People who don't bother to verify hear 'famous astronaut says' and their brains switch off. Then the amplification process begins: 'as everyone knows, the Artic has recovered'. That the claims are so easily shown to be false shows how impoverished the denier arguments are. -
Daniel Bailey at 00:35 AM on 9 February 2011Climate Change Impacts on Ocean Ecosystems
@ Ann (6) I know how you feel, for those thoughts have been my thoughts. It would be easy to sink into a morass of despair, overcome by the overwhelming nature of what lies before us. Why even try... Consider this, then:Once upon a time there was a wise man who used to go to the ocean to do his writing. He had a habit of walking on the beach before he began his work. One day he was walking along the shore. As he looked down the beach, he saw a human figure moving like a dancer. He smiled to himself to think of someone who would dance to the day. So he began to walk faster to catch up. As he got closer, he saw that it was a young man and the young man wasn't dancing, but instead he was reaching down to the shore, picking up something and very gently throwing it into the ocean. As he got closer he called out, "Good morning! What are you doing?" The young man paused, looked up and replied, "Throwing starfish in the ocean." "I guess I should have asked, why are you throwing starfish in the ocean?" "The sun is up and the tide is going out. And if I don't throw them in they'll die." "But, young man, don't you realize that there are miles and miles of beach and starfish all along it. You can't possibly make a difference!" The young man listened politely. Then bent down, picked up another starfish and threw it into the sea, past the breaking waves and said, "It made a difference for that one."
********************************************************************************* There is something very special in each and every one of us. We have all been gifted with the ability to make a difference. And if we can become aware of that gift, we gain through the strength of our visions the power to shape the future. We must each find our starfish. And if we throw our stars wisely and well, the world will be blessed. So be proud in what you do, daily. Lead boldly, walk with confidence, chin high. Pay it forward, save a life today. Make a difference, one starfish at a time. The Yooper -
Eric (skeptic) at 00:30 AM on 9 February 2011The 2010 Amazon Drought
Chris, I think it is too soon to tell if there is a trend in El Ninos getting stronger or more numerous. There seemed to be one in the 90's (minus Pinatubo) but that quieted down. Rob, I never doubted the strength of the correlation between El Nino and drought. That is simple causation as explained in the head post. Also I don't doubt that AGW will exacerbate the drought in some cases, specifically when Atlantic warming coincides with El Nino. Here's a paper http://www.springerlink.com/content/8415720180780275//fulltext.html that quantifies North Atlantic warming trends to supplement the Zeng paper. Their conclusion is 0.03 C per decade. -
Ken Lambert at 23:33 PM on 8 February 2011A Flanner in the Works for Snow and Ice calculations
MarkR #38 Its time to put some numbers on these arguments. We know for a doubling of pre-industrial CO2 to about 560ppm, the theoretical IPCC Eqan gives a F.CO2 of about 5.35ln(2) = 3.7W/sq.m. We know that Earth exchanges about 240W/sq.m with space averaged over the entire surface. ie. TSI/4 x 0.7. We know that the Earth has warmed about 0.75 degC at the surface since preindustrial times and the radiating temperature to space is about 255degK. So if we raise the radiating temperature by 1 degK then the S-B forcing will be proportional to T^4. The sum is roughly (256/255)^4 x 240 = 243.78W/sq.m, Difference 3.78W/sq.m. What we don't know for sure is what the temperature rise at the surface will be for a 1degK rise in the effective radiating temperature of the Earth. The suggestion is that 3degK will occur at the surface to cause 1degK at the effective radiating height in the atmosphere at which point (all other things being equal), the imbalance gap closes. This supposes an extra insulating effect in the atmospheric column of about 2degK due to the complex feedbacks of CO2 and WV, clouds, ice albedo etc at a CO2 concentration of about 560ppm. Interestingly enough Dr Trenberth suggests a S-B radiative cooling response of 2.8W/sq.m currently for a 0.75degK increase in surface temperature since AD1750. This coincides with a 0.75 degK increase in the Earth's radiating temperature via the simple sum (255/254.25)^4 x 240 = 242.84W/sq.m. Difference 2.84W/sq.m. This seems to suggest that for the first 0.75 degC of warming at the surface there has been no insulating effect at the Earth's radiating height or we would have seen a smaller temperature rise at that point than 0.75 degK if this CO2-WV enhanced effect has caused some of this warming so far. -
John Bruno at 23:29 PM on 8 February 2011Climate Change Impacts on Ocean Ecosystems
Thanks PM, KR and others. Maybe I'm wrong, but I think knowledge IS part of the solution, which is what SkepticalScience is all about. I know we need tech, policy action and social change, but I think this is coming, e.g., Obama to regulate greenhouse gases via EPA. I actually see all this playing out with a happy ending - but I am a pathological optimist... -
JMurphy at 23:16 PM on 8 February 2011Medieval Warm Period was warmer
hengistmcstone, you may be interested in reading another article on here : Was there a Medieval Warm Period? There, you will find a link to : Global Signatures and Dynamical Origins of the Little Ice Age and Medieval Climate Anomaly There is also a link to the press release of the above paper, which may be worthing looking at before you look at the actual paper. More reading, I'm afraid ! -
MarkR at 23:15 PM on 8 February 2011Articgate: perpetuating the myth that Arctic sea ice has recovered
#25: 'As predicted' is loaded, projected changes in Arctic ice include a full range with associated uncertainty. The possibility of further area collapse was mooted, but was far from a mainline prediction as far as I can tell. Here's a paper from '07 where they help explain it. 2007 was far below model projections and since then we've stayed below model projections. Phil Jones said no statistically significant warming at the 95% confidence level from 1995-2009. It is now (using '95-'10) statistically significant at that level. This is from the HadCRUT3 dataset which is only an atmosphere/surface measurement. If you look at ocean heat content, or latent heat invested in melting ice, or sea level (which integrates over those) then up to 2003 global warming was obvious in all of them. Since '03 we've seen significant rises in sea level and loss of ice, plus probably in abyssal warming, but perhaps not in 0-700m ocean heat content. Total polar ice is not decreasing? The data say that it is. Sure, Monckton and some other skeptics say otherwise, but I tend to run with the data. Antarctic sea ice is covered elsewhere on here. :) -
rayinkorea at 22:52 PM on 8 February 2011Ice age predicted in the 70s
...so we still wait for the name of the elusive institution of learning thepoodle went to ? I was a science major (starting in 1977) at the University of South Florida... (Tampa and St. Pete campuses) and we were learning about global warming in 3 of my classes I remember .. Ecology and both Biological and Geological Foundations of Oceanography ... talking about the physics and looking at the CO2 level data from Mona Loa and some temperature prediction models (which turned out to be remarkably accrate, I might add) It was even mentioned in my high school Biology class in 1975 (Kaiserslautern American High School, Germany) I don't remember anything about global cooling except a few referrals to media coverage .... -
Climate Change Impacts on Ocean Ecosystems
Thanks John Bruno for posting the talk. Very thought provoking, amazing that this information rarely makes headlines -
rhjames at 22:39 PM on 8 February 2011Articgate: perpetuating the myth that Arctic sea ice has recovered
I don't think anyone can seriously claim that Arctic ice has recovered. However, it hasn't continued to decrease since 2007 as predicted. We also have to consider Antarctic ice, which has been increasing for 30 years. We can't just be selective about the Arctic because it's convenient. We have to accept that, as Phil Jones said, there's been no significant warming for the past 15 years. Also total polar ice isn't decreasing. We have to be careful about the North West Passage being open - this isn't unusual - it's been open plenty of times in the past - before we had satellite measurement of polar ice. We need to be realistic about the claims we make. -
Riccardo at 22:01 PM on 8 February 2011Climate Change Impacts on Ocean Ecosystems
Ann you envision a possible tragedy, not the necessary outcome. The path out of this mess is clear and although apparently the will to follow it is lacking, the word "end" has not been written yet. Wars are won or lost in the long run. In any event, it is our personal duty to do the right thing, whatever it takes, whatever happens around us. We can not abdicate, we're not given this possibility. -
BillyJoe at 21:49 PM on 8 February 2011Articgate: perpetuating the myth that Arctic sea ice has recovered
#22 les, Seriously? You think they want to engage with science? Google "Harrison Schmitt" to view his business, political and organisational connections. I think you are being a little naive. There is every evidence that this guy is pushing an agenda and he doesn't care what data he dregs. Obviously you are just not up to his level of [self censored] -
Riccardo at 21:17 PM on 8 February 2011Articgate: perpetuating the myth that Arctic sea ice has recovered
Philippe Chantreau #21 I strongly agree that talking in terms of standard deviation is meaningless, the null hyppthesis being that there's no trend. But we know that the trend is there and the null hypothesis should be that there's no change in the trend. -
Ann at 21:14 PM on 8 February 2011Climate Change Impacts on Ocean Ecosystems
This is a scenario enrolling in front of our eyes that is almost exactly as I feared. Also we are beginning to see the impact of climate change on humanity: steeply rising food and energy prices (which is annoying for the wealthy nations, but a disaster for the poorer nations), social unrest, climate fugitives, a mounting number of starving people, a mounting number of casualties from natural disasters. And we are only seeing the very beginning. I think in hindsight, 2010 will go down in history as the year of the truth. The year the truth could no longer be denied. I have always been interested in history, and have always realized – contrarily to most of the people in the wealthy nations – that our current welfare and security are rather an exception in the history of mankind, and that this state of affairs may not last. Future generations – perhaps even the children living today – are going to have a hard time. Of course, the question is: what to do with this knowledge ? It is the single most important issue of our time, probably the biggest issue in the history of mankind. How can I continue going to work every day – solving some minor issues with our digital TV product or designing new features, new ways to make people spend some more money on TV - when this massive problem is lurking in the background ? It makes all human activity futile. International politics has failed utterly and totally. What are the other options ? To convince the world population, the people, what is happening and that immediate action is necessary. But as we experience, even educated people are hard to convince. In fact the problem is that people must almost have had a scientific training before they can understand the available evidence. And there are many people in this world that can hardly read or write. They are doing what they always do: do whatever it takes to survive. Choice is is a luxury, only available to the wealthy. What are we going to tell these people ? I don’t think mankind will go extinct. But in the future the global population will no longer be measured in billions – perhaps in millions. Perhaps those that survive will have learned the lesson and adopt another attitude towards the environment they live in and depend upon. One slight consolation is: nature will recover eventually. Nature is incredibly strong. Life survived the Perm-Trias mass extinction event, I am sure it will survive the human plague as well. But that is the extreme long-term vision.Moderator Response: [Daniel Bailey] See my response to you below @ 10. -
les at 20:50 PM on 8 February 2011Articgate: perpetuating the myth that Arctic sea ice has recovered
#20 John, Seriously? You think this is a low level? google "Pole Shift Threatens To Cause Weather Chaos prison planet" I think you guys are being unkind, though. There is every evidence that these folk really want to engage with science - the driving force of the modern era. Obviously they're not up to it, find it all a bit hard and confusing and, therefor, scary... -
Philippe Chantreau at 19:43 PM on 8 February 2011Articgate: perpetuating the myth that Arctic sea ice has recovered
Actually muoncounter, the shaded area around the average line is 2 standard deviations, so the current year would be more like 4 standard deviations below average. It is so far from average that talking in terms of standard deviation becomes kinda meaningless. I am wondering how, or if our usual skeptic contributors can possibly explain the thought process and motivations behind statements that are so glaringly wrong. What was Schmitt thinking? -
XPLAlN at 19:43 PM on 8 February 2011Crichton's 'Aliens Cause Global Warming'
"Crichton fails to see that the processes that formed the current paradigms in medicine and geology (and overturned the old ones) are same processes that have formed the consensus on climate change. The consensus used to be that human activity is too insignificant to alter the climate." Precisely. I've been working on a book like Crichton's Jurassic Park. In it, future entrepreneurs clone a Lindzasaurus Rex and a Spencerdocus from some blood retrieved from the talons of a preserved beardy-activiraptor who perished during the mass extinction at the AGW boundary. Er, on planet Earth. Anyway, although the two dinosaurs never escape, their logic leaks onto the galactinet. To cut a long story, Sam Neil saves everyone. -
Marcus at 17:32 PM on 8 February 2011How We Know Recent Global Warming Is Not Natural
Another point, Pirate. When climate change occurs naturally, CO2 *does* lag warming-within fairly well-defined bounds (between 200ppm & 280ppm). Between 1950-2010, though, CO2 rose *before* a significant rise in temperature can be detected. i.e. CO2 rose slowly throughout the entire 20th century, but the real upswing in temperatures doesn't begin until the 1970's. At the very least, CO2 increased precede the current warming trend by a good 20-40 years. Again, can you give us a *natural* cause to explain this? I doubt it. As to Milankovitch cycles, these operate on a time frame of *millenia*, not decades, & the next part of the cycle is meant to take us *away* from the sun-causing cooling-at least about 3,000 to 5,000 years from now. -
Marcus at 17:27 PM on 8 February 2011How We Know Recent Global Warming Is Not Natural
#49: "climate has regularly cycled through glacial and interglacial periods." Yep, that's true-but those cycles have been driven by extremely large increasing in Total Solar Irradiance-due to changes in the Earth's orbit-followed by CO2 as a positive feedback after TSI peaks. TSI over the past 60 years has-if anything-been trending *downwards*, so cannot explain recent warming. Also, these past cycles occurred over a period of *tens of thousands of years*. When you really think about it, even a +8 degree change in temperature-over the space of even 10,000 years, amounts to an average of only +0.03 degrees per decade. Recent warming has occurred at a rate of +0.12 degrees per decade for 1950-2010 & +0.16 degrees per decade for 1980-2010. Now, if you can show me a *natural* cause for such rapid warming, I'd be very interested to hear it-but simply attributing it to "currently unknown natural cycles", without supporting evidence, just ain't gonna cut it! -
Bern at 17:02 PM on 8 February 2011Latest GRACE data: record ice loss in 2010
As a point of comparison, I did some back-of-the-envelope calcs. How does 600 billion tons of ice mass loss over the 2010 melt season compare to the flooding we had here in Brisbane in January? Well, the 2010 melt season went from "end of April" to "mid September", by one account I found. So, taking 30 April to 15 September, that's 138 days. A bit of simple arithmetic comes up with a number of about 50,000 m3 per second average rate of loss (yikes!). The flood here peaked at around 9,500 m3 per second, I believe. This means that Greenland was losing ice at an average rate more than five times greater than the 2011 Brisbane flood. Except instead of lasting three or four days, it went on for four and a half months... Yes, I know I'm comparing an island more than a quarter the size of Australia with one river catchment, so the comparison is largely meaningless, but it helps put it into perspective! -
mozart at 16:38 PM on 8 February 2011Global Warming and Cold Winters
Phil I have no problem with moz, but I appreciate the distinction you are making. -
John Brookes at 15:06 PM on 8 February 2011Articgate: perpetuating the myth that Arctic sea ice has recovered
The claim about arctic sea ice seems to be totally disingenuous. Who would have thought that AGW skeptics would stoop to such levels? -
Rob Painting at 14:52 PM on 8 February 2011The 2010 Amazon Drought
Eric @ 27 - Reading through the Zeng paper (link in 20) I noticed that Zeng cannot separate the Atlantic warming from ENSO From the Zeng paper (page 7): "In 2005, both ENSO and SATL (tropical South Atlantic) are weak but a warming North Atlantic led to the drought." The main point from the Zeng paper, was that the 2005 drought was made worse by the drying induced in the preceding years (2002-2004) by El-Nino. They also point out that Amazonian drought is amplified if the warm sea surface temperatures occur in both the Eastern Pacific and tropical Atlantic at the same time, or as in 2002-2005 in sequence. It is also true that El Nino does not always cause Amazon drought Not 100% of the time, but the correlation is very robust. Seems to me that you are looking for reasons to not accept the finding of dozens of peer-reviewed studies on this topic. -
muoncounter at 14:21 PM on 8 February 2011Global Warming and Cold Winters
#137: You're right, Phil, bad judgment on my part. -
muoncounter at 14:18 PM on 8 February 2011Articgate: perpetuating the myth that Arctic sea ice has recovered
Here's the current NSIDC graph: Can anyone find a cherry to pick from this? The current year is more than 2 stddevs below the average and below 2006-2007, which was the worst year in the record.
-
scaddenp at 14:17 PM on 8 February 2011The IPCC consensus is phoney
Was the text reviewed by peers (if you are willing to have Vince Gray as a peer...)? Yes. Far more rigorously than a journal publication which only has a few reviewers. Furthermore, it's transparent in the sense that can go to IPCC website and read what every reviewer said as well as the editorial response. As a glance at the list of reviewers would show, it is also not just a group of cronies. What possibly could the IPCC do to provide a higher standard? I wonder if SPPI and Heartland would like to adopt a similar process. -
scaddenp at 14:07 PM on 8 February 2011Global Warming and Cold Winters
muoncounter - in interests of politeness, calling him "moz" is just heading down same road as "albie" and "Danny". I think it leads to an antagonist debate rather than encouraging respectful one (and yes, I know it's pot calling kettle black, but I am trying). -
muoncounter at 13:54 PM on 8 February 2011Global Warming and Cold Winters
#134: "if we follow this line of reasoning we should have seen a succession of colder winters." Mozart, what a wonderful world you must live in, where things always behave in such a linear progression. "We can't even discern any trend towards colder winters." Depends on how you look at things. Consider, for example, that the March maximum of sea ice extent doesn't decrease as rapidly from year to year as the September minimum. It must therefore be the case that each winter's freeze-up, starting from a lesser extent and winding up at about the same maximum extent requires more aggressive freezing during the winter. Could that be a trend towards colder winters in the Arctic? Of course, the succeeding melt season is necessarily even more aggressive; could that be a trend towards warmer summers? (If you care to look, you can find all the support you need for these observations on various Arctic ice threads here at SkS). Egads, both warming and cold winters? How cognitively dissonant of our unhappy climatic system, requiring that we keep two conflicting ideas in our aching heads at the same time. But that's why you can't just dismiss a 'nice theory, elegant almost' with mere hand-waving. That is, if you enjoy credibility. -
Rovinpiper at 13:27 PM on 8 February 2011The IPCC consensus is phoney
Can an IPCC assessment report be correctly called a peer-reviewed publication? -
dana1981 at 13:11 PM on 8 February 2011How We Know Recent Global Warming Is Not Natural
Thanks Kate (this one's mine, not John's). -
MattJ at 12:54 PM on 8 February 2011Climate Change Impacts on Ocean Ecosystems
Just knowing does not do any of us any good. We have to be able to take realistic action based on that knowledge. Unfortunately, we have failed to persuade the people who are actually in any position to throttle back the enormous burps of CO2, and the case of phytoplankton die off makes it clear we are already too late, especially too late to rely on the slow methods of democracy. Meanwhile, the Koch brothers are hard at work turning back what little progress we did make in the States against AGW. Therefore, I now think the best hope for the survival of the human race comes down to one of three very unpleasant options: 1) nuclear winter. But come to think of it, I am not even sure that the latest climate models even agree with the earlier ones, that this would do the trick 2) an alliance between Earth Liberation Front and Al Qaeda to steal that rotting tomato can from the former Soviet bio-weapons lab and deploy the 90% fatal disease it contains 3) the billionaire grandsons of plutocrats like the Koch brothers figure out how to transfer their memories and consciousnesses into genetically engineered cockroaches, since cockroaches can survive anything. But even they would have trouble with the oncoming onslaught. Of course, I am sure none of us would want to see the sole surviving slice of humanity come from -that- class! -
Phila at 12:51 PM on 8 February 2011How We Know Recent Global Warming Is Not Natural
Pirate: I'm on record of saying that I am willing to consider CO2 as a contributor to global warming. You are? Really? Wow. That's a pretty impressive concession for a teacher of environmental science to make. Let us know when you get around to accepting it. -
scaddenp at 12:25 PM on 8 February 2011Global Warming and Cold Winters
Mozart - "albie" and "Danny" are somewhat impolite ways to refer to other posters. I'm Phil, by the way. On topic, the paper in question looked at a mechanism by which the changing albedo in arctic sea (recent) could impact on the arctic polar circulation. The effects are local to parts of Europe and parts of US. The data is drawn from that corridor, and yes, overall, europe and US are warming like the rest of the world. I think the paper is interesting, plausible, but I agree that the time period is way too short for any evaluation of this account for what is a weather rather than climatic phenomena. The point of paper is that colder winters in some parts of the world are not necessarily at odds with the overall rising global temperatures. -
Michael T. at 12:19 PM on 8 February 2011Articgate: perpetuating the myth that Arctic sea ice has recovered
Here is the NSIDC graph of April Arctic Sea Ice Extent from 1979 to 2010 showing a clear longterm decline in extent even since 1989: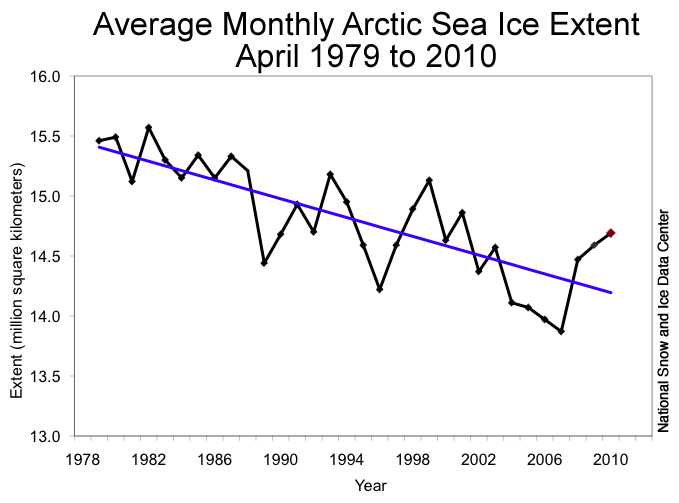 Moderator Response: [Daniel Bailey] Fixed URL.
 -
Daniel Bailey at 12:09 PM on 8 February 2011Climate Change Impacts on Ocean Ecosystems
Gee, first the phytoplankton news, Dai 2010, now this... What's next, Cryosat-2 showing we're one strong Arctic DiPole summer away from Santa's Workshop going Waterworld? Make room at the bar, I'm buyin'... The Yooper -
Alden Griffith at 12:07 PM on 8 February 2011Crichton's 'Aliens Cause Global Warming'
@BernAs I understand it, the 'consensus' in climate science comes in the answers to the question: "If we change the amount of CO2 in the atmosphere, how much does the Earth's climate change in response?"
I would suggest that the "consensus" is not around sensitivity, but is simply based upon the reality of climate change as put forth in the IPCC AR4: "Most of the observed increase in global average temperatures since the mid-20th century is very likely due to the observed increase in anthropogenic greenhouse gas concentrations." ...and that increasing greenhouse gases will continue to warm the planet. Climate sensitivity represents a large source of uncertainty. However, there is strong agreement that it is unlikely to be low (and that most of this uncertainty is not comforting).
Prev 1945 1946 1947 1948 1949 1950 1951 1952 1953 1954 1955 1956 1957 1958 1959 1960 Next


