


 Arguments


Recent Comments
Prev 1947 1948 1949 1950 1951 1952 1953 1954 1955 1956 1957 1958 1959 1960 1961 1962 Next
Comments 97701 to 97750:
-
apiratelooksat50 at 06:43 AM on 8 February 2011How We Know Recent Global Warming Is Not Natural
Muon @ 45 From the NOAA website from where you pulled that graph. "For example, these questions remain to be answered with complete confidence: •How much warming has occurred due to anthropogenic increases in atmospheric trace-gas levels? •How much warming will occur in the future? •What other changes will occur with future warming?" To have some common ground where we can discuss what is happening to the climate, this gives us a good basis that I think we can both work with. Also, has the data used to generate that graph been used elswhere? It doesn't look to scale, especially if we've only had 0.8 degree C warming in the past 150 years. -
Bob Lacatena at 06:33 AM on 8 February 2011Articgate: perpetuating the myth that Arctic sea ice has recovered
This graph from Peter Gleick's site is also great for highlighting the cherry pick: Misrepresenting Climate Science: Cherry-Picking Data to Hide the Disappearance of Arctic Ice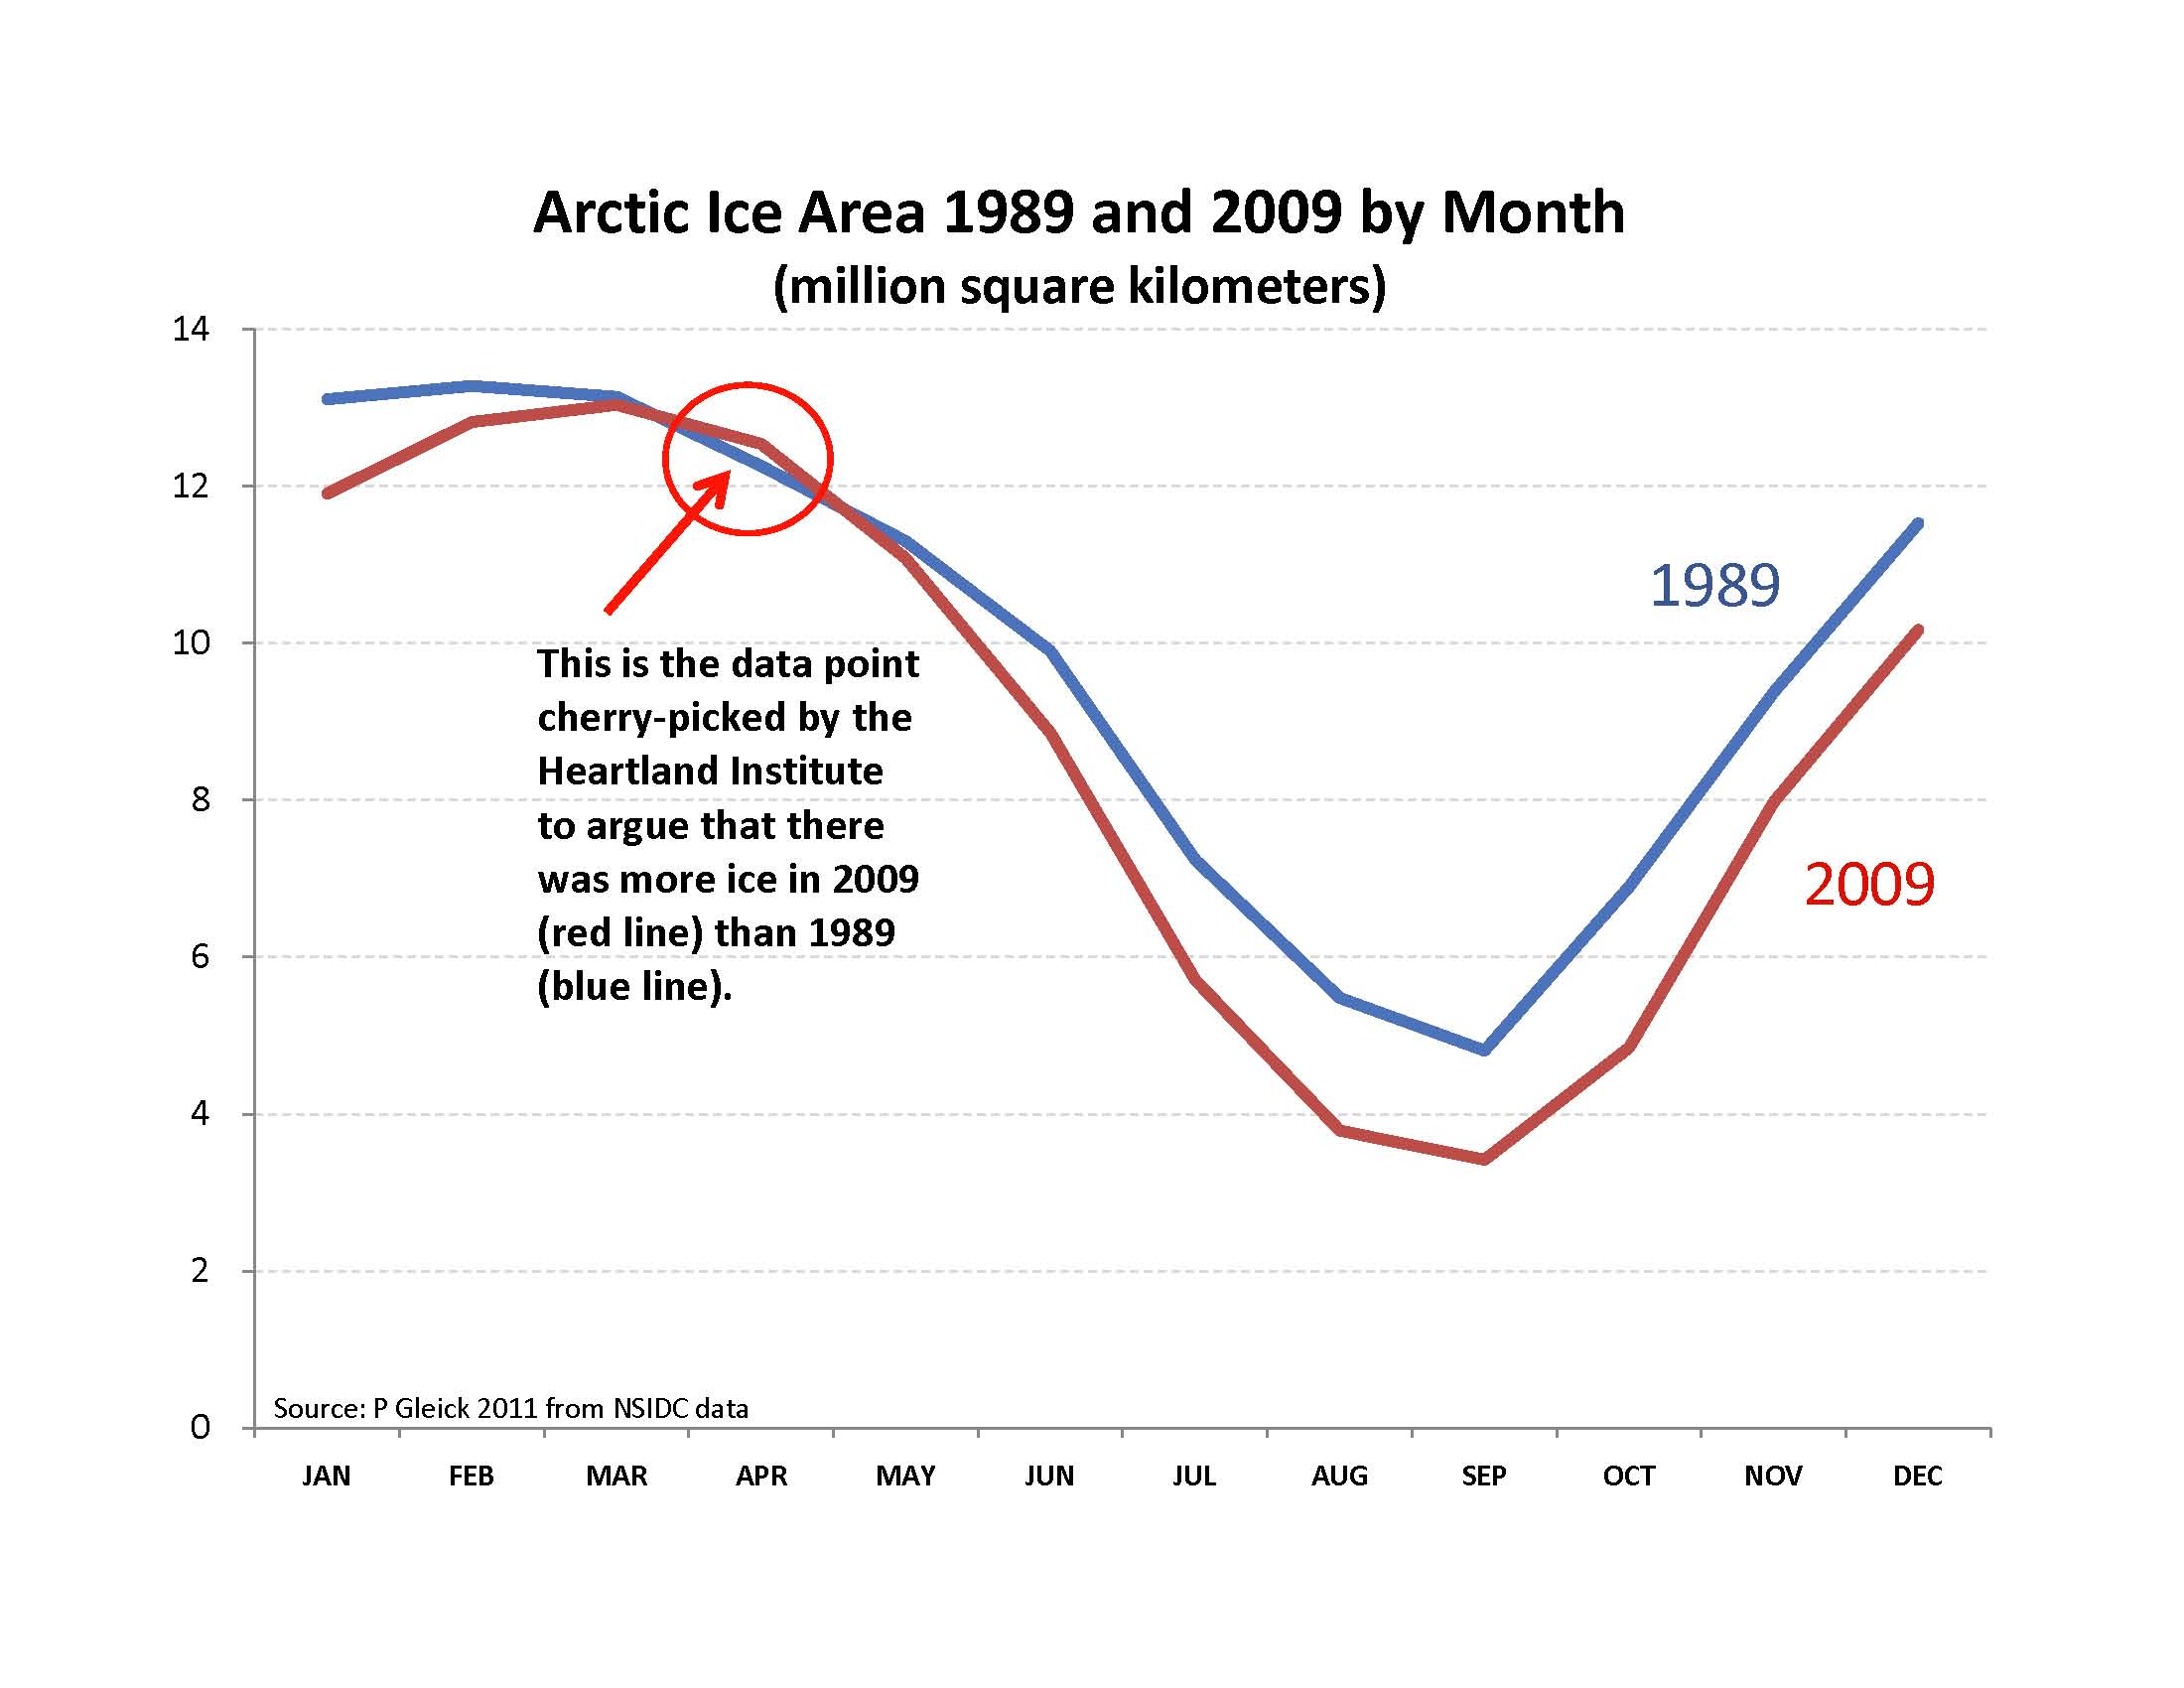 http://images.huffingtonpost.com/2011-02-07-Arcticgateimages1A.jpg
-
Albatross at 06:14 AM on 8 February 2011How We Know Recent Global Warming Is Not Natural
Dana, you have exceeded your usual high standards with this post. Regarding Spencer's challenge. It is iMHO very underhanded of him and probably an effort to fabricate "debate". It also just reinforces pre-conceived notions by some that the mainstream climate science ignores natural variability (which is most definitely does not, start reading the IPCC report here) or that the warming can me attributed to some mystical, hitherto undiscovered driver. The scientific literature abounds with example of papers investigating the role of natural variability on regional and global temperatures and precipitation. Spencer's "challenge" really does smack of desperation and wishful thinking. Regarding clouds, that is a tricky one. As Norris (an expert in the field) data issues are a limiting factor in elucidating the role of clouds (see Norris and Slingo (2009). That said he has tried, very hard I might add, to identify trends in low clouds and their possible contribution to the observed temperature changes. His recent paper in Science (Clement et al. 2010) finds evidence for a positive feedback, with warming leading to decreased low-level cloud cover which in turn causes more warming. In a presentation made by Norris in 2009, he made the following statements after considering all the best available data: And from Norris' "summary": • cloud changes since 1952 have had a net cooling effect on the Earth He also of the opinion that: "internal climate variability is unlikely to produce cloud trends occurring over the length of 46 years • anthropogenic or natural external forcing is unlikely to directly produce the observed cloud trends • an internal response of the climate system to external forcing could produce the cloud trends • there is not yet enough information to attribute the cloud trends to anthropogenic global warming" -
Miriam O'Brien (Sou) at 06:11 AM on 8 February 2011Crichton's 'Aliens Cause Global Warming'
This is an 'aha!' moment for me. I'd occasionally wondered why some people switched from being semi-illiterate to being able to put words into a properly formed sentence. This post explains it. They were quoting random bits of Crichton verbatim. (These same people make no more sense quoting Crichton than when they use their own words.) I'll now have a reference to check. -
Chris G at 05:54 AM on 8 February 2011The 2010 Amazon Drought
Eric, I think we may have misunderstood each other. You cited a reference that infers a link between the droughts and the variability of ENSO. I wasn't sure what connection you were drawing, but most commonly I've seen skeptics use ENSO in the context of a pre-existing variability, and inferring that is all there is occurring now. I was countering by pointing out that El Ninos are getting warmer, in the sense that yes, there are waves, but that doesn't mean the tide isn't rising. And the energy for this extra warmth has to come from somewhere; it isn't produced by the water itself. Since you Also, I think our interpretations of "...we cannot attribute the recent ENSO shift..." might be different. I think they mean that their research was on how the shift in SST patterns affect rainfall over land patterns, and not directly on the causes of the SST changes. The research of others that they read was ambiguous on the matter; so, they are simply stating that they are not taking a stand on that aspect. I get the impression that you think they mean something more like, "..recent ENSO shifts can not be attributed...", which would be something else entirely. In any case, we know humans are changing the thermodynamic properties of the earth, and ENSO, winds, and rainfall are just means of distributing energy within the earth system. So, it would be silly to think that we aren't changing the pattern of when, where, and how much it rains. This study of the Amazon is just a quantification of the symptoms to date. -
muoncounter at 05:52 AM on 8 February 2011How We Know Recent Global Warming Is Not Natural
#30: "no measurable, testable, empirical difference" Both redundant (empirical = measurable and tested) and incorrect. The 'difference' is obvious to those who can open their eyes and see the red line at the right-hand end of the graph. The 'natural cycle' should be sending temperatures lower. Measurements show temperatures are increasing. Hence that natural cycle isn't driving any longer. Your argument vanishes.
This is the science and it's really not that difficult; it's actually harder to cling to the 'no it's not' philosophy.
The 'natural cycle' should be sending temperatures lower. Measurements show temperatures are increasing. Hence that natural cycle isn't driving any longer. Your argument vanishes.
This is the science and it's really not that difficult; it's actually harder to cling to the 'no it's not' philosophy.
-
JMurphy at 05:48 AM on 8 February 2011CO2 lags temperature
PS The above paper has already been seen-off in the following Skeptical Science thread : The Dunning-Kruger effect and the climate debate Perhaps that would be the best place for any replies or further discussion, especially comments that would highlight that effect ? -
JMurphy at 05:44 AM on 8 February 2011CO2 lags temperature
Well, rather than go round and round in circles once more, all I have to do to kill two birds with one stone (so to speak) is this : 50 YEARS OF CONTINUOUS MEASUREMENT OF CO2 ON MAUNA LOA, by Ernst-Georg Beck, ENERGY & ENVIRONMENT, VOLUME 19, No. 7 2008 (I can only find the full paper on ICECAP.US, so I won't link to it) (Note also that I have copied the title, etc. straight from the source - I am not shouting !) The above paper suggests that CO2 levels were 400ppm in 1942 (i.e. they were higher than they are now), and this paper appears in a certain little list. Now, does this mean that CO2 lags temperature, according to this particular paper ? Or has CO2 been falling while temperatures have been rising ? Or temperatures will soon be falling, to follow the so-called fall in CO2 since 1942 ? Or what...? Can we trust this paper or anyone who uses it to try to claim...whatever they're trying to claim ? -
Daniel Bailey at 05:44 AM on 8 February 2011How We Know Recent Global Warming Is Not Natural
@ garythompson (39) and apl50 (41) This has been looked at before, in great detail, by very sharp and knowledgable minds:Only the anthropogenic contribution completes the picture, explaining the warming we can empirically see and measure in the absence of other forcings. Else we would be measuring a decades-long cooling trend. Which we aren't. -Edit-: Dana's comment below reminded me I forgot to source my graphic above (yes, Meehl et al 2004). My bad. BTW, Meehl has an extensive publication record (listing here). -End Edit- The Yooper
-
Bob Lacatena at 05:41 AM on 8 February 2011Articgate: perpetuating the myth that Arctic sea ice has recovered
John Cook, The light blue oscillating "monthly ice extent" in Figure 2 is I think too light. I didn't even notice it when I first looked, and to me it's the most important part of the graph. It's the orchard, that makes it very clear from whence the cherries were picked. Interestingly, they're not even max extents, but obviously very arbitrarily chosen matches. Could you darken that color? May make it royal (dark) blue, and instead make the currently royal blue yearly average black). -
MarkR at 05:38 AM on 8 February 2011A Flanner in the Works for Snow and Ice calculations
#35: A bigger Y means that you 'need' less warming to re-establish equilibrium. Bigger Y means less global warming, yes. But make sure you track the sign, positive feedbacks reduce Y and people flip signs in the equations regularly. So long as you're consistent it's not a problem! Assuming Y is constant (which it will be for small changes within a stable regime) then if F slows down its increase, then temperature rise will slow. In the real world we expect accelerating temperature increase because whilst CO2 forcing is logarithmic with concentration, concentration has risen faster than exponentially with time. Even if it was 'just' exponential then you would expect accelerating global warming because the time taken to return to equilibrium doesn't increase at the same rate as the final expected warming does. -
How We Know Recent Global Warming Is Not Natural
apiratelooksat50 - "Are you stating those forcings are not factors now?" Strawman argument! Please read the topic and discussion on CO2 is not the only driver of climate. CO2 accounts for most of the temperature change of the last 50 years, but not all. Nobody has claimed otherwise. Again, the question is one of evidence. There's plenty of evidence that our CO2 emissions are changing the situation, and no evidence that undefined "natural cycles" are doing so. The well defined and understood natural forcings and cycles cannot account for recent climate behavior - natural forcings plus our greenhouse gases do. Claiming these undefined, untestable cycles are responsible, rather than well established physics, is the equivalent of claiming it's leprechauns or (as I have phrased it), the lawn gnome Illuminati. It's quite irresponsible. -
Dikran Marsupial at 05:29 AM on 8 February 2011How We Know Recent Global Warming Is Not Natural
apiratelooksat50@37 wrote "Before I formulate a hypothesis, can you state your hypothesis for AGW?" I did not ask you to formulate a hypothesis, I asked you to provide an example of an observation that would falsify the hypothesis in Dr Spencers challenge that you asserted to be valid in post 25. I am mainstream on AGW, my view is in accord with that presented in the IPCC WG1 scientific basis report. "Also, are you of the position that only CO2 from human combustion of fossil fuels is the driving force? " No, the IPCC don't make such a claim and neither would I. -
apiratelooksat50 at 05:23 AM on 8 February 2011How We Know Recent Global Warming Is Not Natural
Gary @ 39 I think we agree with each other. The natural forces didn't just go away because humans and fossil fuel combustion showed up. And, CO2 whether from humans or the Earth contributes to the greenhouse effect. So, yeah, they most certainly could be coupled. -
RSVP at 05:10 AM on 8 February 2011How We Know Recent Global Warming Is Not Natural
"For example, some scientists have studied the climate response to recent large volcanic eruptions, which can have a measurable impact on global temperatures." ...and these caused abrupt cooling over the course of just a few years. Somehow, animal life adapted and survived these abrupt "natural" changes. -
garythompson at 05:09 AM on 8 February 2011How We Know Recent Global Warming Is Not Natural
Conversely, if one generates an hypothesis that is impossible to disprove because it is all encompassing that doesn’t mean that the hypothesis is true. If I propose that leprechauns are causing increased snowfall, decreased snowfall, increased drought, increased floods, higher temperatures, colder temperatures, melting sea ice, increased number of hurricanes (but only in some places), tree ring divergences (only in the north), increased species extinctions (everywhere), rising sea levels, changes in cloud cover (increased and decreased), etc. then it would be hard to prove me wrong. you have to admit that there should be some research showing how natural forces are at least coupling with AGW to produce the warming. Are we afraid to ask the question? -
WheelsOC at 05:01 AM on 8 February 2011How We Know Recent Global Warming Is Not Natural
I pointed out when his challenge hit WUWT that it's somewhat underhanded for Spencer to demand only peer-reviewed literature to use against him when he refuses to even attempt publishing in peer-reviewed venues anymore. Refereed letters journals like Geophysical Research Letters (the only outlet he chooses besides his own website) are not sufficient by themselves as a platform to credibly fight off full-fledged papers in Science or Nature. I also mentioned that Spencer himself has obligations to live up to in establishing the validity of his own "null hypothesis" if he wants to play the game. -
apiratelooksat50 at 05:01 AM on 8 February 2011How We Know Recent Global Warming Is Not Natural
Dikran @ 27 Before I formulate a hypothesis, can you state your hypothesis for AGW? Also, are you of the position that only CO2 from human combustion of fossil fuels is the driving force? -
apiratelooksat50 at 04:57 AM on 8 February 2011How We Know Recent Global Warming Is Not Natural
Dana @ 32 "you are neglecting physics. Previous Holocene temperature changes had physical mechanisms causing them - changes in solar, volcanic, etc. forcings. They were not caused by "magical natural cycles"." 1. Are the physical forces of solar, volcanic, etc... not natural? 2. Are you stating those forcings are not factors now? 3. Magical... Really? -
Daniel Bailey at 04:43 AM on 8 February 2011Articgate: perpetuating the myth that Arctic sea ice has recovered
The disingenuity of the myth is made even more plain by looking at Arctic Sea Ice Extent even further back in time: Science: Using all of the data to see the bigger picture.
The Yooper
Science: Using all of the data to see the bigger picture.
The Yooper
-
Daniel Bailey at 04:33 AM on 8 February 2011Crichton's 'Aliens Cause Global Warming'
Indeed. At one time, the "Consensus" was that Divine Happenstance determined rulership. As far as evidence for global warming, any lay person with Internet access can download empirical measurements of temperatures and see for themselves the warming of the world. Even if they eliminate up to 90% of the station data, the warming is still there, present even in the raw data itself. Nice post, Alden. The Yooper -
dana1981 at 04:19 AM on 8 February 2011How We Know Recent Global Warming Is Not Natural
The problem here is that there are two categories of "natural" forcing mechanisms which Spencer and pirate are incorrectly equating. 1) Natural physical mechanisms which we know can and have exerted a radiative forcing on the climate system, but which cannot explain the warming over the past century (solar, volcanic, orbital, etc.) 2) Spencer's mysterious "internal forcing" hypothesis which has almost no supporting evidence, no concrete physical mechanism, and is an entirely new concept. Putting Spencer's hypothesis on the same scientific footing as known natural radiative forcings is inappropriate. But that's basically what Spencer is arguing for. -
Steve L at 04:16 AM on 8 February 2011Articgate: perpetuating the myth that Arctic sea ice has recovered
John, I've never seen Fig 2 before. There are a couple of things I find interesting there: there are a lot of missing data at the end of 1987; the annual average is higher than the midpoint of the range (even prior to 2007). I'm ignorant about why either of these things happened. -
michael sweet at 03:49 AM on 8 February 2011Global Warming and Cold Winters
Mozart: I provided you a link to prove my claim of record warmth in 2010. You have made an unsupported assertion that cold records exceed warm records in 2011. Provide a link to your wild, unsupported assertion of cold records exceeding warm records in 2011. The record warm temperatures at the start of January in Greenland, as much as 25C above normal for weeks, exceed anything you will be able to find for cold anywhere in the world. I had this discussion with another sqeptic last month, they cited record warm temperatures as evidence that it was getting colder because it was only 10C warmer than normal. Deniers love to make wild unsupported claims and waste our time chasing down the correct data. If you cannot provide data you must withdraw your wild claim. -
Mike Palin at 03:45 AM on 8 February 2011Articgate: perpetuating the myth that Arctic sea ice has recovered
Please note that Harrison Schmitt's more recent, and in this context more relevant, credentials are as a politician in the Republican Party. That trumps his earlier training as a geologist or astronaut. -
dana1981 at 03:43 AM on 8 February 2011Articgate: perpetuating the myth that Arctic sea ice has recovered
Joe Romm at Climate Progres just covered Articgate too. http://climateprogress.org/2011/02/07/harrison-schmitt-climate-science-denier-arctic-sea-ice/ -
Phila at 03:28 AM on 8 February 2011How We Know Recent Global Warming Is Not Natural
Pirate: (we could just as easily create a label called natural climate change deniers), Not without being hugely dishonest, you couldn't. The current understanding of AGW is partly the result of a long process of ruling out known mechanisms for natural climate change. An unwillingness to take vague, unsubstantiated guesswork about "unknown mechanisms" seriously is not "denial"; it's a demand for evidence. The fact that you can't provide that evidence is not our fault, or our problem. It's yours. it takes a leap of faith to abandon the repetitive, observed natural climate changes over the history of the Earth (both on the short and long scales) in favor of climate change wholly induced by the actions of humanity. No, it takes decades of observations and careful data-gathering by people who know much, much, much more about the science than you do. The fact that you refuse to accept those observations and that data because they make you ideologically uncomfortable is not our fault, or our problem. It's yours. -
Dikran Marsupial at 03:27 AM on 8 February 2011How We Know Recent Global Warming Is Not Natural
apiratelooksat50: Can you answer the question I posted in 27 directly? "With no measurable, testable, empirical difference between today’s temperature cycles and temperature cycles during the Holocene, the alternative AGW hypothesis necessarily fails." Not being able to disprove the null hypothesis does not disprove the alternative hypothesis. Nobody can prove that evolution didn't happen purely by random mutation rather than being driven by natural selection, but that doesn't mean that the theory of Darwinian evolution "necessarily fails". -
hengistmcstone at 03:26 AM on 8 February 2011Medieval Warm Period was warmer
Thanks to JMurphy who has provided me with some interesting reading which I accept. But I still see a problem with this. On the one hand SkS is saying the causes of the MWP are (largely) solar irradiance - the sun's output. On the other hand it is argued that the MWP may well have been a regional effect not global. How can these two arguments exist side by side? Greater solar irradiance would have an effect across the planet. In essence the intermediate answer to this Skeptic argument "To claim the Medieval Warm Period was warmer than today is to narrowly focus on a few regions... Globally, temperatures during the Medieval Period were less than today." negates the need for (and it could be argued unpicks) the basic argument -
dana1981 at 03:24 AM on 8 February 2011How We Know Recent Global Warming Is Not Natural
apiratelooksat50 #30 - you are neglecting physics. Previous Holocene temperature changes had physical mechanisms causing them - changes in solar, volcanic, etc. forcings. They were not caused by "magical natural cycles". Moreover, I don't think there have been any cases of 0.8°C warming in 100 years or 0.55°C warming in 35 years previously during the Holocene. Thus there is a difference between current and previous warming events. -
paulgrace at 03:24 AM on 8 February 2011Articgate: perpetuating the myth that Arctic sea ice has recovered
I don't know about Schmitt these days, but many geologists work for or associate with other geologists that work for extractive industries, in the pursuit of fossil carbon to burn. I suspect this may expose them to significant pressure to view greenhouse gas issues from a particular slant. -
Same Ordinary Fool at 03:23 AM on 8 February 2011Articgate: perpetuating the myth that Arctic sea ice has recovered
When you sit on top of a rocket, you must trust the science behind the engineering on which it was built. How would he have felt if the underlying science were a "skeptic science" that came from just 3% of the publishing scientists? And, in particular, that these scientists were the rump contingent, a predictable group in every scientific field, that resists the new research. And what would he have thought of the "heretic skeptics" campaigning for positions that the 3%'ers are unlikely to believe, and certainly couldn't profess in serious circles. And yet these "heretic skeptics" are the largest part of the movement. Did Harrison Schmitt ever think that he would become one? PS See geologist Richard Alley's video lecture, "The Biggest Control Knob, Carbon Dioxide in Earth's Climate History" http://www.agu.org/meetings/fm09/lectures/lecture_videos/A23A.shtmlModerator Response: [Daniel Bailey] Converted URL to clickable link. -
Dan Moutal at 03:22 AM on 8 February 2011Articgate: perpetuating the myth that Arctic sea ice has recovered
The comedian Marcus Brigstocke has a good analogy to this situation: saying that this is like standing at a train station and watching a 6 foot tall man walk through the gate. Then ignoring every single other person that also walked through the gate half an hour later seeing a midget walk through the gate and conclude that OH MY GOD PEOPLE ARE SHIRNKING!!! Or in other words, cherries are delicious. -
dana1981 at 03:20 AM on 8 February 2011How We Know Recent Global Warming Is Not Natural
A couple of points are worth noting. First, as discussed in the article and in more detail by Mark in #8, Spencer does sort of have an alternative hypothesis. It's that some unknown mechanism is causing cloud cover to change, perhaps through some unknown heat redistribution. It's not exactly just hand-waving "natural cycles", though I don't think it's far from it. I agree with Mark that it's the most plausible alternative to AGW put forth, but that's not saying much. Secondly, scientists can choose any null hypothesis they want for any given study. If they want to disprove "natural" causes, they can set the null hypothesis to "global warming is being caused by natural effects". Spencer's problem is that almost all climate scientists are convinced the warming is anthropogenic, so that's effectively their null hypothesis. Basically he wants them to continue trying to disprove "natural causes" when they're already convinced it's anthropogenic. My reaction to that is "tough sh*t". Like I said, any study can set any null hypothesis it wants. Spencer is free to attempt to disprove AGW, or attempt to prove his "internal radiative forcing" hypothesis. But the evidence is overwhelmingly on the side of AGW, so climate scientists are entirely justified in using it as their null hypothesis. apiratelooksat50 #25 - 50% is the minimum amount of warming over the past century that humans can be resposible for, unless climate sensitivity is below the consensus range of many different lines of evidence (2 to 4.5°C for 2xCO2). And physics is not a leap of faith. -
apiratelooksat50 at 03:12 AM on 8 February 2011How We Know Recent Global Warming Is Not Natural
The null hypothesis is the statistical hypothesis that states that there are no differences between observed and expected data. With no measurable, testable, empirical difference between today’s temperature cycles and temperature cycles during the Holocene, the alternative AGW hypothesis necessarily fails. -
MichaelM at 02:40 AM on 8 February 2011How We Know Recent Global Warming Is Not Natural
I would enjoy CSI: RSVP where corpses lie around with bullet wounds and axes sticking out of them and they are all deemed to have died of 'natural causes'.Moderator Response: [Dikran Marsupial] ;o) However, can we keep comments substantive (I am thinking here of RSVP's orignial post rather than your reply- the use of "natural" to mean "non-anthropogenic" is well established and causes no genuine misunderstanding). -
mozart at 02:38 AM on 8 February 2011Global Warming and Cold Winters
Really? We have something other than a model forecast? What would that be, a time machine? The fact is both the carbon and temperature projections require exponential responses. The most basic requirement of any model is that it duplicates known outcomes when fed with historical data. Something these models have always struggled to do. The veiled antagonism to any contrary view illustrates your problem. A strong bias hardly ensures good science in such an uncertain and complex field. Nor does the constant explaining away of contrary data with increasingly concepts. -
mozart at 02:16 AM on 8 February 2011Other planets are warming
The sun's output is still higher than any time in the entire century before 1950. Cirrus values may be consistent with rising tempsModerator Response: See the Argument "It's the Sun." -
RSVP at 02:11 AM on 8 February 2011How We Know Recent Global Warming Is Not Natural
Are humans now not part of nature? Even if global warming were wholely "anthropogenic", the idea that man is not a part of nature seems strange. -
Dikran Marsupial at 02:08 AM on 8 February 2011How We Know Recent Global Warming Is Not Natural
@apiratelooksat50 For a hypothesis to be a valid scientific theory it needs to be falsifiable. If you think the hypothesis is valid, give me an example of an observation that would falsify it (i.e. an observation that would be impossible if the hypothesis were true). -
Alden Griffith at 02:05 AM on 8 February 2011Articgate: perpetuating the myth that Arctic sea ice has recovered
whoops - I didn't mean that to be an ad hominem remark. Sorry, if it reads that way.Moderator Response: [Daniel Bailey] Don't worry, it's pretty clear that it's not an A-H remark. -
Dikran Marsupial at 02:05 AM on 8 February 2011How We Know Recent Global Warming Is Not Natural
Icarus wrote: "All we need to know is whether, all other things being equal, elevated atmospheric CO2 causes elevated global temperature, and by how much." The fact that the rise in atmospheric CO2 is rising due to anthropogenic emissions is easily established*, hence if we know elevated atmospheric CO2 causes global temperatures to rise and by how much, we automatically know it is due to our activity. "So really the null hypothesis should be "atmospheric concentration of carbon dioxide has no effect on global climate"" Spencer can't use that as the null hypothesis as he says the warming (without feedback) from a doubling of CO2 is about 1 degree F, and that that statement is not contentious (see here). Very few skeptics think that CO2 is not a greenhouse gas, so they can't use a null hypothesis that they know from basic physics must be false. They generally argue that climate sensitivity is low and that negative feedback will prevent much warming (one wonders what happened to the negative feedback during the PETM event) Dr Spencer's null hypothesis is the right one, just inadequately specified; however the only way to specify what is plausible under "natural variability" is to build a model incorporating the known physics of the natural climate (given observed forcings other than anthropogenic emissions), and that has already been done and published in the IPCC WG1 scientific basis report. *If the natural environment were a net source of CO2 to the atmosphere, then (assuming conservation of mass) the annual rise in atmospheric CO2 would be greater than anthropogenic emissions, however the observations show this is not the case, the rise is only about 45% of anthropogenic emissions, so we know the natural environment is a strong net carbon sink, and hence is not the cause. -
apiratelooksat50 at 02:04 AM on 8 February 2011How We Know Recent Global Warming Is Not Natural
Dr. Spencer's challenge has validity. I do think it could have been worded better. It should be noted that his challenge does allow for the influence of anthropogenic CO2 on the current warming. What we know: 1. Climate has changed in the past due to external and internal forces. 2. Even with the higher CO2 levels, this interglacial period appears to have maxed out at more than 2 degrees on average below the previous 4 interglacials. 3. CO2 is a greenhouse gas and helps contribute to the vital warming of the planet. 4. Through the combustion of fossil fuels and landuse practices - man has contributed CO2 to the atmosphere and is partially responsible for the current rise in CO2 levels. Dr. Spencer is asking for a paper ruling out natural, internal climate cycles as the cause of "most" of the recent warming. That certainly leaves the door open for the contribution of CO2, and more specifically anthropogenic CO2, to the mix. According to one of your links above, in the past 150 years 50% of the 0.8 degree C rise in surface temperatures can be attributed to man. This isn't the place to squabble over those figures, but for the sake of discussion that is a contribution, not a cause. Most of us "deniers" (we could just as easily create a label called natural climate change deniers), agree that CO2 contributes to warming which contributes to climate change. We also think that man's land use practices contribute to weather and climate. However, it takes a leap of faith to abandon the repetitive, observed natural climate changes over the history of the Earth (both on the short and long scales) in favor of climate change wholly induced by the actions of humanity. -
Alden Griffith at 02:02 AM on 8 February 2011Articgate: perpetuating the myth that Arctic sea ice has recovered
To me, this has nothing to do with area of expertise, but simply represents appalling analytical skills that are unacceptable in any discipline. Imagine a student in their graduate-level comprehensive exam trying to make a claim based on two data points that completely misrepresents the clear longterm trend. Fail. -
jonathansf13 at 01:20 AM on 8 February 2011How We Know Recent Global Warming Is Not Natural
A different way to state many of the comments here might be the following: For over 100 years there has been a developing theory that anthropogenic CO2 would warm the earth's climate. Then, in the past 30 or so years, evidence has been building that the climate is warming. The scientific process is then obligated to test the most prevalent theory, and it seems to me that is what has been happening in climate change literature. The theory of AGW via CO2 emissions consistently rises to meet all challenges, to date, while other hypotheses are either not sufficiently flushed out to have become "theories", or they are "flushed out" by the process. Spencer's complaint seems to miss these points entirely. He has every right to look for an alternative mechanism, but until he or someone else comes up with something that can be tested, it does not merit the time of the scientific community to test. It seems to me that there are some in the climate modeling community that could do a great service by taking a shot at parameterizing models with values provided by Spencer. If he cannot provide the parameters, then he has little to complain about. -
muoncounter at 00:42 AM on 8 February 2011How We Know Recent Global Warming Is Not Natural
#21: "Carbon dioxide is a perfectly natural substance and its atmospheric concentration varies due to natural causes," Perhaps you meant to say "concentration varies within limits due to natural causes." The A part of AGW is the excursion outside those natural limits. See Human CO2 is a small % or similar thread. -
Kevin C at 00:34 AM on 8 February 2011How We Know Recent Global Warming Is Not Natural
SNR: "Re null hypothesis: In the absence of identifiable factors, the null hypothesis must be that the temperature is constant. As soon as there is some change observed, "natural" factors can not have any priority in explanatory models, this is plain natural science." I'm not sure that's the case. Suppose (fictitiously) that we knew from multiple measurements that the sun was getting warmer, and that this was universally accepted. However there was a debate over whether this was the only factor affecting the climate, or whether there were other environmental factors causing more or less warming than the solar forcing, then the null hypothesis would be warming from the sun alone. So I think that the idea of a null hypothesis is actually often a social construct. In the type of simple cases you get in statistics and philosophy texts there is often a hypothesis that uncontroversially fills the 'null hypothesis' space. But I'm not sure that that is generally the case. But maybe the null hypothesis is determined by the question being asked? So if we ask 'is there warming', then the null will be no warming. If we ask, for our fictitious planet, 'is there non-solar warming', then the null will be solar-explained warming. But what happens if we reword the question? How about if we ask 'is there no warming?'. OK, that's an obvious trick . But if we have a different set of preconceptions from which the hypothesis of no warming looks surprising, then that becomes a sensible question. So I think I come back to the position that in non-trivial cases null hypotheses are socially constructed. In the case of a consensus, then the null hypothesis is primarily shaped by the consensus position. If that's correct, then the null hypothesis among scientists would be a climate sensitivity of ~3C, and the onus is again on Spencer to provide an alternative hypothesis. Of course we also exist in a social and media environment in which the consensus may be different. Which means you have to shift your null when talking to different groups. Messy! -
Icarus at 00:21 AM on 8 February 2011How We Know Recent Global Warming Is Not Natural
It seems to me that characterising the issue as one of natural vs. anthropogenic causes is missing the point. Carbon dioxide is a perfectly natural substance and its atmospheric concentration varies due to natural causes, so we only need to know whether and how that atmospheric concentration affects the global climate. In terms of the effect it has, it makes no difference at all whether a change in atmospheric concentration of CO2 is natural or anthropogenic. All we need to know is whether, all other things being equal, elevated atmospheric CO2 causes elevated global temperature, and by how much. Similarly for methane, albedo, aerosols and so on - all are naturally occurring factors which affect global climate, and in terms of the physics involved it makes no difference at all whether they are changing naturally or due to human activities. The effect on climate will be the same either way. So really the null hypothesis should be "atmospheric concentration of carbon dioxide has no effect on global climate" (and similarly for the other factors). Proving that these factors are changing because of human activities is a separate issue. Spencer is really just setting up a false dichotomy between 'natural' and 'anthropogenic' causes, when the real issue is "does increasing CO2, CH4 & N2O cause global warming?" and similar questions. He can't challenge AGW by citing imagined 'natural climate cycles', as if by discovering such cycles he could somehow change the laws of physics for the radiative properties of greenhouse gases. Science doesn't work that way. If there was some unknown natural cooling factor offsetting the warming from the proven effects of increasing greenhouse gases then there would have to be yet *another* unknown natural factor having an equal and opposite *warming* effect to offset the unknown natural *cooling* effect, thus leaving the known enhanced greenhouse effect intact... which is the same as saying that the known enhanced greenhouse effect is what is causing the current warming in the first place. -
SNRatio at 00:19 AM on 8 February 2011Articgate: perpetuating the myth that Arctic sea ice has recovered
I wonder if it may have to do with failure to fully acknowledge the non-linearity of many effects. After all, 32 times as high CO2 as now is just five doublings, and it is not that much change in solar output needed to balance that. Feedbacks are mostly based on net forcing. As for this man, either he is making statements without having checked the underlying data, or he is consciously making an misleading presentation. I don't know what is worst. But I _really_ doubt he would say "temperatures have now returned to January levels" after a frosty night in April. -
RickG at 00:11 AM on 8 February 2011How We Know Recent Global Warming Is Not Natural
Dana1981. From the article: Dr. Spencer has proposed an alternative to the anthropogenic global warming theory. He suggests that some unknown mechanism has caused global cloud cover to decrease over the past century. Just wondering. If decreasing cloud cover lets more solar irradiation in, wouldn't ground based instrumental records show an increase in solar irradiation outside the solar cycle over the past 30 years? And since no increase over that period been shown, wouldn't that make Spencer's decreasing cloud cover hypothesis false?
Prev 1947 1948 1949 1950 1951 1952 1953 1954 1955 1956 1957 1958 1959 1960 1961 1962 Next


