


 Arguments


Recent Comments
Prev 1955 1956 1957 1958 1959 1960 1961 1962 1963 1964 1965 1966 1967 1968 1969 1970 Next
Comments 98101 to 98150:
-
MrAce at 05:23 AM on 18 January 2011The Physical Chemistry of Carbon Dioxide Absorption
I've got the feeling that clouds are of some importance here. Since they absorb a wide spectrum of IR and radiate a blackbody spectrum depending on the temperature of the cloud. If more CO2 does not change the temperature/height/amount of the clouds, we expect the surface to warm even more, because it can only lose extra energy where there are no clouds. Is this reasoning correct? -
Albatross at 04:35 AM on 18 January 2011OK global warming, this time it's personal!
John, excellent piece. I think you covered all the bases nicely. Really, what you are saying is explained well by both the Clausius-Clapeyron equation and the equation for moist static energy (MSE = CpT +gz+Lr). In fact, Crook (1996) investigated the sensitivity of Convective Available Potential Energy (measure of buoyancy and updraft strength in thunderstorms) to small changes in the near-surface temperature and moisture. Through a scaling analysis of the equation for MSE he found that an increase in mixing ratio (r) of only 1 g/kg has about 2.5 times the effect on CAPE as increasing the surface temperature by 1 C. To keep things simple by keeping the vertical wind shear constant, a relatively small increases in low-level moisture in a convectively unstable environment can translate into a significant impact of thunderstorm intensity (and in turn increase precipitation rate). -
Kevin C at 04:05 AM on 18 January 2011A Quick and Dirty Analysis of GHCN Surface Temperature Data
Thanks, that's very helpful indeed, especially with respect to missing data. Python indeed has a hashmap data structure - dict. It's a built-in and the students tend to use it extensively, for things which never occur to me with my C++ background! I'd already used it to read in the GHCNv3 data using pretty much the data structure you suggest: So far my only difference is to introduce a class at the station level with lat/long info for later use. -
Phila at 03:32 AM on 18 January 2011Global Warming and Cold Winters
GC: Enjoy the current warming. Long may it last! This sort of braying certainty really isn't compatible with your attempts to present yourself as a humble amateur truthseeker. Maybe you should approach your own opinions with the same skepticism you recommend when discussing the findings of people who actually have some expertise. -
muoncounter at 03:22 AM on 18 January 2011OK global warming, this time it's personal!
Good one, John. Great to get exposure on a 'mainstream' media outlet, except for the inevitable rise of zombie comments. A word of warming from US Gulf Coast hurricane experience -- after the flood, first come the home repair scam artists, then the cheesy lawyer commercials. I noticed when I posted this comment on Its not bad that the new term 'atmospheric river' is gaining traction as an observable characteristic of extreme rainfall events. While initially used to explain California flooding, a quick search shows that this phenom may be applicable to the Qland flooding as well. These ARs are highly visible on radar. -
caerbannog at 03:21 AM on 18 January 2011A Quick and Dirty Analysis of GHCN Surface Temperature Data
(7), (8), (14): 7: Mea-Culpa -- I used an imperfect recollection of what NASA did when I coded up my app. Didn't check into the details before coding. Just went from (incorrect) memory. So I ended up implementing something considerably simpler than what NASA does. 8: As for the implications for global-scale averages, this should attest to the robustness of the global temperature record. There are multiple ways to skin the "global temperature" cat, and they all give you pretty close to the same answer. There are significant differences between NASA's algorithm and my much simpler one, but both approaches gave very consistent results. That attests to the robustness of the data *and* the averaging methods. 14: My algorithm would quite simple if it weren't for the "data gap" issue. The programming "complications" that could really trip up students have to do with those gaps. Not all stations have data for all years/months. The gaps/missing-data vary randomly from station to station. As a result, when calculating baseline temperatures, you have to keep track of the number of valid temperature samples per station and month. The map template in the C++ Standard Template Library (STL) makes this chore much easier, but C++ isn't exactly a "student-friendly" language. Plus, code with STL templates isn't the easiest to debug -- step into an STL container with a debugger, and you'll see mostly incomprehensible gobbledygook. I presume that Python contains a "map" container similar to the STL map (but I haven't done any Python programming, so I can't say for sure). You will definitely want to use a higher-level "data container" function (like a map) that will help keep you "out of the weeds" with respect to data-gap bookkeeping. Depending on how advanced your students are, you may want to write your own Python "extensions" that hide the uglier coding details, and have your students use those. Anyway, here's a description of the algorithm (I just "coded it up from memory", so I don't have a nice reference document that I can point you to): 1) Read in the data into a structure that allows you to access any particular temperature sample by [WMO-ID][YEAR][MONTH]. (WMO-ID is the unique identification number given to each temperature station). The advantage of the STL map container (over simple arrays) is that if there are data gaps for, say, years 1920, 1930-1935, etc. for a given temperature station, the map container will make it much easier to avoid averaging in "missing" data by mistake. Unlike a plain array, map indices don't have to be sequential. The map container will take care of jumping over discontinuities in the index values for you. 2) For each station, calculate the average temperature for each month over the period 1951-1980. I.e. Calculate the average Jan temp for each station, the average Feb temp for each station, etc. Put all these averages into a 2-d map/array/whatever so that you can index each station/month average by [station-id][month]. The tricky part (for students) here is that not all stations will have data for the entire baseline period. There may be missing years of data, and missing months within years. This will vary randomly from station to station. So you'll want to keep track of the number of valid temperature values for each station and month. (I do this in a separate [station-id][temperature] "sample counter" map). In my code, I define a "minimum valid number of samples" value. For a station to be included in the baseline calculation for a particular month, it must have at least that many valid samples to be included. Otherwise I throw it out. The default value is 15. That means that unless a station contains at least 15 valid temperature readings (i.e. 15 years out of 30 for the 1951-1980 baseline period) for a given month during the baseline period, I exclude that station from the global-anomaly calculations for that particular month. I have found my results to be highly insensitive to that value, however. If I use 1 as the minimum number, I get similar results. Likewise, if I use 30 (the maximum number for the 1951-1980 baseline period), I get similar results. 3) Then you go back to the original temperature data, and for each [station][year][month], subtract the corresponding [station][month] baseline value to get the anomaly value. The anomaly value is simply the difference between the temperature for each [station][year][month] and its corresponding [station][month] 1951-1980 baseline temperature. 4) Then for each year/month, you calculate the average of all anomalies for all the stations. Once again, the number of stations reporting valid temperatures for each year/month will vary, so to compute the averages correctly, you will have to keep count of the number of valid reporting stations for each [year][month]. 5) To get an single average anomaly value for each year, calculate the average anomaly value for all the months in that year (i.e. average over months in the [year][month] array/map generated in step 4). Once again, the number of months reporting valid data for each year may vary, so you'll want to keep track of the number of valid "month" temperature samples for each year. In the GHCN temperature files, missing temperature values are assigned the value -9999, so they are easy to identify and code around. Definitely a challenging project for students, but if it's broken up into digestible "pieces" so that students don't get stuck/frustrated (a common programming teaching challenge), it would be a terrific learning experience. Anyway, I hope that this is "clearer than mud" -- putting something like this together as a digestible "lesson plan" for students would be a great thing to do. I would imagine that having students see that their own independently-generated global-temperature results agree nicely with NASA's would be a mountain of "icing on the cake" -
Bibliovermis at 03:15 AM on 18 January 2011Monckton Myth #1: Cooling oceans
funglestrumpet, Thank you for demonstrating what separates the (honest) skeptics from the deniers & contrarians who claim to be such; the ability to learn from the resources presented to you. Keep asking questions & keep updating your understanding. I'm self-taught in this field by that very process. It is difficult to keep the cynicism at bay, but it is necessary in order to continue productive, civil discussions. Now, back to the topic at hand - ocean cooling. Claims of ocean cooling are the same as claims of surface cooling, a failure to take into account all of the evidence & asking questions in defense of preconceived notions rather than in search of knowledge. -
muoncounter at 02:57 AM on 18 January 2011Global Warming and Cold Winters
#78: "positively balmy compared to cold winters during the "Little Ice Age" I don't know what the relevance of that statement is to this thread or any other -- except as a sound byte on threads on the LIA. This thread and Northern hemisphere warming rates both originate in the desperate 'skeptic' claims that even a single winter snowstorm 'proves' warming is over or was never real. And unlike the 'skeptic non-science' of 'natural cycles,' actual climate science must reconcile strong early winter storms with deteriorating Arctic ice and all of the other fingerprints. Denial is easy; science is hard work. -
Dennis at 02:54 AM on 18 January 2011Not a cite for Soare eyes
As in the case of Energy and Environment, I would like to know more about the International Journal of Geosciences. I would like bone fide climate scientists who have been widely published and cited to step forward and say, "yes, I have participated in peer reviews for that journal and I stand behind the published papers I have reviewed." They don't have to identify which papers, just that they back the journal. -
Ron Crouch at 02:53 AM on 18 January 2011OK global warming, this time it's personal!
Nice plain simple language John. Nicely portrays: more heat = more moisture in the air column = greater energy potential. Yes the land being baked dry does make a difference when it does downpour. The water can't sink into the soil so it piles up faster. I'm sure that's probably a factor in the Australian floods. -
Mila at 01:54 AM on 18 January 2011OK global warming, this time it's personal!
#10 Have you tried: Global Drought Monitor? NOAA Drought Information Center provides data for US and a lot of background information. -
funglestrumpet at 01:48 AM on 18 January 2011Monckton Myth #1: Cooling oceans
48 Bibliovermis No, you are not misreading me, I simply did not know that what I was calling for had been covered by the IPCC, so no apologies necessary on your part and humble ones on mine. It is perhaps a reflection of the status of the IPCC in the minds of the general public that when someone like myself who is not a scientist, but very interested in it generally, and Climate Change in particular, was unaware of that aspect of its work. I try to keep abreast of events, but have neither the time nor the inclination to read the whole of the IPCC report, relying instead on trusted sources to produce their interpretation of it. I struggle with a considerable amount of the detailed science published on this page, and I am not particularly stupid if my IQ of 135 is any guide, so we face an uphill struggle if we are to convince those members of the general public who have little or no interest in science. Perhaps Professor Lovelock is right when he says that, having swarmed as a species, we are in for a cull in the same way that all other members of the animal kingdom are when they have outgrown their habitat. Perhaps the majority of those that have replied to my posts are also right, judging by the lack of alternative suggestions as to how we move from a business as usual situation i.e. there is nothing we can do other than to carry on as we are. (Or copy ancient sci-fi films and have a bunch of church leaders arguing about the wingspan of an angel assisting us in the matter. Let’s face it, they will probably come up with “God works in mysterious ways, his wonders to perform” and say we should let The Big Feller get on with it.) Heaven help us – literally! -
barry1487 at 01:20 AM on 18 January 2011OK global warming, this time it's personal!
Michael, I'm sincerely interested in any drought data available for the globe and for Australia. I have difficulty finding such. Similarly with flooding. Precipitation records are much easier to come by. -
michael sweet at 00:38 AM on 18 January 2011OK global warming, this time it's personal!
While we cannot connect a single weather event conclusively to AGW, the list is starting to get pretty long. I think your opinion piece should have been more strongly worded. Scientists have been qualifying their data while the deniers claim certainty. Something like this quote from the WMO, then empnhasing that events match the IPCC projections: "While a longer time range is required to establish whether an individual event is attributable to climate change, the sequence of current events matches IPCC projections of more frequent and more intense extreme weather events due to global warming." The general public perceives the qualifications by scientists as meaning the data is not clear. The data is clear: AGW has increased flooding and drought world wide. That fact needs to be emphasized in the first paragraph. -
Alexandre at 00:29 AM on 18 January 2011OK global warming, this time it's personal!
Here in Brazil we're having a lot of floods and landslides due to heavy rain too. It looks like a specially "disastrous" year, but I don't know about our local long term trends, though. -
HumanityRules at 00:28 AM on 18 January 2011Not a cite for Soare eyes
21 Marco You could write a whole blog on the issue of publishing access for scientists is resourse poor regions of the world. I remember a professor of mine when I showed him a paper I'd read said, paraphrasing, "ignore that it's written by Indians". The crassness of that remark may have disappeared somewhat but I think the sentiment is still there. It's not coincidental that many journals who's titles start International are at the lower end of the impact factor scale. -
HumanityRules at 00:08 AM on 18 January 2011A Quick and Dirty Analysis of GHCN Surface Temperature Data
Great work and I guess the article is here mainly as an example but do you mind a quick and dirty criticism? It's about the text describing Fig 3, I think I won't describe it quite the way you do. I agree with you on the period 1910-1940 but I think the post 1970 description is lacking some detail which would have an impact on your interpretation of the data. You say "post-1970 results show monthly-minimum temperatures rising faster than monthly maximum temperatures". The way I see it that's not quite right. Upto about 2000 the max and min are rising at an equal rate, just like 1910-1940. You can most clearly see that if you look at the 1980 and 2000 years, the grey graph lines help with the eyeballing. In those two years the difference is about 0.2oC. It's only after 2000 that the two lines begin to diverge dramatically. Your conclusion was "These results are entirely consistent with greater CO2 forcing later in the century than earlier." Well the CO2 increase has been a steadily increasing phenomenon while your data (based on my interpretation of the data) shows at best a step change after 2000 (let's say post the 1998-2001 El Nino/La Nina). This seems less consistent with a steadily increasing forcing from CO2. I'm not really interested in who's interpretation is correct, this is a 'quick and dirty analysis' after all. My point would be that large parts of climate science are interpretative. And in some instances interpretations are passed off as fact.Moderator Response: [muoncounter] Reversal of seasonal warming patterns as a sign of CO2-driven warming was discussed in detail on the Human fingerprint in the seasons thread. -
barry1487 at 23:43 PM on 17 January 2011OK global warming, this time it's personal!
For context, the global precipitation trend since 1900 is pretty clear. http://www.ncdc.noaa.gov/sotc/service/global/global-prcp-anom/201001-201012.gif -
barry1487 at 23:39 PM on 17 January 2011OK global warming, this time it's personal!
I was wondering about precipitation data for Queensland. The BOM provide a handy reference. Queensland recorded it's highest ever December rainfall anomaly last month. The positive trend since 1900 is small, and probably statistically insignificant (data is easily accessed from the links above and below). The trend is higher for January. Data for the current month is, of course, not yet available. Annual rainfall for Queensland has a stronger positive trend of 6cm over the century. The year of greatest rainfall was 2010, beating out 1950 by 7mm. I heard a Sydney shock jock excoriating Bob Brown (Greens party leader) today for linking the floods in Queensland with climate change. The data the announcer referred to was for Brisbane only, and he mentioned several more extreme precipitation events going back over a century. I am leery of connecting specific weather events to climate change. I am (pleasantly) surprised at how little the flooding in Queensland has been connected with global climate change in the mainstream media - the cause, I suspect, is not caution, but rather that there are more marketable grabs (human interest, damage and costs, civil scams and flood related policies). I do not know exactly what Brown said, but he would have had to have been quite discursive to have avoided propagandizing. The connection to climate change can only be gleaned from long-term data and analysis. The pages above are a good resource for anyone interested, capable and willing to do so. -
Alexandre at 23:06 PM on 17 January 2011Monckton Myth #1: Cooling oceans
Monckton's resemblence to the late Argetinian president Nestor Kirchner is stunning. (sorry, I know it's totally irrelevant. Just could not resist.)

-
Jeremy Young at 22:14 PM on 17 January 2011Monckton Myth #1: Cooling oceans
The International journal of Geosciences definitely looks very suspect. Three of the papers in the current issue appear to be climate change sceptical whilst the others area curious mix of obscure topics. To set up a new journal with such broad coverage is bizarre and the editorial board whilst impressively long does not include any names I recognise. There is one paper from my field, micropalaeontology, published in the journal, Jayaraju et al. (2010, issue 1/2). There is nothing disastrously wrong with this paper but it is based on analysis of only four samples which for the type of study reported would be regarded as too small a sample set for publication in a regular peer-reviewed journal. As with the Knox & Douglass paper this paper was published in a very short timescale "Received May 14, 2010; revised June 13, 2010; accepted July 11, 2010". It appears that this is essentially grey literature. My guess is that climate change sceptics are exploiting pre-existing dubious outlets rather than actually setting them up. -
Ed Davies at 22:06 PM on 17 January 2011A Quick and Dirty Analysis of GHCN Surface Temperature Data
Tamino had a good string of blog posts about a slightly more sophisticated version of this game, using area weighting. I think he also did some sort of baseline adjustment but I'm not sure. Regrettably, these seem to be from just before the Great Blackout but not to have made it to the wayback machine. In case they're useful to anybody here are a few 404ing links from my feed reader: http://tamino.wordpress.com/2010/02/13/prime-meridian/ http://tamino.wordpress.com/2010/02/15/dropouts/ http://tamino.wordpress.com/2010/02/23/ghcn-preliminary-results/ http://tamino.wordpress.com/2010/02/25/show-and-tell/ http://tamino.wordpress.com/2010/02/26/thanks/ http://tamino.wordpress.com/2010/02/28/update/ and two tail-enders which are still there: http://tamino.wordpress.com/2010/03/01/replication-not-repetition/ http://tamino.wordpress.com/2010/03/05/global-update/ -
Phil263 at 21:47 PM on 17 January 2011OK global warming, this time it's personal!
Well done John, excellent piece. Hopefully it will generate some good discussion on the ABC website. Seven years of drought, now record floods, it really looks like Climate change is beginning to bite. Unfortunately the first hit and the hardest hit will be the people who live in the "marginal" lands of outback Queensland. I wouldn't be surprised if we saw a growing stream of people "evacuating" these areas in the next decade. -
GeoffThomas at 21:25 PM on 17 January 2011Monckton Myth #1: Cooling oceans
Hi Guys, all good stuff, but might be worth mentioning that the ocean is partly absorbing heat through the water heated at the equator, ie through the gulf stream and other Hadley like convections, that gets to the poles and through having become more salty due to evaporation sinks, still warmer, down to the bottom of the ocean and enters one of the deep ocean currents, that may take decades or more to well up again, and only then will we find the ocean in part has become fundamentally warmer. The ocean is huge, but to find more heat down the bottom could be major as significant currents well up at the Antarctic and for those cold currents to be warmer could have huge effect on the Antarctic ice shield, particularly the West, (WAIS).- and would continue, - horrific in the long-termness of that extra heat. Keep up the good work, Geoff Thomas. -
Kevin C at 20:57 PM on 17 January 2011A Quick and Dirty Analysis of GHCN Surface Temperature Data
What's the best source for documentation of the baseline method as you have implemented it? I'd like to try it for myself with a view to setting it as a python programming project for my students. (I could try it from just your description, but I imagine there are gotchas. The one I see immediately is how to deal with stations where the baseline period is incomplete.) -
dorlomin at 20:19 PM on 17 January 2011OK global warming, this time it's personal!
Brazil and Sri Lanka are currently getting walloped. The news over the past years has felt a little like I anticipated it would be in 2050 back when I found out about AGW in the late 80s. It seems to be happening much quicker than I used to think it would. -
MarkR at 19:22 PM on 17 January 2011OK global warming, this time it's personal!
Bern; that's what SkepticalScience is for. Most of the 'scientific' criticisms that are levelled at global warming are clearly covered by SkS by now. Or at least, an analogue is... -
David Horton at 19:22 PM on 17 January 2011OK global warming, this time it's personal!
Good stuff John , well done - "don't get even, get mad" is always my motto. I don't understand how (as in the comment on your post) people can fail to understand that while yes indeed we have had a procession of La Ninas in the past (who knew?!) with attendant flooding, and a procession El Ninos, with attendant droughts, the problem is when you start getting RECORD La NInas and El Ninos. The reason they are breaking records (as in the nonsense concept of a "200 year flood" in Horsham) is that the effects are being boosted by warmer oceans and warmer air. Not that difficult a concept, surely. -
David Horton at 18:36 PM on 17 January 2011A Quick and Dirty Analysis of GHCN Surface Temperature Data
Daniel, just to be pedantic, sophistry's doesn't have an apostrophe! I doubt that "pedantic sophistries" does either!Moderator Response: [Daniel Bailey] Thanks for the heads-up! Shows you my irritation at the continual stream of zombie arguments from the usual "skeptics"... -
Bern at 18:20 PM on 17 January 2011OK global warming, this time it's personal!
An interesting read, John, fairly well written. Disappointing that the first comment allowed by the moderators was a denier throwing out the "it's natural" and "man has no influence" skeptic arguments. It'll be hard to counter the expected deluge of skeptic arguments without providing a bit more of the science, and in my experience, most 'lay people' just aren't interested in learning even the basics of the science behind global warming. -
Marco at 17:44 PM on 17 January 2011Not a cite for Soare eyes
dhogaza, please see http://www.ncbi.nlm.nih.gov/pmc/articles/PMC3017277/ I don't think SCIRP is Chinese government-backed. In fact, I think the Chinese involved in SCIRP would prefer to leave the Chinese government out... -
scaddenp at 17:19 PM on 17 January 2011Global Warming and Cold Winters
Spaerica - "Because after extensive study they've found that while daily temperatures vary widely between locations, mean anomalies do not." This comes up a lot - I know its covered in Hansen 1988, but I think it would be good if someone did a Skepsci article on this, referencing the data, graphics from studies that actually established this. If you have a reference to a good review paper on the spatial stability of temperature anomalies, I would appreciate the reference. -
gallopingcamel at 17:07 PM on 17 January 2011Global Warming and Cold Winters
This thread wants to reconcile the recent "cold" winters with "Global Warming". This is quite unnecessary as these winters are well within the range of random variability. During my lifetime there has been nothing to match (at least in south Wales) the winter of 1947 which dumped six feet of snow on a Welsh county known for its palm trees (thanks to the "Gulf Stream"). The snow persisted for six weeks starting in mid February. Few of the palm trees survived. Just to provide some contrast, the record cold winter of 1947 in south Wales was followed by a record hot summer. As I have pointed out more than once, what we perceive as "cold" winters are positively balmy compared to cold winters during the "Little Ice Age". During the LIA, there were 24 years when the Thames froze over. Enjoy the current warming. Long may it last! -
Albatross at 17:03 PM on 17 January 2011Global Warming and Cold Winters
Eric, PS: If you want to discuss this further, we can take it to a relevant thread. -
Albatross at 17:02 PM on 17 January 2011Global Warming and Cold Winters
Eric @69, My post @67 was directed at William's comment about La Nina. Now I'm not sure how you managed to miss my point. There are several other examples of single year La Nina events several decades ago (e.g., 54/55, 64/65, 70/71) which were associated with cooler global SATs than observed following recent La Ninas (e.g., 2000, 2008)-- you very likely know that or should. La Nina's still act to cool the global SAT (and troposphere) temperatures of course, but those anomalies are now superimposed on an underlying, long-term warming trend, so instead of getting a global SAT of around -0.1 C, one nowadays gets a global SAT anomaly of near +0.4 C (we'll see what 2011 brings) following a La Nina (and barring a major equatorial volcano blowing its top). This is what one gets (i.e., Tamino) when you remove the signal of ENSO and volcanoes from the SAT record from 1975.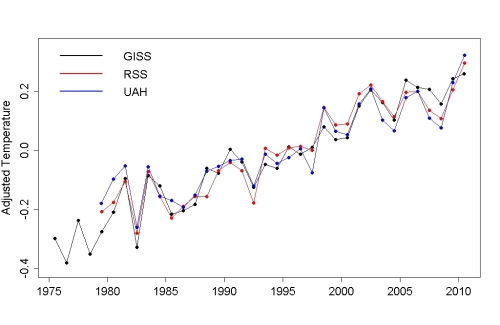 My point was, and is, that the strategy of the "skeptics" is to at all times focus on anything that permits them to refer to "cool" or "cold", or a "record cooling La Nina". And with internal climate modes, regional variability and weather, they are always able to repeatedly draw their targets' attention away from the inconvenient and important big picture of long-term warming. It is totally transparent and disingenuous, but sadly very effective.
So no need to wait 2.5 years for multi-year La Nina. We can meet back here in early 2012. In fact, that is not even necessary, just look at Tamino's graphic...
My point was, and is, that the strategy of the "skeptics" is to at all times focus on anything that permits them to refer to "cool" or "cold", or a "record cooling La Nina". And with internal climate modes, regional variability and weather, they are always able to repeatedly draw their targets' attention away from the inconvenient and important big picture of long-term warming. It is totally transparent and disingenuous, but sadly very effective.
So no need to wait 2.5 years for multi-year La Nina. We can meet back here in early 2012. In fact, that is not even necessary, just look at Tamino's graphic...
-
Daniel Bailey at 16:30 PM on 17 January 2011A Quick and Dirty Analysis of GHCN Surface Temperature Data
@ Albatross (11) Agreed. Took the link out of the last sentence. Pushed the envelope a bit there. Apropos that a whole comment dealing with untruths can yet be completely true. :) The Yooper -
Albatross at 16:25 PM on 17 January 2011A Quick and Dirty Analysis of GHCN Surface Temperature Data
Dan @10, I agree completely with what you say-- but your last sentence might have been a little over the top ;) -
Albatross at 16:17 PM on 17 January 2011Global Warming and Cold Winters
Gary Thompson and GC-could you please move the discussion about the SAT record to the appropriate thread/s. I know that those global SAT fields are inconvenient to you "skeptics", but raising red herrings (e.g., the alleged station dropout issue has been dealt with at length) are trying to call the validity of the SAT records is not going to help your case. And neither is pushing your Arctic window obsession, BP. Is it not more interesting to try and understand more about how the loss of Arctic ice is potentially affecting regional climate?Moderator Response: Yes, please *everybody* discuss on appropriate threads. -
Daniel Bailey at 16:16 PM on 17 January 2011A Quick and Dirty Analysis of GHCN Surface Temperature Data
@ Albatross (9) Facts are so inconvenient to contrarians...they can never get enough of them to line up with the curves they've already plotted. Much easier to be economical with the truth, peddle pedantic sophistry's or to simply make things up... The Yooper -
Albatross at 16:04 PM on 17 January 2011A Quick and Dirty Analysis of GHCN Surface Temperature Data
Ed @4, "Or maybe some have done the work but don't like the results so are keeping quiet." Probably. Also, note the absence of contrarians/"skeptics" on this thread. -
dhogaza at 15:58 PM on 17 January 2011Not a cite for Soare eyes
MattJ: "all I needed was to witness the pathetic abuse of the English language in the first sentence quoted: "The absence of immediate relation between CO2 and temperature is evidence that rising its mix ratio in the atmosphere will not imply more absorption and time residence of energy over the Earth surface." The abuse here betrays the author as uneducated and incompetent. "rising its mix ratio"?? Try "raising its mix ratio"." I'm sure you'd look even more uneducated and incompetent if you were to try to write a technical article in Mandarin. I think the whole suite of journals is some sort of Chinese (government backed) effort to quickly establish a wider China-based academic press. Could be wrong, but the language faux-pas is consistent. -
Bob Lacatena at 15:40 PM on 17 January 2011Global Warming and Cold Winters
53, garythompson,...so why does GISS assume that thousands of square km can be represented by 3 weather stations when it is obvious that there is great variability in weather stations within a radius of 150 km?
Because after extensive study they've found that while daily temperatures vary widely between locations, mean anomalies do not. That is, while it may be 3˚C warmer at a spot just a 150 km away from another (maybe at a different altitude, or more affected by a nearby large body of water, for instance), the difference in average temperature (i.e. temperature anomaly) between that spot and the first averaged for all of the days in any given month is not going to be noticeably different. To put it another way, the temperature anomaly (the difference between what the thermometer says today, and what it normally says on this particular day of the month in any given year), when averaged over thirty days, is pretty darn consistent whether you go 100, 200, 500 or even 1000 km away. Anomalies (difference from the multi-year average for a particular day), not absolute temperatures. Averages for a reasonably large string of days, not readings for a single, particular day. And they didn't just assume this. They learned this over time by looking at loads of data, analyzing it, and realizing that much of it was redundant and superfluous to the problem at hand. Why do you assume that your common sense approach, and level of education and intelligence, is superior to that of people who have dedicated their lives to studying this, and do it as a full time job, all year long, for years and years and years? I'm not asking you to just accept what they say because they are authorities, but your bristling assumption that you know better than they do is rather (annoyingly) astounding. The hubris of some people amazes me. -
Bob Lacatena at 15:25 PM on 17 January 2011Global Warming and Cold Winters
68, gallopingcamel,"How do you explain that empires rise during climate optima (warm periods) and fall during cold periods?"
Let me help you to answer your own question by filling in the important missing details:"How do you explain that pre-industrial empires restricted to areas encompassing a fraction of the earth's land surface rise during climate optima (warm periods) and fall during cold periods?"
-
muoncounter at 15:24 PM on 17 January 2011Northern hemisphere warming rates: More than you may have heard
#49: "Assuming these temperature anomalies as stock prices" I think that's not a particularly valid assumption. Technical market analysis relies on the fact that people are looking for patterns in stock charts; once they see those patterns, they react by buying or selling, which in turn drives the price. That mechanism simply doesn't exist in nature, which is driven by fundamental physics. So while such analysis may provide a descriptive tool for the shape of curves, its not physics. Two points as far as Mauna Loa's CO2 record is concerned: 1. the rate of change in CO2 correlates well with temperature anomalies; see this discussion. 2. there is a significant time lag before the full warming effect of new CO2 is felt, so it is not valid to look at last year's delta CO2 and expect this years delta temperature to match; see this prior thread. -
John Brookes at 15:21 PM on 17 January 2011Global Warming and Cold Winters
Just a (almost certainly wrong) thought. There was a volcanic eruption last year that put a lot of dust into the atmosphere in the northern hemisphere. Could that have had any effect? -
nigelj at 15:01 PM on 17 January 2011Monckton Myth #1: Cooling oceans
I have a comment on this IPCC issue. You cant put the planet in a lab to get esentially 100% certianty on agw. The problem is you need a body to weigh the evidence around the issue, like the IPCC. Such a body will always be criticised, so dissolving and replacing the IPCC may not achieve anything. Sooner or latter you have to make a decision on the weight of evidence. The other problem is the public want 100% certainty which is undeliverable. I also have a comment regarding the general unusual heat of this debate and missinformation from the likes of Moncton. It just amazes me how Congress would listen to a journalist like this. Lindzen I can understand, not Moncton. Vested oil interests are blamed but maybe it goes beyond that. Perhaps we are literally addicted to oil, or perhaps have evolved over thousands of years to become genetically adapted to a high energy use society. Many are therefore fundamentally and subconsciously resisting rational evidence and the need for change. Or are simply understandably fearfull of it. -
WHATDOWEKNOW at 14:38 PM on 17 January 2011Northern hemisphere warming rates: More than you may have heard
I have a question, (well actual several but let's start with this one) but please let me explain first: looking at the first graph with the temperature change per latitude band, I notice that clearly (for the NH) temperatures dropped between 1900-1910/1920 then increased until ~1940, decreased until ~1970 and have since then increased with a possible leveling off since 2000. Having a financial and trader background and a very successful long track record, I am more than tuned to recognizing patterns to predict what stock prices will do. Assuming these temperature anomalies as stock prices the general (linear) trend from 1900 to 2010 is obviously increasing. However, as I mentioned; there are clear trend-breaking moments which mean that there is no linear increase from 1900 to 2010, and any linear trend line through this data set is an error. In fact, not until ~1970 has the increase been consistent (regardless of what reason). That said, prior to ~1970 NH temperature anomalies varied between -0.6 and +0.4 (extremes), with the red line (SMA ?) between -0.35 and +0.2. Either way, from a stock-background perspective it means that there is a support at the -0.6 level and resistance at the +0.4 level, meaning that if temperatures were to drop then not until they drop below +0.4 a new negative (cooling) trend has been established, which would really set new records if it also dropped below -0.6. The same goes for when temperatures broke through the +0.4 level, which was not until the late 80ies, establishing a clear significant upward trend and clearly establishing new highs. Hence, seeing it from that perspective, I must say that temperature anomalies have only started to increased above their "long-term range" since the late 1980s and not the 1970s. If this were stock prices, I wouldn't buy the stock until it broke through that resistance level (say somewhere between +0.2 and +0.4), since it otherwise would mean it traded in between it's normal band with no real gain to make. Clearly of course this is not the case anymore. I know this is not a stock, but it provides a different way at looking at patterns. So my question is; has this been done before? Have scientists looked at this using stock/trading indicators to predict what global surface temperatures will do in the future? I'd suggest calculating EMAs, Momentum, MACDs etc and interpret this accordingly. Finally, looking at the last ten years, the temperature anomaly has fluctuated between ~0.7 and ~1.0, which is called a band, and to me it means that only when the temperature breaks through the 1.0 the warming continuing. Your thoughts? Also, how does this relate to the monoloa CO2 data set, which shows a clear steady increase in CO2 levels since 1958 but I don't see that pattern in the temperature anomalies, which didn't actually increase above their prior band until the 1908s. I'd appreciate any feed back -
nofreewind at 14:23 PM on 17 January 2011Global Warming and Cold Winters
Aren't we only talking about 1 million sq km's less of ice, which is only 600 miles by 600 miles square? That amount of ice free ocean is controlling the worlds climate?? -
Yvan Dutil at 14:03 PM on 17 January 2011Not a cite for Soare eyes
I have done a few literature review recently. I am amaze how awfully written paper can manage to get published. My general impression is that too many referee dont even care to read the paper. -
MattJ at 12:40 PM on 17 January 2011A Quick and Dirty Analysis of GHCN Surface Temperature Data
Robert- So what IS the implication of the different choice of methods, anomaly versus reference station?
Prev 1955 1956 1957 1958 1959 1960 1961 1962 1963 1964 1965 1966 1967 1968 1969 1970 Next


