


 Arguments


Recent Comments
Prev 1981 1982 1983 1984 1985 1986 1987 1988 1989 1990 1991 1992 1993 1994 1995 1996 Next
Comments 99401 to 99450:
-
Dikran Marsupial at 23:17 PM on 20 January 2011Monckton Myth #3: Linear Warming
BP@69 If you look at the data you plot in post 53, you will find there are several such short periods (e.g. 1980-1990) where there is little or no rise (or even a decrease) in OHC, even though this happens in the context of a long term increase in OHC. You argument is a clear example of unintentional cherry picking, focusing on short periods where the natural variability masks the long term warming. It is essentially the same argument as global warming stopped in 1998 etc. -
Berényi Péter at 22:55 PM on 20 January 2011Monckton Myth #3: Linear Warming
#54 Marcus at 13:22 PM on 20 January, 2011 Since mid-2007, when all 3,000 buoys were deployed, through to mid-2010 we saw consistent warming. Unfortunately that's either untrue or false. In fact there's no heat accumulation in the system even from mid-2007 to mid-2010. Nothing Nada Nicht Nichego. Semmi. It is the pre-2003 era where people have to look for Trenberth's missing heat when it could easily escape the rather sparse & error prone MBT/XBT measurement network. With ARGO in full swing it is no longer the case.
-
jhudsy at 22:39 PM on 20 January 2011Monckton Myth #3: Linear Warming
angusmac@65 You've got better eyes than I do if you can see that from Figure 2. However, a least squares fit from 2000 is showing a trend of between 0.12 and 0.17 per decade (depending on the data set used, and ignoring exogenous factors), which is very different to the "constant CO2 concentrations at year 2000" values that I've been able to find. -
Marcus at 22:34 PM on 20 January 2011Monckton Myth #3: Linear Warming
Also, Angusmac, methane concentrations in the atmosphere actually leveled out for the first part of the 2000-2010 period, so that also probably had some impact on total warming trends. Unfortunately, all the evidence says that methane levels have begun to rise again (we'd also better pray those clathrates don't melt, or else its "all over, red rover"!) -
Marcus at 22:32 PM on 20 January 2011Monckton Myth #3: Linear Warming
angusmac, I've got 3 little words for you-deep solar minimum. For the record, warming was only slightly less for 2000-2010 than it was for 1990-2000, so imagine what it will be like when total solar irradiance starts to trend upwards again. Also, you are aware that the period of 2000-2010 on that graph would be the *tiniest* little blip-where currently all 4 scenarios still overlap? -
angusmac at 22:23 PM on 20 January 2011Monckton Myth #3: Linear Warming
A reasonable argument is posted in this article. However, if you add up-to-date actual measured tempratures to Figure 2, it is evident that they are tracking closer to the orange line (constant CO2 concentrations at year 2000 values)than the other scenarios. It seems that we are not warming as fast as the models predict we should. -
Berényi Péter at 22:06 PM on 20 January 2011Hurricanes aren't linked to global warming
I've taken UAH satellite measured lower troposphere temperatures anomalies and annual global accumulated cyclone energy for the satellite era (1979-2010) and have made a scatter plot. If anything, there's a weak negative correlation between temperature anomaly and ACE. That is, there's no need to be scared about would-be supercanes.
Named storms is crap. Before the satellite era tropical storms not making landfall were seldom named because they could easily go unnoticed.
This is why hurricanes making landfall in the US of A are important for century scale histories. They are extremely well documented. If not by scientists, then by insurance companies for sure.
If anything, there's a weak negative correlation between temperature anomaly and ACE. That is, there's no need to be scared about would-be supercanes.
Named storms is crap. Before the satellite era tropical storms not making landfall were seldom named because they could easily go unnoticed.
This is why hurricanes making landfall in the US of A are important for century scale histories. They are extremely well documented. If not by scientists, then by insurance companies for sure.
-
Ed Davies at 22:02 PM on 20 January 2011Infographic on where global warming is going
...so to it takes time for the ocean to release its heat into the atmosphere. Why would the ocean release heat? I think it's that as equilibrium is reached the ocean stops absorbing heat resulting in it no-longer cooling the surface. -
MarkR at 21:31 PM on 20 January 2011Infographic on where global warming is going
#4 Adrian: UAH only measures the atmosphere, you're particularly looking at the lower troposphere. Part of this cooling is probably related to heat being dumped into the Pacific during a La Nina. Although ENSO does have a radiative forcing associated with it (as a positive feedback related to atmospheric temperatures as well as circulation etc). This happened at the last La Nina and the WUWT crowd did the same thing then: claiming that global warming was being 'wiped out' (they changed focus when we warmed up by more than we'd cooled down again though). Global warming is a sum of all the heat flows including ice and ocean as well as atmosphere. The 2.4% portion in the atmosphere has drastically decreased, but the amount in ice probably hasn't and even if the oceans do dump heat, the last time we had 'ice age cometh' shouts in 2008 the oceans had actually gained heat. Ocean heat content is here. We are confident it's not natural cycles because the oceans have gained so much heat, the mean atmospheric temperature has increased and there has been no noticeable trend in these natural cycles that could explain the warming. The mean solar output for the past decade has been lower than the '90s, and so has the mean ENSO index. Yet the past decade was warmer than the '90s with more heat in the atmosphere, melted ice and oceans. -
Ann at 21:19 PM on 20 January 2011Infographic on where global warming is going
@adrian smits The next step in your reasoning is you will be announcing a new Ice Age every winter and a new Global Warming every summer, since temperatures tend to go a bit up and down during the year. Global temperature is a noisy signal, and if you look at only a short period of time (let’s say a year), you are only seeing the noise. You have to take a step back and look to a longer period (for instance 30 years or more) to see the trend. Anyone who draws conclusions about the earth’s climate based on just one year is … well, wrong (and that applies to both skeptics and AGW proponents). -
Dikran Marsupial at 20:55 PM on 20 January 2011Monckton Myth #3: Linear Warming
NETCDR@58 wrote "If you plot the Ln of the CO2 between 1958 and 2010 it looks like a horizontal asymptote but it does increase very slowly." Nonsense, here is a plot of ln(CO2) for that period from Tamino's analysis: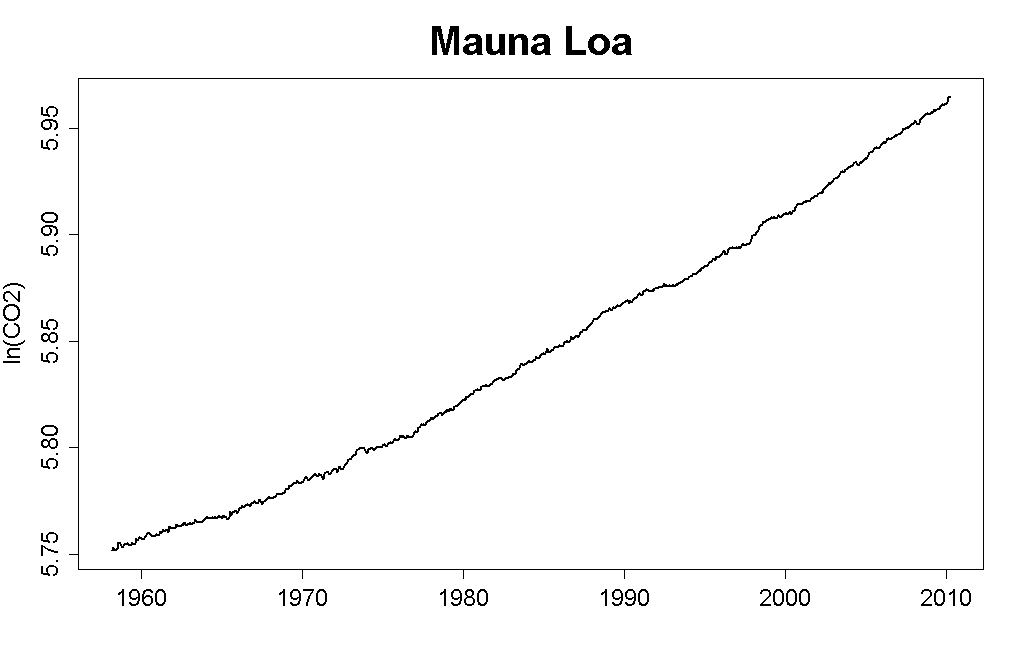 It doesn't look anything like a "horizontal asymptote" (unless you have your own personal definition of "asymptote"), not only is ln(CO2) rising, it is rising at an increasing rate. Your argument doesn't survive first contact with the data.
-
Paul D at 20:42 PM on 20 January 2011Infographic on where global warming is going
If more than 2% was melting ice, we wouldn't have any ice at all. Ice is ice for a very good reason. -
LandyJim at 20:20 PM on 20 January 2011Monckton Myth #4: Climate Sensitivity
From what I have read here there are hazardous assumptions and errors creeping in to this. Cloud cover and localized air temperature rises go hand in hand because the clouds reflect radiation emitted by the local environment back down, this is an obvious positive feedback that has been known for a very long time, however this does not operate on a global level because we do not have global cloud cover. Further, it is a fact that increased cloud cover does in fact reflect more solar radiation back into space, ask any astronomer...you increase a planet's cloud cover, you increase it's albedo because more radiation is reflected back into space. However, and this is important, increased cloud cover may reflect heat back into space, but if you have a heat source below that cloud layer, then any heat emitted by that source will be reflected back to the heat source, in this case the surface of the planet acts as both the emitter and the receiver. Monkton is wrong, but he is also right, as are you Guys and Gals. The situation is not as simple as the article above makes it sound. A good example of BOTH sides of this argument is Venus. Earth has an average Geometric Albedo of 0.386 (Bond Albedo of 0.29) Venus has an average Geometric Albedo of 0.84 (Bond Albedo of 0.75) Earth's varies quite a bit, but that of Venus is reasonably stable. Everyone knows that Venus is much hotter than Earth, even taking into account it's closer position to the Sun than Earth. Venus reflects ~80% of the radiation it receives from the sun, against Earth's ~35%, but because the dense atmosphere acts like a blanket, heat is trapped and the planet has the hottest surface temps in the Solar System. This is a clear example of where both sides of this argument area actually correct. However I accept that way Monkton presented it was clearly wrong, and was an example of very poor science. -
jyyh at 20:03 PM on 20 January 2011Infographic on where global warming is going
And if someone wonders how on earth the ocean gets that much, part of the reason is the radiation gets a bit deeper in the water than in the earth. -
Rob Painting at 19:04 PM on 20 January 2011Monckton Myth #4: Climate Sensitivity
rhjames - it's good to just look at some simple observations and simple logic - if I stand in the sun, it's hotter than when it's cloudy. It will take a lot to convince me that increased cloud cover has a net warming effect. And if you look out the window; is the Earth flat or round?. See the problem with so-called logic? -
adelady at 18:54 PM on 20 January 2011Monckton Myth #4: Climate Sensitivity
Come on rhj. Stand outside on a winter night when there is cloud cover, and another winter night when there's no cloud cover. How likely is frost on each of those occasions? -
rhjames at 18:21 PM on 20 January 2011Monckton Myth #4: Climate Sensitivity
I think we need to be a bit careful with some assumptions here. The IPCC admits that cloud formation and its effects are little understood. What global warming does for cloud cover, and the effect that has on heat reflection and retentions is still unknown. There are plenty of reports giving theoretical predictions in all directions, but it's still a big unknown. I know that if I'm outside on a hot day, and a cloud covers the sun, there's a big reduction in the heal energy reaching me (I feel cooler). Therefore, logic tells me that more cloud cover is more likely result in cooling. Before you start to tell be about shifts in wavelength, heating the air near the clouds etc, sometimes it's good to just look at some simple observations and simple logic - if I stand in the sun, it's hotter than when it's cloudy. It will take a lot to convince me that increased cloud cover has a net warming effect. -
Glenn Tamblyn at 17:28 PM on 20 January 2011Infographic on where global warming is going
Adrian, As John's graph shows, 90%+ of the warming is in the oceans. If you want to talk about 1/2 of that disappearing due to natural variability, then you might be on to something. And in case you may have missed it - we certainly here in Eastern Australia - this is a huge La Nina period. La Nina's cool the atmosphere so no surprise there that the short term result is cooling. That's Weather for you. Now, to talk about Climate, what is the 30 year average value? That is the WMO definition of climate; time scales of 30 years or more. -
jhudsy at 16:54 PM on 20 January 2011Monckton Myth #3: Linear Warming
NETDR - Watching the discussion, it seems that there's a bit of talking past each other going on. In order to understand your claims, could you answer this question: according to you, and your linear, quadratic, exponential and super-exponential fits, if current trends continue, what do you claim CO2 levels will be in 2050? 2100? What would the associated temperature anomaly be? Not percentage differences, but actual numbers. If we speak about numbers, maybe we can disambiguate things and see if we're on the same page, or reading from different books altogether. -
dana1981 at 16:34 PM on 20 January 2011Monckton Myth #3: Linear Warming
BP #53 - see Monckton Myth #1: Cooling Oceans. John debunked your claim less than a week ago. -
Daniel Bailey at 16:22 PM on 20 January 2011Infographic on where global warming is going
Hansen 2011 features the "albedo flip" as a melt mechanism, on P. 10. The Yooper -
dhogaza at 16:04 PM on 20 January 2011Infographic on where global warming is going
adrian smits:According to UAH satellite records the planet has cooled half a degree Celsius since this time last year
Likewise last summer's extreme heat proves that global warming is far worse than you imagine. *snort* Get real. -
muoncounter at 15:49 PM on 20 January 2011Monckton Myth #3: Linear Warming
#59: I like it. Our own Four Horsemen ... -
villabolo at 15:37 PM on 20 January 2011Infographic on where global warming is going
adrian @4: Your comment and my response to it is off topic but I'll bite just this once. I think that basics, such as whether we were headed towards a moderate El Niño a year ago versus a strong cooling La Niña right now, should be taken into consideration before making comparisons to the past 130 years. Take a look at the entire 30 years worth of UAH data as well as 10 years before it with a focus on El Niños and La Niñas as separate weather entities. You will find two jumps in temperatures that rise quickly then level off for a few years only to repeat the same process again. The first jump is in 1976. The second in 1995/1998. And now the apparent beginnings of a third jump in 2010. The UAH chart below should help you visualize the trend after 1979. It doesn't seem like we're losing anything. The cooler La Niñas are also getting warmer.
-
Daniel Bailey at 15:35 PM on 20 January 2011Infographic on where global warming is going
adrian smits (4) Per muoncounter's link above, corrected for El Nino, volcanoes, solar variation and the residual annual cycle: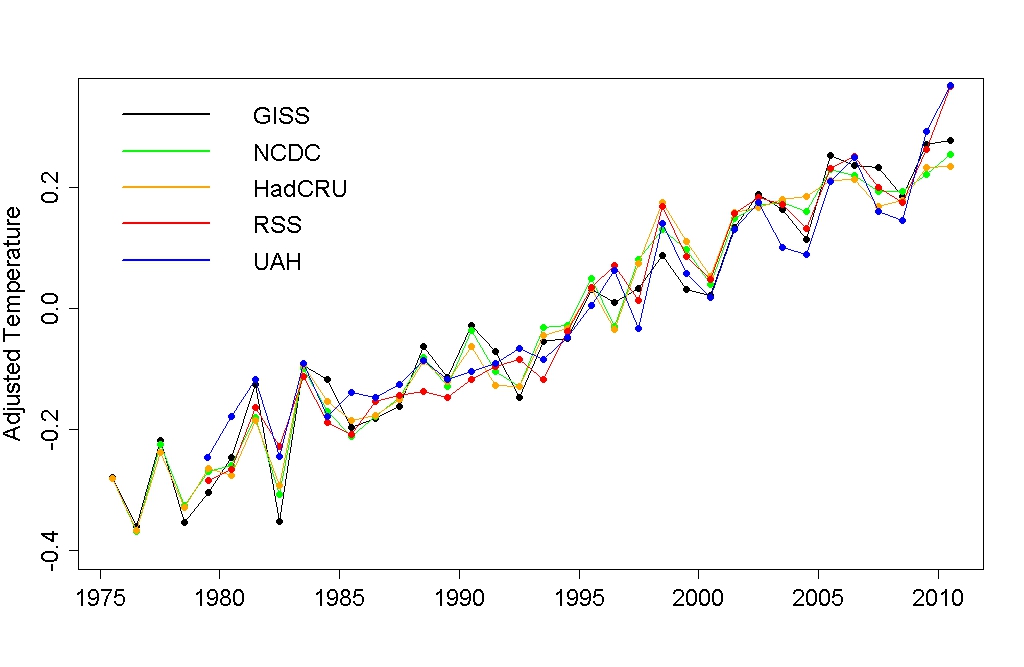 UAH proves you wrong. All the temperature records show significant warming, and that it is indeed global.
The Yooper
UAH proves you wrong. All the temperature records show significant warming, and that it is indeed global.
The Yooper
-
muoncounter at 15:34 PM on 20 January 2011Infographic on where global warming is going
#5: Yooper, And I thought an albedo flip was a refreshing if somewhat frou-frou beverage. -
archiesteel at 15:28 PM on 20 January 2011Monckton Myth #3: Linear Warming
@NETDR: "So from 1958 to 2010 [52] years the increase in CO2 has gone from 1 PPM per year to 2 PPM per year. Big deal. In the next 50 years if it goes from 2 PPM per year to 4 PPM per year that is a very small amount." Actually, no. That *isn't* a very small amount. It's a significative one, and it shows the growth is exponential. In other words, you are wrong. You have been called out on your error, and now instead of owning up to it you are trying to redefine the debate by talking about "insignificant" values and "very small" amounts. Thing is, they aren't. They're quite *significant* numbers. What irks me most about deniers is their incapacity to admitting when they are wrong, and their propensity to change the debate when they feel the heat. At least real skeptics concede when they're proven wrong... -
muoncounter at 15:27 PM on 20 January 2011Infographic on where global warming is going
#4: "the planet has cooled half a degree Celsius since this time last year" Of course, you're aware that a year isn't a significant time period. If you are interested in 'natural cycles', there's a thread for that. If you are interested in sensitivity to doubling CO2, there are several threads for that. You can find them using the Search feature -- and they are free to download. If you are interested in a significant look at warming, there's a great new post for that at Tamino's blog. all trends are statistically significant — strongly so. The conclusion is inescapable: the globe is warming, and shows absolutely no sign whatever of stopping or even slowing its warming. Any talk of “cooling” or even a “levelling off” of global warming over the last decade is absolute nonsense. -- emphasis added -
archiesteel at 15:21 PM on 20 January 2011Monckton Myth #3: Linear Warming
@muoncounter: I developed one back on Digg to keep track of the various contrarian claims flying around. it goes something like this: I) There's no warming II) There's warming, but it's not us/it's cyclical III) There's warming, it may be us but we can't stop it/it's not bad IV) The climate is too complex to know/we can't be sure enough to act I found that this covered almost every case. -
Daniel Bailey at 15:15 PM on 20 January 2011Infographic on where global warming is going
@ muoncounter Once the albedo flip (from Artful Dodger over at Neven's) kicks in, the Arctic will be absorbing a sight more than that. The Yooper -
adrian smits at 14:34 PM on 20 January 2011Infographic on where global warming is going
According to UAH satellite records the planet has cooled half a degree Celsius since this time last year.Now I think that represents close to two thirds of our total warming in 130 years. We can probably all agree that natural variability caused this cooling.So how much of the previous warming was caused by natural but longer term climate cycles? If only half the previous warming was natural doesn't that mean that the doubling of c02 should lead less that 1 degree of warming? -
NETDR at 14:33 PM on 20 January 2011Monckton Myth #3: Linear Warming
neutrino I found 4 % difference in the forcing between linear and the quadratic. This is insignificant in my opinion. If you plot the Ln of the CO2 between 1958 and 2010 it looks like a horizontal asymptote but it does increase very slowly. . The difference is you multiply the Ln by 5.35 to get 21.4 % How do you get the 5.35 ? If the effect were multiplied by 5.35 times the Ln Tamino would have mentioned it. He didn't. Tamino computed the Ln of the growth rate in 2010 was .0055 / year. Was he wrong ? Why didn't he compute 5 times as much it would have served his argument better. You may have a reasonable explanation, but various climate sensitivities using unproven positive feedbacks don't pass the sniff test. That gets into another off topic discussion. Which I keep getting hit with and when I respond I get yelled at ! Not exactly an even playing field ? -
MattJ at 14:16 PM on 20 January 2011Infographic on where global warming is going
That is a good question: if less than 2% is causing this much havoc with melting ice at both poles, what will happen when the oceans release the rest of it? Better yet, what is all that heat doing to the oceans? Perhaps we just aren't seeing the damage. We still do not know the deep oceans that well. -
RW1 at 14:12 PM on 20 January 2011The Physical Chemistry of Carbon Dioxide Absorption
MrAce (RE: 110), "I agree that more CO2 below the cloud has little effect, because all the radiation is absorbed by the cloud anyway. But this is exactly my point. More CO2 means less energy escaping to space, so the surface warms up, radiates more and we will reach an equilibrium with a higher temperature. When the surface warms below the clouds, there will not be any increase in radiation to space, because the clouds absorb it all. To reach equilibrium the surface has to warm even more." No, the whole point is the surface doesn't warm by any significant amount below the clouds with more CO2, because by and large the clouds are determining the surface heat flux - not GHGs (not CO2). -
muoncounter at 14:04 PM on 20 January 2011Monckton Myth #3: Linear Warming
#56: "Type II Deniers" asteel, Is there an official taxonomy? -
adelady at 13:46 PM on 20 January 2011Infographic on where global warming is going
I'll second that observation. Of course, a good part of that melt results from warm ocean waters rather than direct heating of the ice - I hope. -
archiesteel at 13:40 PM on 20 January 2011Monckton Myth #3: Linear Warming
@ BP: "Except there's no "planetary energy imbalance" there for the last eight years." Sure there is. Even eyeballing the graph clearly shows there is still warming going on. Hey, at least now I have reference posts to point Type II Deniers when they say "no one really claims there's no warming"... -
citizenschallenge at 13:40 PM on 20 January 2011The Queensland floods
Thanks Tom, I read your posts with much interest, since I was handed Christopher Booker's "What was the role of warmists in the Queensland flood disaster?" ~ The Telegraph 1/19/11 {I visited and liked your website too} You've managed to answer most of my questions regarding Booker's claims. However, I'm curious if you have any comments about the land zoning claim he makes? Are you familiar with the reporter? ~ ~ ~ "For years, Australia’s warmists have been advising the authorities that the danger posed to the country by global warming is not floods but droughts: not too much rain but too little. One result, in Brisbane, was a relaxation of planning rules, to allow building on areas vulnerable to flooding in the past. As long ago as 1999, this was seen as potentially disastrous by an expert Brisbane River Flood Study (which was ignored and for years kept secret). Instead of investing in its flood defenses" peterm -
archiesteel at 13:38 PM on 20 January 2011Monckton Myth #3: Linear Warming
@NETDR: "Plot it and see for yourself. Oh I forgot alarmists never plot anything or think for themselves do they ? " If this doesn't deserve to be moderated into oblivion, I don't know what is. It's bad enough that deniers repeat the same debunked BS over and over again, but now they're actually projecting their own failings onto people who actually understand the science? NETDR, the only people who agree with you are those opposed to AGW for political reasons. You have failed to disprove AGW theory. Just give it up. -
muoncounter at 13:37 PM on 20 January 2011Infographic on where global warming is going
Less than 2% going into ice (Greenland, Arctic, ice caps) gives us the melt rates we've observed??? I'm stunned. -
Marcus at 13:22 PM on 20 January 2011Monckton Myth #3: Linear Warming
@BP. Ah, still repeating the old 2003-2008 furphy are you? I'm sorry, but since when does 5 years of data constitute a statistically significant trend? Whatever issues might exist with pre-2003 data, the 2003-2007 data is based on an incomplete deployment of the ARGO buoys-which could very well make *that* the artifact. Since mid-2007, when all 3,000 buoys were deployed, through to mid-2010 we saw consistent warming. After 6 months of cooling, we're seeing temperatures starting to climb once more. So you see that your claims are *not* QED, & your use of that term highlights a great degree of arrogance on your part! -
muoncounter at 13:22 PM on 20 January 2011Hurricanes aren't linked to global warming
#20: "either not warming at all recently ..." We know that's not true. "... or there's no connection whatsoever between temperature and storminess." No connection whatsoever is a strong phrase in this context. From Jeff Masters: Tomas' formation ties 2010 with 1995 and 1887 for 3rd place for most number of named storms in an Atlantic hurricane season. Only 2005 (28 named storms) and 1933 (21 named storms) were busier. ... The intensification of Shary and Tomas into hurricanes today brings the total number of hurricanes this season to twelve, tying 2010 with 1969 and 1887 for second place for most hurricanes in a season. The record is held by 2005 with fifteen hurricanes ... -- emphasis added The last time this came up, you argued for some sort of ad hoc statistic by summing Safir-Simpson number of US landfalling storms annually. This completely discounts storms that bypass the continental US (which seems arbitrary) and ignores tropical storms (which seems capricious). FYI: See arbitrary and capricious. Here's the graph of named storms prior to the 2010 season: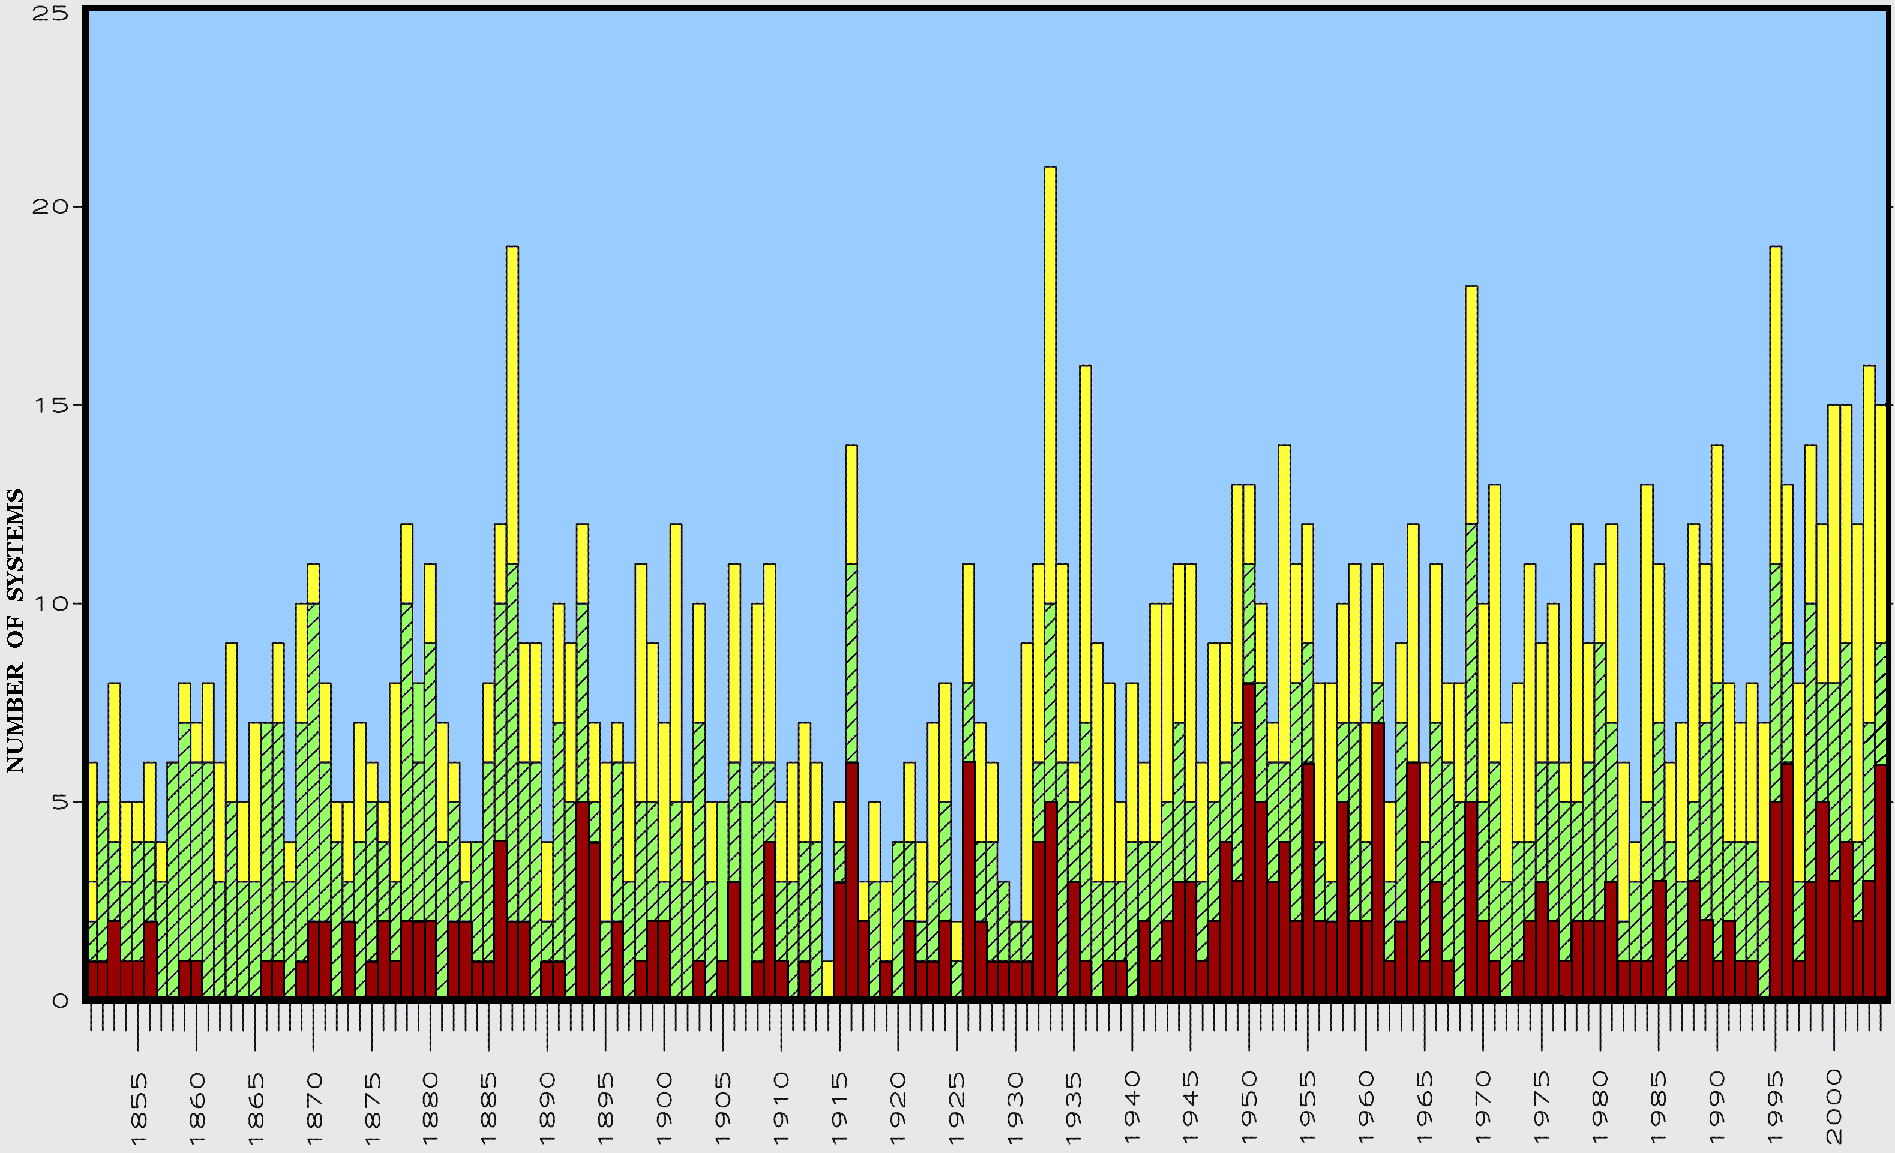 which is complicated, but seems to be vaguely increasing over time, especially since the 1920s.
The conclusion in prior threads was this particular aspect of the science isn't settled. So 'no connection whatsoever' is hardly warranted.
And then there are those nasty Pacific storms... this is about global warming after all.
which is complicated, but seems to be vaguely increasing over time, especially since the 1920s.
The conclusion in prior threads was this particular aspect of the science isn't settled. So 'no connection whatsoever' is hardly warranted.
And then there are those nasty Pacific storms... this is about global warming after all.
-
Marcus at 13:05 PM on 20 January 2011Monckton Myth #1: Cooling oceans
@ Albatross....and what do you know-its been since about 2007-2008 that we've had fairly consistent increases in Sea Surface temperatures. Methinks the 2003-2007 data might well be the "artifact" that BP & KL keep banging on about! -
muoncounter at 12:55 PM on 20 January 2011We're heading into an ice age
#226: You stated you were 'not convinced' by AGW; I recommended, as I often do, that one needs to establish the credibility of one's doubts in a systematic way. That could neither be construed as a personal attack nor a religious discussion in any way whatsoever. But this thread is about whether a new ice age is on the horizon. My comment #225 rejected your suggestion that a 4 BY solar system model has merit in this particular discussion. And the question 'what is an arbitrary effect?' in this context was warranted, as I do not find that particular phrase to have definite meaning in 'obvious English'. The solution to the problem of being misunderstood by others who may read your comments in a different light than you intended is simply to stay on topic, stick to facts and avoid gratuitous opportunities to drop off-the-cuff declarations into your comments whenever possible. -
LandyJim at 12:04 PM on 20 January 2011Hurricanes aren't linked to global warming
Why do you assume I did not read it? If you notice I used the word..assume..under normal circumstances when one puts more energy into a system, you get more energy out of it..I am not stating that either side of this comment is correct..If, and it is a big if, the atmosphere works the same as other systems in nature, then it is a reasonably conclusion to arrive at that by putting more energy into the system, one would expect more energy out, and in the case of tropical storm, one would expect more of them and likely with a higher energy level..but that is not necessarily the case. The only way to find out, or at least get a better handle on it is to go through all the available data that can be accepted as reasonably reliable and then put it into a useful and unbiased format. Then look at all other influences that may either positively or negatively impact any of that information...I am sure that, regardless of air and sea temperatures, there is far more going on to influence a tropical storm into becoming a Hurricane than we realise at this time..Like I said, this part of the discussion intrigues me... -
Jeremy Young at 12:03 PM on 20 January 2011Monckton Myth #1: Cooling oceans
What is peer reviewed literature? it has been held up as some kind of gold standard but as The Journal Geoscience Research demonstrates anyone can set up a peer reviewed journal, and especially easily online. Maybe the IPCC will need to more closely define the concept. -
Berényi Péter at 12:01 PM on 20 January 2011Hurricanes aren't linked to global warming
The Earth is either not warming at all recently or there's no connection whatsoever between temperature and storminess. Global Tropical Cyclone Accumulated Cyclone Energy (ACE) according to Dr. Ryan N. Maue at the Florida State University: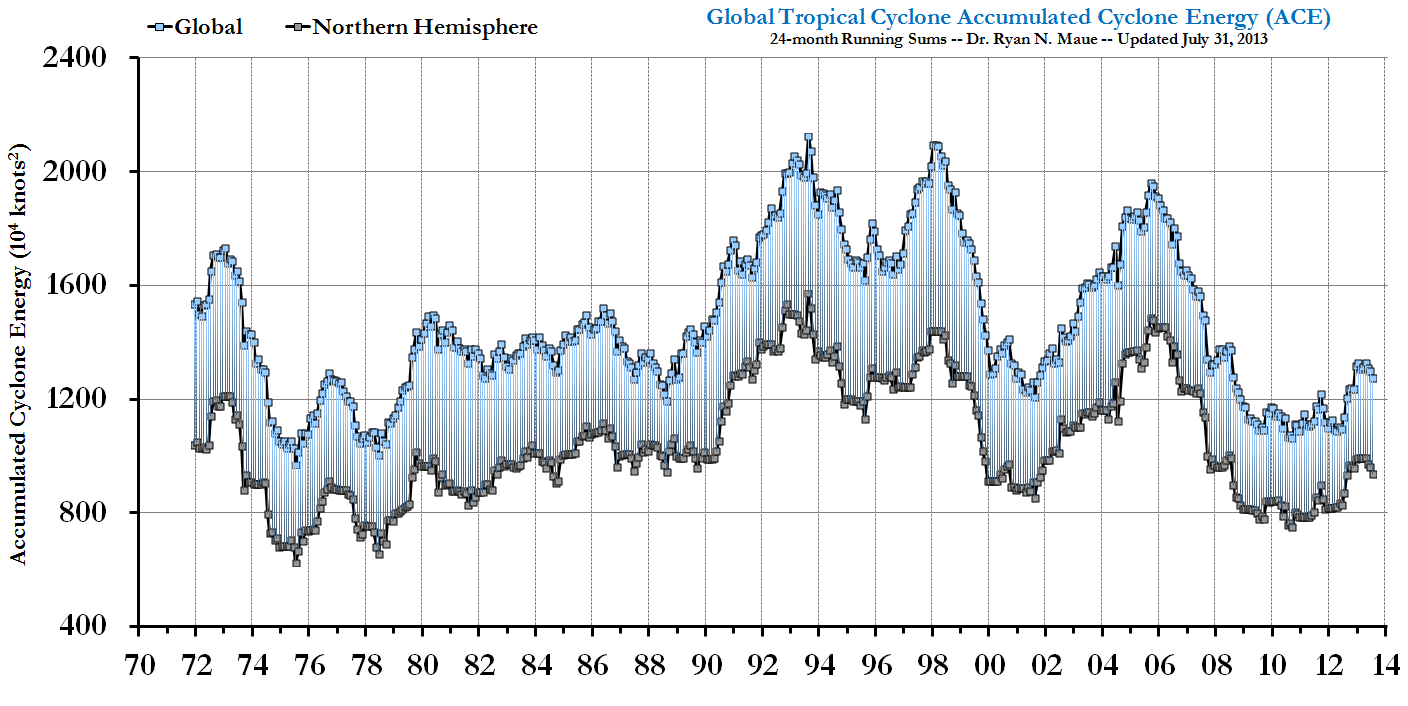 "With 2010 being a globally »hot« year, we saw the fewest number of global tropical cyclones observed since at least 1970."
-
sailrick at 11:49 AM on 20 January 2011Monckton Myth #2: Temperature records, trends and El Nino
Albatross Perhaps I could have worded that better. Basically he was questioning Table 1 above, which shows UAH as not having global coverage. Here's the article at Grist where the debate is ongoing. http://www.grist.org/article/2011-01-14-climate-change-helped-end-the-roman-empire-says-study Feel free to join in. Skeptical Science is being attacked here, after I referenced it in my arguments, if you need any inspiration. -
LandyJim at 11:30 AM on 20 January 2011Hurricanes aren't linked to global warming
I'm intrigued by the Hurricane story. If the atmosphere is getting warmer then one would expect tropical storms to increase in both frequency and intensity as there would be more energy in the system to power them, therefore one would expect more to become Hurricane force too, so overall average numbers should go up along with their average power. I have decided to do my own research on this, and it hasn't been easy finding reasonably reliable data that goes back a decent amount of time. As it is I have found archive data from ships reports and later monitoring reports of Hurricanes from 1851 to 2010, this later data, from 1995 does indeed see a marked increase in both tropical storms, hurricanes and their relative energy, based on wind speeds, I appreciate that until the more modern era wind speed assumptions for such events have a degree of error in them..afterall people on a ship were a little busy to be doing too much science! I'll be honest, I did not see any real rise or fall in the figures until I got to the 1990's, then both the number of events and the average wind speed has increased. I will plot this information into graphs and publish it for everyone to look at..but it will take a little while..I will also try to get some information, accurate, on how wind speeds were reported, if there has been a change to which tropical storms are recorded, such as a lowering of the minimum speed for recording purposes as this will allow a better understanding of the increase from 1995 on. If there has been no recording change, then the number has most definitely increased, as has the power of the events...and this would certainly imply that there is more energy in the system to power these storm, and that certainly indicates a rise in temperature over this period. I will try to get it online in the next few days..as this intrigues me..Moderator Response: Read the original post carefully. Notice that not all researchers agree with you that "one would expect tropical storms to increase in both frequency and intensity as there would be more energy in the system to power them." It's more complicated than that. -
Berényi Péter at 11:29 AM on 20 January 2011Monckton Myth #3: Linear Warming
"we are not currently at equilibrium as there is a planetary energy imbalance, and thus further warming 'in the pipeline' from the carbon we've already emitted" Except there's no "planetary energy imbalance" there for the last eight years. There's a huge upward shift in OHC data before 2003, however, en masse ARGO float deployment only began in that very year, therefore OHC was not measured properly before 2003.
Net TOA (Top of Atmosphere) radiative imbalance is also measured by satellites. Accuracy of that measurement is extremely poor, but its precision is much better. That is, there's an unknown additive constant for the entire measurement period, but otherwise measurement of relative changes is pretty reliable.
Now, OHC is proportional to the temporal integral of TOA imbalance. This latter quantity, as all climate indicators, fluctuates, but if its long term average is above zero, the integral should have an upward trend with a steady slope. Unfortunately, as I have said, satellite data tell us nothing about the sign (if any) of the imbalance.
But they do tell us there was no downward shift in average imbalance at TOA around 2002-2003. That is, the increase in OHC data at that time is an artifact indeed.
If there's no planetary energy imbalance, the pipeline is empty. If it is empty, we already had the bulk of warming that may come from the slight increase in atmospheric opacity in the 14-16 μm CO2 thermal IR band due to past emissions. If climate response is that fast, equilibrium sensitivity is low. Q.E.D.
There's a huge upward shift in OHC data before 2003, however, en masse ARGO float deployment only began in that very year, therefore OHC was not measured properly before 2003.
Net TOA (Top of Atmosphere) radiative imbalance is also measured by satellites. Accuracy of that measurement is extremely poor, but its precision is much better. That is, there's an unknown additive constant for the entire measurement period, but otherwise measurement of relative changes is pretty reliable.
Now, OHC is proportional to the temporal integral of TOA imbalance. This latter quantity, as all climate indicators, fluctuates, but if its long term average is above zero, the integral should have an upward trend with a steady slope. Unfortunately, as I have said, satellite data tell us nothing about the sign (if any) of the imbalance.
But they do tell us there was no downward shift in average imbalance at TOA around 2002-2003. That is, the increase in OHC data at that time is an artifact indeed.
If there's no planetary energy imbalance, the pipeline is empty. If it is empty, we already had the bulk of warming that may come from the slight increase in atmospheric opacity in the 14-16 μm CO2 thermal IR band due to past emissions. If climate response is that fast, equilibrium sensitivity is low. Q.E.D.
Prev 1981 1982 1983 1984 1985 1986 1987 1988 1989 1990 1991 1992 1993 1994 1995 1996 Next


