


 Arguments


Recent Comments
Prev 1984 1985 1986 1987 1988 1989 1990 1991 1992 1993 1994 1995 1996 1997 1998 1999 Next
Comments 99551 to 99600:
-
Marcus at 16:10 PM on 2 January 2011The 2010 Climate B.S.* of the Year Award
"CO2 AGW theory requires a hotspot to have developed in the tropical troposphere. No observable hotspot. CO2 AGW theory disproved by observable fact." Wow, I do love how these Zombie Memes keep coming back again & again. As someone with a modicum of scientific knowledge will tell you, the hot-spot is supposed to exist *independent* of Global Warming. i.e. atmospheric physics predicts the existence of a hot-spot in the tropical troposphere about 10km above the Earth's surface-a hot spot that is meant to exist whether the troposphere's temperature were warming, cooling or remaining unchanged. The failure to properly identify said hot-spot (it has been detected, just not reliably) says more about the difficulty of detecting the hot-spot with current instruments than it does about global warming. Now a *real* fingerprint of AGW is a cooling stratosphere....oh &, guess what, the stratosphere *is* cooling-i.e. observable fact. Once again, do a little research in future.Moderator Response: To read more, type "hotspot" without the quote marks, in the Search field at the top left. -
Did Global Warming stop in
1998,1995,2002,2007, 2010?
Eric (skeptic) - My "short answer" to BP's claims of a lowered Arctic humidity lie in the data; Arctic humidity is increasing, not decreasing. As to distribution, I will have to disagree most strongly with you. Small scale variations in WV distribution will affect small scale longwave radiation (LR) values; but our satellite measurements of OLR provide large scale values - and it's the global OLR that determines radiation balance. Having worked with fractal systems before, I will point out that once you are looking at a system from sufficient distance, whatever fractal nature is inherent in the system can be accurately dealt with as a parametric evaluation for statistical summary. In addition (as I found your less amplification statement a bit confusing): CO2 warming is extremely smooth on a global scale - local variations of CO2 are of very small values. The WV feedback is driven by CO2, but is an addition based upon CO2 values, not an amplification - the CO2 signature is quite significant in and of itself. Even in the driest conditions, a lack of water vapor will not cause the CO2 forcing to drop to lower values. Lastly, "Outgoing LW is obviously higher in BP's scenario that you linked: - quite true. It's also higher due to Arctic amplification - with the Arctic several degrees warmer than it used to be. If BP is claiming that the OLR from the Arctic is larger than could be expect from actual surface temperatures due to atmospheric window effects, he's going to have to run some numbers and data and prove it. It's certainly not what's been observed by people doing the work. -
Marcus at 16:04 PM on 2 January 2011The 2010 Climate B.S.* of the Year Award
Two of the worst NH winters you say? Only if you live on the Atlantic Coasts (&, even then, not even the worst on record). The Middle East, the bulk of North America & Central Europe-not to mention the Arctic circle-are all suffering above average temperatures this winter-& last winter-& after one of the hottest Summers on record to boot, so do please get your facts straight. As to the proof of AGW-why are we getting a warming trend (which even YOU admit to, apparently) when all the natural forcings (solar output & the PDO) point towards a cooling trend for the last 30 years-a cooling trend which hasn't materialized? Instead, we've had an accelerating warming trend-i.e. the warming trend for the last 30 years has been +0.16 degrees per decade (which was faster than the warming for 1949-1980). Yet look at each decade & you see the following: 1980-1990 had an average temperature anomaly of +0.19 degrees, then 1990-2000 was +0.31 degrees (a difference of 0.12 degrees), then 2000-2010 was +0.53 degrees (a difference of 0.22 degrees). I don't know where you learned maths, but that suggests the decadal change *is* accelerating-consistent with AGW. BTW, at its most extreme, global warming *could* cause Global Cooling. What do you think would happen if sufficient fresh water were to enter the North Atlantic over a relatively short period? Here's a clue-it would reduce the salinity of the North Atlantic which-in turn-could cause the Gulf Stream to slow down-or even stop. That would cause extreme cold in North America & Europe, whilst causing long-term drought in the bulk of Africa, the Middle East & Asia. Of course, someone with a modicum of scientific knowledge-& not merely a reliance on Propaganda-would know that. -
The 2010 Climate B.S.* of the Year Award
memoryvault - You ask "...what IS the "proof" of AGW anyway? Not GW, which has been observable, but "A"GW?" I would suggest taking a look at The Big Picture, which provides just that - an overview of the evidence for warming, for human attribution of the majority of that warming, and what the results of that warming may mean to us. I would also strongly suggest you take a look at How do we know more CO2 is causing warming and The human fingerprint in global warming. If you disagree with the write-ups, I suggest you follow the links on those pages to various peer-reviewed articles presenting the evidence and conclusions discussed. I believe those links will present a great deal of information for you on this topic. -
Eric (skeptic) at 15:37 PM on 2 January 2011Did Global Warming stop in
1998,1995,2002,2007, 2010?
KR, it is not complex at all. If weather on average creates a more uneven distribution of water vapor, then amplification of CO2 warming will be low or even nonexistent. The distribution of water vapor is what matters, not the average amount, whether Arctic or not. Heat works similarly. If lots of cold ends up in the temperate zones and heat in the arctic (e.g. by current negative AO), then that is "global cooling" or maybe just less amplification of CO2 warming. Conversely if air flow patterns are less meridional then there will be more amplification of CO2 warming. This is mostly because the dominant short term factor in earth average temperature is latent heat transfer. The other two are LW and albedo. Outgoing LW is obviously higher in BP's scenario that you linked. Albedo is not as clear (NPI), but a meridional pattern would indicate more clouds (cooling or warming) and more convection (generally cooling). -
memoryvault at 15:33 PM on 2 January 2011The 2010 Climate B.S.* of the Year Award
Marcus 1) What FOX actually may put to air isn't even germane to this discussion. The BS #5 award in the above article was for a news editor advising his staff to offer balanced reporting. If the BS award had been for an example of actual biased reporting I wouldn't be typing this now. But while we're on the subject, what IS the "proof" of AGW anyway? Not GW, which has been observable, but "A"GW? Apart from some increasingly redundant computer models, where's the PROOF of AGW that all these "experts" are privy to? You refer to "climate scientists who can prove global warming is occurring and why it is occurring". Okay, hit me with the "proof" that it's caused by anthropogenic influences, and isn't just a continuation of a cycle that's existed since the last glacial. 2) Again you avoid the issue. BS award #5 wasn't given on the strengths or weaknesses of the so-called "experts" from either side. It was awarded to a news editor who called on his staff to acknowledge there were, in fact, "sides" to the debate at all. See 1) above. 3) Actually, "trends" in climate study are usually expressed in 30 year periods. In fact, many climate graphs and charts are measured in 30 year periods on the horizontal. There's a historical reason for that. It's because we recognised the 25 - 30 year warming - cooling "trend" a long time ago. 4) No "white-wash" "investigation" of the climategate emails has even looked at the HARRY_READ_ME files. You know, the folder where we find a line of code that ensures the progam creates a "warming" trend even when random numbers are fed into it. A line of code appropriately labelled "fudge factor". No "evidence" that AGW "science" is "crap"? How about the "evidence" of observable fact? CO2 continues to increase in the atmosphere. Not only should it be getting hotter, it should be getting hotter quicker. It isn't. CO2 AGW theory disproved by observable fact. CO2 AGW theory requires a hotspot to have developed in the tropical troposphere. No observable hotspot. CO2 AGW theory disproved by observable fact. CO2 AGW theory requires that "winters warm faster than summers". This is actually stated in an article on this site as one of the "fingerprints" of AGW. And observable fact? Three progressively worsening, colder NH winters. CO2 AGW theory disproved by observable facts. But hey, why should anyone believe their own lying eyes when we've got all these "experts" to tell us what the real truth is? Like the latest "global warming causes global cooling" from Professor Rahmstorf at the Potsdam Institute. You couldn't make it up . . . .Moderator Response: Please don't use all caps. Use italics, or if you must, use bold. Also, the claims you have made are addressed in other posts. Either use the Search field at the top left, or click the "Most Used Skeptic Arguments" at the left. We try to keep comments on the relevant thread. In addition to the posts KR linked for you, also type "email" without the quote marks. Then search for "hotspot." -
Eric (skeptic) at 15:11 PM on 2 January 2011The 2010 Climate B.S.* of the Year Award
Marcus, I didn't see your post before I posted, my only beef with your reply is that sunspots are a canard. They have only been low since 2005 and whatever effect they might have is subject to the same delays as CO2 warming (e.g. the ocean could be releasing previously stored heat masking cooling if it exists). -
Eric (skeptic) at 15:05 PM on 2 January 2011The 2010 Climate B.S.* of the Year Award
memoryvault, the easiest argument to rebut is your (3) "there is no cooling right now", lots of threads here on that. I tend to agree about (1) AGW not being debated properly, like I said in #9 above. I have no opinion on (2) and not much of an opinion on (4), they seem a little pointless to argue about. Number (5) is where I have a simple opinion. Climate is aggregate measurements (statistics) of temp and precip, maybe a few other odds and ends like hurricanes. Climate change is the change in those statistics due to long term changes like solar, GHG, etc. Weather can impact climate, for example what happens with weather will help determine the amount of amplification of CO2 warming if any. Weather is mainly the chaotic dynamics but also the cyclical changes, so multi-year ENSO cycles are weather, along with day/night and seasonal change which are sometimes loosely referred to as climate. So while measurements of weather over time are climate, those measurements have to be statistically valid (properly aggregated over sufficient time to determine the long term non-weather changes). -
Bibliovermis at 14:39 PM on 2 January 2011Climate's changed before
Please refer to argument #31. Then refer to argument #1 because "other planets are warming" is just an indirect way of saying "it's the sun". -
Marcus at 14:33 PM on 2 January 2011The 2010 Climate B.S.* of the Year Award
memoryvault. (1)If I can measure the weight of the rain-drops, though, & *prove* they were heavier on average than last year, then I'm off to a better start than the guy who, without evidence to back him, says they're not. The problem with Fox is they give MORE weight to those who claim Global Warming isn't happening-even when they have NO PROOF to back that claim-than to scientists who can PROVE that global warming is occurring & why its occurring. That's not balance, that's BIAS. (2) Refer to (1). Most of the "experts" they rely on actually have NO EXPERTISE to speak of. Those who do often present hypothesis as fact (as per Lindzen & his supposed warm-biased thermometers). Again, why are these people given more weight than those who have more than 80 years of climate records to back their position? (3) That one is simple. If you get a single Summer's day that's colder than the Winter Average, then does that mean Summer ceases to exist? Yet what you're suggesting is equally ridiculous. A year's worth of weather is worth more than a day to a month, & a decade's worth of weather is worth more than a single year. To be statistically significant, though, a trend requires at least 20 years of combined weather events. Even with the cold December of the Atlantic Coast last month, global temperatures for 2010 were still +0.66 degrees above the 1961-1990 average-making it the hottest year since records were first taken. 2000-2010 is also the hottest 11 year period in the last 130 years, in spite of being dominated by the lowest sunspot numbers in a century. (4) Well that's just straight up ad-hominem. You want to provide PROOF, not just more baseless allegations? The fact is that no climate scientists have been found guilty of wrong doing-in spite of the Witch Hunt waged by the anti-AGW crowd, & I've yet to see the anti-AGW crowd provide a single shred of hard data to show that the science was "crap". Meanwhile, all your mates have provided as an alternative is, at best, pseudo-scientific rubbish &-at worst-ludicrously convoluted conspiracy theories that would make the most ardent tin-foil hat wearer blush.Moderator Response: Watch the all-caps, please. -
ghornerhb at 14:28 PM on 2 January 2011Climate's changed before
Hasn't climate also changed, (warming) on other planets and moons at the same time as the earth? Plenty of studies seem to show that to be true. AGW believers then search for any reason they can find to say "yes, but it's happening at the same time for different reasons"... what a coincidence!Moderator Response: [Daniel Bailey] Then you should have no difficulty providing links to those peer-reviewed studies then. We're waiting... And respond on the more appropriate thread "Mars is warming," after reading that post. -
ghornerhb at 14:15 PM on 2 January 2011There is no consensus
I wonder if the "consensus" among AGW supporting scientists is the basic need for government subsidized studies of the supposed "problem?"Moderator Response: [Daniel Bailey] Please refrain from expressions of ideological bias; stick to the topic of the post. Off-topic comments will get deleted. Thanks for your compliance! -
memoryvault at 14:07 PM on 2 January 2011The 2010 Climate B.S.* of the Year Award
Actually thoughtfull 1) Debating "climate change" is like trying to debate the wetness of raindrops. Were last year's raindrops wetter than this years? The "debate" is and always was about Anthropogenic Global Warming - AGW for short. And the opposite of AGW is NON Anthropogenic Global Warming - ie - warming caused by something else. So the BS award #5 goes to a news editor who dared suggest his reporters point out that some people don't agree with the "anthropogenic" part when reporting on possible causes of "climate change". How dastardly of him. 2) Straight ad-hom - "my expert is bigger than your expert nah nah nah". 3) "thinking that individual weather events make a tend" ??????. So, how many "individual weather events" like progressively colder, snowier Northern Hemisphere winters does it take to establish a "trend"? Let me know and I'll watch out for it. "You could look at the number of cold records vs the number of warm records (although better to do that for 30 years or so . . )." Whoever claimed it hadn't been warming? How would this prove the "A" in AGW? And why 30 years - why not 60 years so it takes in the natural cooling cycle that preceded this perfectly natural warming one? Or 600 years so we can take in the longer wave approximately 300 year oscillations that gave us both the MWP and the LIA? "One theory is because the world is warming due to human activity". Yes, a "theory". There are others which fit the observed facts far better that AGW. The best fit to date is the 25 - 30 year alternating warming - cooling cycle overlaid on a longer 300 year alternating warming - cooling cycle. 4) No the wrongdoing on the part of climate scientists HASN'T changed the "climate science" in any way. It was total crap before, during and after the wrongdoing by "climate scientists". In fact the "wrongdoing" was an attempt to hide the fact that the "science" was crap. Go read the HARRY_READ_ME file. 5) I'm sorry, but if medium to long term trends in "weather" are not "climate", then what the heck is "climate"? Enlighten me please? -
Andy Skuce at 13:55 PM on 2 January 2011The Hitchhiker’s Guide to the AGU Fall Meeting
Greg @ 10 I owe you a reply and I apologize for the delay in making it. When composing the article, I chose not to write a lengthy description of the session you were involved in but instead opted to link to Steve Easterbrook's and Steve Mosher's very different accounts. (I also added links to your website and to your open letter). My subjective impressions your contribution to the meeting tend to be closer to Mosher's than Easterbrook's and I felt obligated to say so, bluntly. (Normally, I agree with everything Easterbrook writes and almost nothing coming from Mosher.) I should have made it clear that I don't agree with everything Mosher wrote in his article and I'm sorry that I didn't do that. As you correctly pointed out in your talk, those of us who are alarmed about climate change, professional scientists and amateurs alike, have so far been ineffective in communicating the urgency of the problem to the general public. Of course, many of us who participate at Skeptical Science do so precisely because we want to improve public communication and understanding. Occasionally, that means criticizing those among us who overstate the case--thereby making it vulnerable to attack--as well as those who invite rebuke by indulging in rhetorical excess, as I think you did. This must have been a tough experience for you and I hope that you are not too discouraged by the brickbats. Articulate advocates, like you, who care enough to stand up and speak out are needed and rare. Sincerely, Andy -
ghornerhb at 13:52 PM on 2 January 2011Models are unreliable
The "reliability" of climate models has been has never been backed up by satellite or weather balloon data. Even the UN says they are unreliable. I know this is a rather simple line of reasoning, but I'd rather not use abstract examples. Numbers can be manipulated to show almost anything, so unless the two basic forms of temperature measurement are wrong, the "unreliable" label will be firmly (and rightfully) attached to the "what if" models.Moderator Response: [Daniel Bailey] Incorrect on all counts. If you feel differently, please provide links to supporting sources. -
ghornerhb at 13:40 PM on 2 January 2011Do high levels of CO2 in the past contradict the warming effect of CO2?
To those of you who think Plimer is "cherry picking" and his input ought to be discounted, I would ask you if you think the data collected from the Vostock ice core sample are also suspect? The data used by Al Gore (incorrectly) came from that source. The original tests were taken from 1000 year slices that seemed to back his assumption. The retest, using 100 year slices showed a much different dataset. As the new data was out in print 2 - 3 years prior to the release of "An Inconvenient Truth" Mr Gore was forced to only intimate that increasing CO2 levels were responsible for warming. Of course I'm sure all of you debaters know the data showed just the opposite. Another dataset to consider comes from Temperature after C.R. Scotese http://www.scotese.com/climate.htm CO2 after R.A. Berner, 2001 (GEOCARB III) Particularly the 600 million year chart of both CO2 and temperature, which shows only one other period of time, when both Temp and CO2 levels were as low as they are today. This article also shows a glaciation during the Carboniferous period at a time CO2 levels were just slightly higher (400ppm) than they are today. I really believe the bulk of actual scientific studies, not computer simulations, support the position that IF humans are involved in altering climate... it would be a minuscule involvement at best.Moderator Response: [Daniel Bailey] Then you should have no difficulty providing links to those "bulk of actual" scientific studies then. I assume they were all peer-reviewed, right? -
actually thoughtful at 12:47 PM on 2 January 2011The 2010 Climate B.S.* of the Year Award
MemoryVault's five fallacies 1)That balance means one page for lies to balance one page of truth. Rather balance means understanding that all stories have more than one side and finding out what the other side is. The balance to climate change is not "not climate change" - it is where is the doubt? For example, where is the heat in the oceans? Will the Arctic have ice free summers before or after 2020? Things like that 2)Assuming that someone presenting to Congress automatically is knowledgeable about the subject. Better to consider the validity of the science, or at least the scientist. 3)Thinking individual weather events make a trend. This whole line of thinking is wrong, for the most part. You could look at the number of cold records vs the number of warm records (although better to do that for 30 years or so...). The warm vs cold records is HEAVILY in favor of warm. One theory is because the world is warming due to human activity. 4)Thinking that any wrong doing by the part of climate scientists (if any) has changed the SCIENCE of the climate in any way 5)Thinking weather=climate. It never has and it never will! -
Bibliovermis at 12:13 PM on 2 January 2011A Positive Outlook For Clouds
Constant forcing is an oxymoron, unless the input changes at the same rate as equilibrium is approached. A constant energy input results in a decreasing forcing until equilibrium is reached when energy output reaches that level. -
Did Global Warming stop in
1998,1995,2002,2007, 2010?
Albatross - Thank you, that's what I thought. Arctic water vapor is increasing, not decreasing. Once again, BP has proposed a complex theory of negative feedback that will somehow prevent or limit global warming. And once again, it turns out to be contradicted by the data. Berényi - Arguing from complexity, which is how I (personal opinion) interpret your repeated attempts to propose fractal and critical point issues, does not do your arguments any favors. First: If there is unrecognized complexity affecting the climate system (which you have not established), it could vary in either direction, either reducing warming as you argue or actually increasing it with additional positive feedbacks. Second: Proposing (as you have on several occasions) hypotheses unsupported or even contradicted by the actual data, and that are hence incorrect hypotheses, leads to reader evaluation that you are "crying wolf", and that new inputs from you are not likely to be helpful. -
Albatross at 11:51 AM on 2 January 2011Did Global Warming stop in
1998,1995,2002,2007, 2010?
@BP makes the unsubstantiated (and erroneous) claim that WV content is decreasing in the polar regions. Well, that is certainly not what the ERA-interim data show for the Arctic. From Screen and Simmonds (2010): "A final consideration arises from model simulations which suggest that changes in atmospheric water vapour content may amplify Arctic warming. Increases in water vapour are expected with increasing air temperatures and reduced sea ice cover. In turn, water vapour is a powerful greenhouse gas and can lead to further warming and sea ice loss. In ERA-Interim, specific humidity trends are found only during the summer and early autumn, and are confined to the lower part of the atmosphere (Fig. 4a). The largest humidity increases are found in the Arctic basin. An associated increase in incoming long-wave radiation has probably enhanced warming in summer and early autumn. It is of further interest to determine whether these increases in humidity are locally driven or are a result of increased moisture transport into the Arctic. It is worth noting that the humidity trends coincide with the months of lowest sea ice coverage and largest sea ice declines. The pronounced warming in winter and spring is not accompanied by increases in humidity. A large portion of each total humidity trend is linked to changes in sea ice (Fig. 4b) and, furthermore, to significant increases in the surface latent-heat flux (that is, evaporation) in the Arctic basin (Fig. 4a). The humidity increases at latitudes 50–65 N show weaker links to sea ice and are probably influenced by other processes. However, within the Arctic these lines of evidence support the notion that part of the humidity increase is driven by enhanced surface moisture fluxes associated with sea ice reductions". -
Ken Lambert at 11:30 AM on 2 January 2011A Positive Outlook For Clouds
Soundoff #30 Let me illustrate by example. Dr Trenberth's 0.9W/sq.m positive forcing imbalance equates to 145E20 Joules/year added to the Earth system. The 0.9 is made up of the sums of all the forcings in Fig 4 including the climate responses at the bottom of that table. If the 0.9W/sq.m is sustained we will add 145E20 Joules every year to the system and this energy will melt ice, warm land & oceans at a roughly steady rate of 'X' degC per year/decade etc. Under this constant positive forcing the system will not appproach an equilibrium. The positive forcing has to reduce to reduce energy takeup in order to slow down warming and approach a new equilibrium at a higher general temperature. The +0.9W/sq.m could be reduced by higher cooling forcings (cloud albedo, S-B), or lower positive forcings (CO2GHG, WV + Ice albedo feedback). We could discuss cloud albedo as having wide error bars, and WV + Ice albedo feedback (currently listed in Fig 4 at about +2.1W/sq.m), but the prime cooling feedback is S-B cooling (currently at -2.8W/sq.m) which will increase at T^4 as the Earth's radiating temperature rises. Whichever way you cut it, the +0.9W/sq.m has to approach zero in order for the Earth system to slow down warming and approach a new higher equilibrium temperature. -
muoncounter at 09:46 AM on 2 January 2011The increased greenhouse effect - comparing models to observations
Continuing from here. From #73: "... opening up the so called "Arctic window" for IR radiation with wavelengths above 16 μm ... in a dry atmosphere thermal IR radiation escapes to space almost unimpeded." From #86: "It is 240 W/m2 at -18°C and 315 W/m2 at 0°C. With so many dry-freezed patches of air above the region, most of this radiation escapes to space." Here's a map of outgoing LW radiation for the last week of 2010.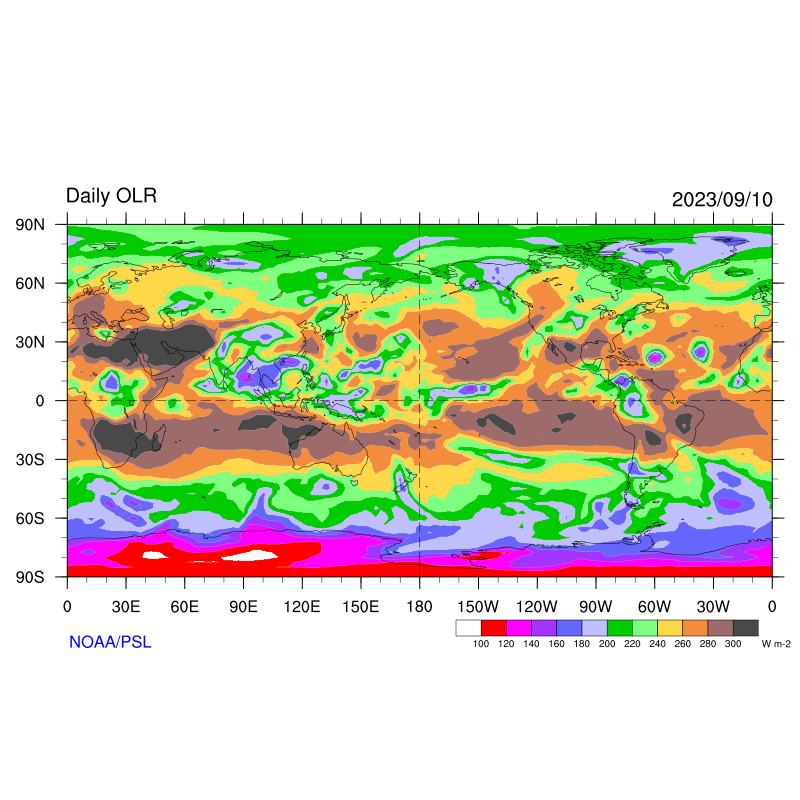 -- similar maps available here.
Most areas above 60N emit less than 180 W m-2. Looks like not-so-much escapes to space unimpeded.
-- similar maps available here.
Most areas above 60N emit less than 180 W m-2. Looks like not-so-much escapes to space unimpeded.
-
muoncounter at 09:44 AM on 2 January 2011Did Global Warming stop in
1998,1995,2002,2007, 2010?
Taking both #86 and #73 together, we may learn quite a lot about outgoing IR radiation from the Arctic. However, this is not the best thread for further discussion of OLR; continuing with comment here. -
Daniel Bailey at 09:26 AM on 2 January 2011Arctic Ice Part 2: A Review of Factors Contributing to the Recent Decline in Arctic Ice
Re: eldorado2768 (22) Welcome to Skeptical Science! PIPS 2.0 is not a reliable measure of ice thickness trends (especially with just 2 data points), as it is a forecasting of predicted conditions, not a snapshot of actual conditions. What Goddard is showing is therefore essentially meaningless. For ice thickness trends, go to the source, PIOMAS: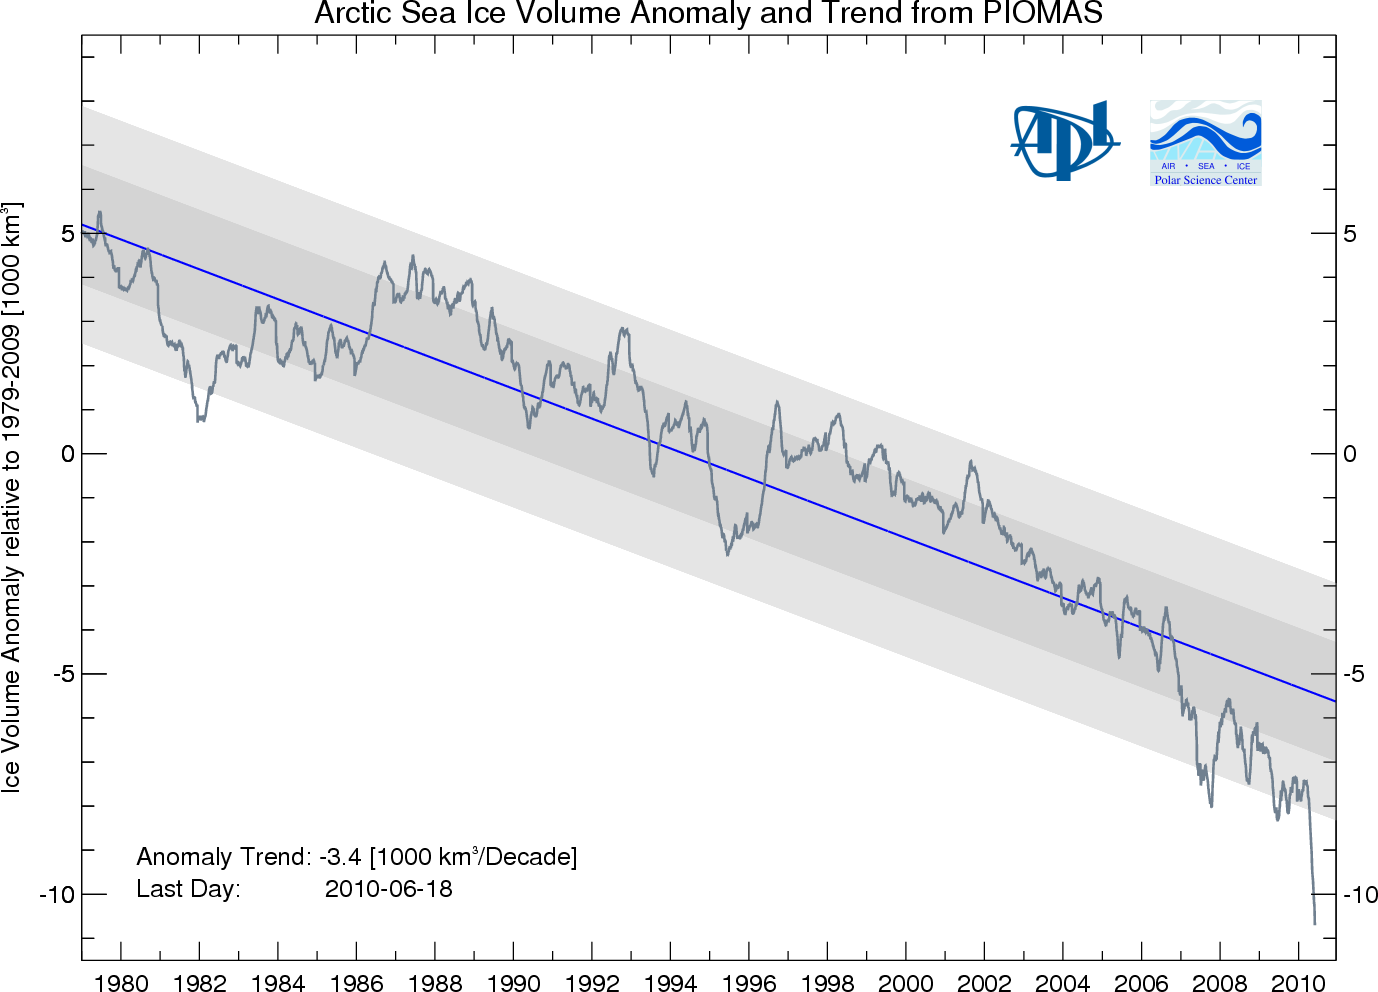 Note the overall downward trend (no "recovery") and the recent "death spiral".
Also it would behoove you to read this post.
And you may want to let Goddard know that PIPS 3.0 has some nicer animations available for next time.
The Yooper
Note the overall downward trend (no "recovery") and the recent "death spiral".
Also it would behoove you to read this post.
And you may want to let Goddard know that PIPS 3.0 has some nicer animations available for next time.
The Yooper
-
Leland Palmer at 08:41 AM on 2 January 2011Positive feedback means runaway warming
Thanks, muoncounter, it's a very interesting paper. Glaciations tend to start gradually, but end abruptly. Various people, referenced in the your paper and the Wikipedia article on the clathrate gun hypothesis, suspect that lower sea levels during those glaciations can cause pressure induced release of methane from hydrates, rapidly increasing atmospheric methane levels leading to an increase in temperatures and higher sea levels. If true, this does demonstrate one thing: large scale methane releases from oceanic hydrates can reach the atmosphere. This is supported by the carbon isotope data from events like the PETM and the End Permian- although direct intrusion of magma from the Siberian Traps volcanism into methane hydrate deposits may have been necessary to trigger the End Permian mass extinction. These carbon isotope data suggest that two to five or more trillion tons of isotopically light methane from the hydrates entered the active carbon cycle during those events. Can our greenhouse driven pulse of heat, which is working its way inexorably downward into the oceans, stimulate a similar rapid release of methane? -
archiesteel at 08:40 AM on 2 January 2011Did Global Warming stop in
1998,1995,2002,2007, 2010?
@BP: "Currently it is colder than average everywhere, except in some regions where no one lives and where "warmer than average" is still damn cold." Actually, right now it is warmer than average everywhere, except in some heavily-populated areas. Of course, an area's population has *nothing* to do with whether or not the planet is warming. To insinuate otherwise is to indulge in a logical fallacy, which seems to have become your specialty as of late. There are 3 million people living in the Montreal area, and it is warmer than average. It is not 'cold', again an entirely subjective appreciation. -
archiesteel at 08:37 AM on 2 January 2011Did Global Warming stop in
1998,1995,2002,2007, 2010?
@Argus: never mind, I didn't noticed you talk about daily highs, I though you meant averages. The link you provided clearly shows that average temperatures are around -6 to -7 (I was a bit too high, but my source wasn't as precise as yours, thanks!) "Are you serious? I was inundated by weather reports and weather maps from frantic so-called warmists" Oh, come on. Contrarians started with the cherry-picking, the only reason people gave counter-examples was to illustrate that cherry-picking. Don't lie in our faces and expect us to believe you. -
archiesteel at 08:33 AM on 2 January 2011Did Global Warming stop in
1998,1995,2002,2007, 2010?
@BP: If temperatures are above average, there they are warmer. The use of the relative term for warmth is pretty useless in this context. You might feel that 0C is "cold", but for me 0C on Jan 1 is unusually warm (I live in Canada). Anyway, this is all useless, as we should talk about global averages rather than individual locations. Furthermore, I though contrarians no longer tried to claim the warming wasn't happening? In fact, I've had deniers swear to me no one seriously challenged the notion that the Earth was warming...and after that you wonder why we don't take you seriously? Give me a break... -
villabolo at 08:26 AM on 2 January 2011Did Global Warming stop in
1998,1995,2002,2007, 2010?
I wanted to thank everyone who posted on my first post for making this a long and interesting thread. Happy New Year's. -
archiesteel at 08:20 AM on 2 January 2011It's cooling
@Chris: I agree with others here, your friend doesn't want to tackle this in a rational way, hence the belief in conspiracy theories involving scientists, NASA, NOAA, etc. The fact is, the Earth is *not* cooling, and we are not currently in a cold phase. It's above zero here in Quebec city, on January 1st. That is very warm indeed. I would suggest to your friend that he come here and post himself, so we can show him the errors of his ways. He better bring along evidence, however... -
Bob Guercio at 08:15 AM on 2 January 2011The 2010 Climate B.S.* of the Year Award
Albatross - 10 Thanks for the link. I listened to the complete testimony and I felt that Lindzen came across as somewhat of a fool; however, Representative Rhorbabacker came across as a fool's fool! This was especially evident when he challenged the scientists on the low level of CO2 compared to other gases such as nitrogen and oxygen. Bob -
Bibliovermis at 08:05 AM on 2 January 2011Antarctica is gaining ice
Today is not 1950, it is 2011. The CO2 levels are higher now than they've been in the whole record of the Vostok ice cores. To say otherwise is denial, plain and simple. To talk about 1950 levels in a discussion concerning today is nothing but misdirection. The spikes were caused by net oceanic outgassing in response to increased solar irradiance from the Milankovitch cycles (orbital variation). The oceans and terrestrial biomes are currently net sinks. The primary source references to validate this claim are available elsewhere on this site. Please post any questions and responses on this matter under those entries. -
vank at 07:43 AM on 2 January 2011Antarctica is gaining ice
The question stands (still...). 130000 years ago CO2 levels = 1950 230000 years ago CO2 levels = 1950 330000 years ago CO2 levels = 1950 If we are raising CO2 levels today who did 1/4 of a million years ago? Thats all i m asking PS muoncounter since the ice cores and data are from Vostok Antarctica research station and if the ice there is melting away lets pay the last tribute to the station, (perhaps they will drill for soil cores in few years) and write here... hope thats ok with uModerator Response: [Daniel Bailey] Ask a question, get an answer. If you want to be taken seriously, when you do get an answer and it contains linked references for you to read as homework it is then incumbent upon you to do that homework. Muoncounter was kind enough to give you some linked references for your gaining an understanding of the subject of your question. Please read them & ask questions on those threads if you have questions therein. Also please read this link as well. Thanks! -
dana1981 at 07:27 AM on 2 January 2011Italian translation of The Scientific Guide to Global Warming Skepticism
Great language for the first Guide translation. Italian is awesome! -
eldorado2768 at 07:26 AM on 2 January 2011Arctic Ice Part 2: A Review of Factors Contributing to the Recent Decline in Arctic Ice
Could someone please comment on this satellite data which appears to show increase in arctic ice thickness over 2 year period from 2008-2010. PIPS Data -
dhogaza at 07:06 AM on 2 January 2011Did Global Warming stop in
1998,1995,2002,2007, 2010?
BP: "Currently it is colder than average everywhere, except in some regions where no one lives..." Yesterday was 6 degrees warmer than average in NY City, and a couple of days ago it was well above average in London. Obviously he's never been to NYC or London, or else he wouldn't make the outrageous claim that "no one lives there". -
Did Global Warming stop in
1998,1995,2002,2007, 2010?
Berényi - Regarding your claims that specific humidity is decreasing in the Arctic: Given that Trenberth recently stated that global water vapor has increased by 4% over the last 30 years (roughly the volume of Lake Erie), I find it difficult to believe that absolute humidity (the water vapor in the atmospheric column, and sets the WV greenhouse level) has decreased over the Arctic, although specific humidity (relative to what the air can hold) certainly might as the Arctic heats up. Again - can you point to any data supporting this position? In particular, if there is data indicating a specific humidity drop, does that represent an absolute humidity decrease as well? -
Did Global Warming stop in
1998,1995,2002,2007, 2010?
Berényi - Your statement "Currently it is colder than average everywhere, except in some regions where no one lives and where "warmer than average" is still damn cold" could well be considered a class example of the Cherry Picking fallacy, with a slight admixture of It's not bad. Some regions are colder, some are hotter - weather patterns are changing. The full data for the globe indicates increasing temperatures. Significantly increased temperatures (even if they are still cold from your perspective) are leading to ice deposition/melt rate changes; we're looking at long term albedo changes (highly positive feedback) and sea level rise. Personally, I consider those significant issues. Can you point to data that indicates that it's "colder than average everywhere?" Perhaps from this site, or somewhere else with a reasonable amount of data? I'm also interested in any data demonstrating your claims that specific humidity (or much more importantly, absolute humidity) is decreasing on a large scale, whether in polar regions or elsewhere. Can you point to the data in that regard? I have not heard this statement elsewhere. -
Paul Barry at 05:14 AM on 2 January 2011The Scientific Guide to Global Warming Skepticism
Eric, Thanks for that additional graph. It follows with what has been said in the comments above. I've no trouble imagining how ENSO causes variability - steps in the progression of ocean warming. The problem is still the relative scale of these steps. Rob Painting, I think you agree with that too. Of course I'm not skeptical about ocean warming. It's happening. I just want it to see it presented realistically. We know how 'skeptics' behave when they see graphs that are questionable. That graph based on Murphy et al is, I'm afraid, not very realistic. Thanks especially for that last link which I think covers the issue of ocean acidification well. I don't think there is anything wrong with reproducing the particular FAQ entry from that site here which I think is a good explanation. I particularly like the way he throws in some numbers too to give you a sense of proportion: Won’t the CO2 outgas as the oceans begin to warm up, therefore cancelling out the problem? The CO2 content of the surface waters of the oceans responds to both changes in CO2 content of the atmosphere and changes in temperature. For example, if ocean temperatures were not changing, a doubling of preindustrial CO2 levels (from 280 to 560 ppm) would cause an increase in the total amount of dissolved carbon in the surface ocean from about 2002 to 2131 micromoles/kg of seawater (assuming salinity = 35, temperature = 15°C, and alkalinity = 2300 micromoles/kg). If ocean temperatures warmed by 2°C over that period, then less carbon would be taken up (the increase would be from 2002 to 2117 micromoles/kg). Thus, a 2°C increase in temperature results in about a 10% decrease in carbon uptake in surface waters. The expected warming of the oceans also may alter ocean circulation, further reducing their capacity to absorb CO2 from the atmosphere, but the excess CO2 will still remain in the atmosphere and drive further acidification. For pH, the net effects of climate warming on atmospheric CO2, CO2 solubility, and chemical speciation approximately cancel out. — Scott Doney, Senior Scientist, Woods Hole Oceanographic Institution, USA; Joan Kleypas, Scientist III, National Center for Atmospheric Research, USA The problem of this apparent contradiction being a stumbling block probably won't arise too often (it's nothing near a killer argument for overall climate-change denial), but if we can answer these kinds question easily without getting grumpy and defensive it does wonders for our ability to convince others that we might know what we are talking about. Something has been achieved here. I think a Skeptical Science guest blog on the complexity of CO2/ocean interaction is in order! Many thanks to all. -
SoundOff at 04:35 AM on 2 January 2011A Positive Outlook For Clouds
Ken Lambert #28, "The equilibrium will never be reached if a positive forcing is sustained." --- As long as no increase in forcing occurs (it is only sustained), equilibrium will reached. This is the very basis of equilibrium. I'm very familiar with Trenberth's figure 4. It's the reason I stated other non-CO2 forcings neutralize each other. We'll just disagree on the "two points in time" issue you’ve raised, as it's not clear to me why this is even a pertinent issue. If two point-in-time temperatures are not a function of any time lapse, only of the forcing, the temperature increase is simply the difference between the two point-in-time temperatures regardless of the time lapse between the two points. Adding in a time lapse is only useful to see the rate of temperature increase. Perhaps I’m misunderstanding your issue. -
michael sweet at 04:14 AM on 2 January 2011Did Global Warming stop in
1998,1995,2002,2007, 2010?
Argus, I am still waiting for your to produce data on a location that is colder than average. Hot locations support my position that it is still warming. Yesterdays weather map shows a high of 13C for Greenland. So much for cherrypicking a single day. I just report the high for the day we are having a discussion. According to BP's source that is about 16C above normal. The average temperature this month was higher than the normal high temperature. I call that boiling hot. The weekly anomaly graph shows 6-9C hot for this week in coastal Greenland. The original discussion was about global anomalies: it appears that December will be above average, in spite of the strong La Nina that should have made it below average. 2010 will be either the hottest or second hottest on record. Your assertion that December would be cold is wrong. Your assertion that it is not warming is wrong. BP: "Warm snow= rain" Everyone knows that if it is -10C and it warms up 5C it is still cold enough to snow. You are being a pest with your absurd and contradictory arguments. It is a waste of time to respond to the Gish Gallop that you are doing when you are obviously not seriously raising issues. Please do not use up space if you are only trying to be annoying and not contributing to the discussion. Moderators: are Gish Gallops allowed by the comments policy? -
Chris Winter at 03:42 AM on 2 January 2011It warmed before 1940 when CO2 was low
Link for Tamino's "volcanic lull" page: http://tamino.wordpress.com/2010/08/23/antrhopogenic-global-cooling/ (The transposed letters — antrhopogenic — are in the link.) The URL here (both basic and intermediate) is apparently out of date.Moderator Response: [Daniel Bailey] Thanks, Chris, for bringing that more recent Tamino post to our attention. Tamino's newer post, which you cite, looks at the overall warming and cooling trends of the 20th Century as a whole and examines supporting evidence to understand them. Anne-Marie Blackburn based this post largely on Tamino's earlier post, Volcanic Lull, which looked specifically at the volcanic contributions to global temps earlier in the 20th Century (I've supplied a working link to it in this response). Future versions of this post will have the correct updated URL in the main text. Thanks for the help! -
Berényi Péter at 03:41 AM on 2 January 2011Did Global Warming stop in
1998,1995,2002,2007, 2010?
#87 Argus at 01:56 AM on 2 January, 2011 It seems that the the vast majority of so-called warmists are also male, so what was it you were trying to hint at? What he is trying to say perhaps is since the vast majority of mathematicians is male, math is also crap. One should go directly after the big picture instead of painstaking obsession with details (called "proofs" by members of that nerdy tribe). The same goes for physicists with all their meticulous experimental & observational hocus-pocus. #65 JMurphy at 23:20 PM on 30 December, 2010 It's also worth trying to think beyond what a so-called skeptic would call his (let's face it, the vast majority of them are male) world - what he can see out of his window and what he has experienced personally. Doing this will allow one to look at the heavy precipitation as snow in the Northern Hemisphere and the heavy precipitation as rain in the Southern Hemisphere. Are they linked in some way? Is this more evidence of the increase in precipitation predicted as the world warms? It is predicted, indeed. The only problem is warm snow, unlike the one we are having, is called rain. It also allows you to understand why it can be very cold around your own locale, while the world as a whole is warmer than average. Let's be a bit more specific. Currently it is colder than average everywhere, except in some regions where no one lives and where "warmer than average" is still damn cold. As I say, it's very difficult to persuade any so-called skeptic who is set in his ways and who cannot think outside his own boundaries. Perhaps it is linked to a report I read about recently, which seems to suggest that people of a certain (right-wing) perspective had a "more pronounced amygdala – a primitive part of the brain associated with emotion...". Now, that's preposterous. You should immediately provide peer reviewed references to support this abominable insinuation. -
Argus at 03:33 AM on 2 January 2011Did Global Warming stop in
1998,1995,2002,2007, 2010?
archiesteel #83: "That's for the entire month, Argus. The average for December 30 is closer to -7 and -8C." From where did you get this particular average? It does not seem to agree with this link: http://www.dmi.dk/dmi/index/gronland/klimanormaler-gl.htm Also, a Happy New Year to you and the other debaters on this friendly website, and a pleasant winter to the inhabitants of Qeqertarsuatsiaat and Ittoqqortoormiit! -
Argus at 03:20 AM on 2 January 2011Did Global Warming stop in
1998,1995,2002,2007, 2010?
muoncounter, #89: "The question of this thread will not be solved by dueling with weather reports. Yet you gave weather reports here and here." Are you serious? I was inundated by weather reports and weather maps from frantic so-called warmists, who were trying to impress me with hot spots and odd temperature readings on Greenland and in remote parts of Canada. I was simply replying to a couple of them. -
Argus at 03:09 AM on 2 January 2011Did Global Warming stop in
1998,1995,2002,2007, 2010?
Ganesha, #84: "- Are you claiming that thermal radiation is "target-aware" and will not radiate in the direction of any body that is "colder"? Can you clearly describe how that mechanism works? And is there a limit to the distance by which object one's thermal emissions will be "aware" of a "colder" body that might be in the path of its thermal radiation?" I don't quite understand the question. When you write "colder", do you really mean "warmer"? Anyway, there is no selective mechanism involved in heat radiation. Any body warmer than absolute zero radiates heat in all directions, in varying amounts and in varying frequencies depending on body temperature. If two similar bodies (with different temperatures) are near each other, both will radiate heat in all directions (also onto each other), but the net heat transfer between them will still be from the warmer one to the colder one, because the warmer one sends more than it receives, and the other one receives more than it sends. -
muoncounter at 02:55 AM on 2 January 2011Did Global Warming stop in
1998,1995,2002,2007, 2010?
#89: "So what? It's just weather." Indeed. The question of this thread will not be solved by dueling with weather reports. Yet you gave weather reports here and here. But 'tis the season. In these dark days of winter, skeptics and their denialist shadows love the weather reports. Which begs the question: Why, come the opposite solstice, do they hide from the harsh glare of summer sun? -
Argus at 02:53 AM on 2 January 2011Did Global Warming stop in
1998,1995,2002,2007, 2010?
Albatross, #85: " I cannot understand why you would blindly follow BP's bizarre reasoning and unsubstantiated claims." Can you please tell me, succinctly and scientifically, what is wrong in BP's #73? -
Argus at 02:21 AM on 2 January 2011Did Global Warming stop in
1998,1995,2002,2007, 2010?
archiesteel, #81: "... but ironically, you just proved msweet's point: all the temperatures you provide for the south and west coasts of Greenland are above average." Who said they were not above average? Not me. I simply wanted to show that the cherrypicked freak temperature of +14 was not typical for Greenland at present, which is was he seemed to be implying. Also, no irony here, and I did not "prove" anybody's point, especially not M. Sweet's. It has been somewhat milder along the eastern/southern coast of Greenland lately. So what? It's just weather. -
Alec Cowan at 02:16 AM on 2 January 2011Did Global Warming stop in
1998,1995,2002,2007, 2010?
@Berényi Péter #86 What's the usefulness of that wunderground site? I've just found there some data about my area that contradict each other or are far from the data provided by the local weather service. Supposedly temperature records are unreliable but all of a sudden some picked records from that site made to the rightness of your argumentation. Also, you as a 37° human being living in a planet of 15° averages are commenting about temperatures next to the Arctic Circle, around the Winter solstice, using human representations for comfort -for instance, "warmth"- mixed with data in watt per square meter, all in order to what? misrepresenting the ideas Michael Sweet wrote? C'mon! You surely know better.
Prev 1984 1985 1986 1987 1988 1989 1990 1991 1992 1993 1994 1995 1996 1997 1998 1999 Next


