


 Arguments


Recent Comments
Prev 1991 1992 1993 1994 1995 1996 1997 1998 1999 2000 2001 2002 2003 2004 2005 2006 Next
Comments 99901 to 99950:
-
Daniel Bailey at 10:51 AM on 29 December 2010Is it safe to double atmospheric Carbon Dioxide over a 200 year period?
Re: GC (107) Thanks for the heads-up on your interesting article. Let me know when you append to it. I will be circumspect. The Yooper -
muoncounter at 10:06 AM on 29 December 2010Did Global Warming stop in
1998,1995,2002,2007, 2010?
#35: "... the world is getting warmer and that human activity is the cause--obviously it is." Great! "a rate of warming that merits the level of hysteria exhibited by some in the field of climate change" Can you provide evidence of this 'level of hysteria'? I'm more familiar with deniers becoming hysterical, especially when their claims are refuted. See the existing thread 'Is the IPCC alarmist?' for further discussion. -
villabolo at 09:55 AM on 29 December 2010Did Global Warming stop in
1998,1995,2002,2007, 2010?
Argus with reference to your comparison between 'skeptics' and 'warmists' in #19 there is a distinction to be made. 'Skeptics" always cherry pick their dates and places as well as give contradictory responses (They would mention 'Global Cooling' one moment and 'natural' warming the next.). It's the big picture that counts-that cannot be said often enough. Let's take the winter of 2009/2010 which was similar to ours. Just by eyeballing NASA satellite images you could tell that only about 10-15% of the Earth was cooler than normal while the other 85%+ was much hotter. The Arctic Ocean and most of Canada was 5-10 degrees Celsius warmer! The Southern Hemisphere had the hottest year on record. It is with this knowledge that you can then proceed to highlight individual events. Skeptics NEVER take the big picture. -
dhogaza at 09:45 AM on 29 December 2010Did Global Warming stop in
1998,1995,2002,2007, 2010?
Looking at your graph in Figure 3, I'd say that the data shows warming at a rate of around 0.15 deg/decade. While that amount of warming will undoubtedly cause many changes for our planet, I'm not sure those changes should be labelled "catastrophic".
Note that this will accelerate because 1. the planet hasn't reached equilibrium thus even if CO2 were held constant as of today we'd continue to see temperatures rise for a long time. 2. we're adding CO2 to the atmosphere at an exponential rate, which will increase the rate of additional warming on top of that in the pipeline. Also understand that a 0.15 deg/decade rise in global temps means a rise at two or three times that rate over north america and eurasia. And lastly, "CAGW" is a denialist term. Climate scientists don't use it. And the mainstream position is that we still have time to limit warming to 2C if we take sufficient action now, though it's becoming increasingly obvious that we won't. The point, though, is that it's not scientists talking about "CAGW" as some sort of horror story foregone conclusion. -
Nederland at 09:22 AM on 29 December 2010Did Global Warming stop in
1998,1995,2002,2007, 2010?
You asked what the past 30 years of temperature data really show. Looking at your graph in Figure 3, I'd say that the data shows warming at a rate of around 0.15 deg/decade. While that amount of warming will undoubtedly cause many changes for our planet, I'm not sure those changes should be labelled "catastrophic". Please note that I am not denying that the world is getting warmer and that human activity is the cause--obviously it is. What I am asking is this: does the current evidence suggest a rate of warming that merits the level of hysteria exhibited by some in the field of climate change? Right now, I would have to say no. -
Esop at 09:11 AM on 29 December 2010Did Global Warming stop in
1998,1995,2002,2007, 2010?
About cold and warm temp records: 19 countries set national all time warm records in 2010 while only a single one set an all time low national record. The only thing that is relevant when discussing whether AGW is happening or not is the long term trend in average global temperature. 2010 will almost certainly be the warmest on record in most datasets. In case someone missed it, the average global temperature last week (UAH lower troposphere) was the highest on the posted record. As long as the global average is at the highest level recorded, warm local records are a natural and expected result of that, while local cold records are interesting and shows us that increasing the energy imbalance of the system does not cause even warming all over, but can cause local cold snaps as well. That tells us that it is even more crucial to cut greenhouse emissions and reduce the energy imbalance than if warm weather was the only problem, so skeptics highlighting unusual weather when the average is at record high levels would normally not be such a bright idea. However, the MSM love to lap up the disinformation and feed it to the ignorant masses, so the "skeptic" tactics work. -
Esop at 08:52 AM on 29 December 2010Did Global Warming stop in
1998,1995,2002,2007, 2010?
#32 (dhogaza): Priceless :) Let us see if the current normal (and above normal temps) in England continue and what Mr. Corbyn will have to say. I would not be surprised if they drop again, though. Something is majorly messed up with the Arctic circulation patterns. -
kdfv at 08:33 AM on 29 December 2010It's freaking cold!
I have just been looking at the NCDC US climate at a glance for November 2010 depature from normal http://www.ncdc.noaa.gov/oa/climate/research/cag3/cag3.html It shows the temperatures generally around 4 to 6 degrees above normal. Yet when I view the US temperature map for the same month accessed from the same page it just shows the majority of states at or below normal? I don't see how the two maps relate. -
LucAstro at 08:31 AM on 29 December 2010A Positive Outlook For Clouds
Thanks for this summary on clouds effects on AGW. -
Rob Painting at 08:16 AM on 29 December 2010The Scientific Guide to Global Warming Skepticism
Paul Barry @ 48 - The example of positive feedback on page 3 has a caption saying “Warming causes oceans to give up more CO2”. Elsewhere we are told that the oceans are getting more acidic - i.e. more dissolved CO2. So which it? Is CO2 in the ocean going up or down or both? Is it different in different places? Is one from the deep sea and the other not? Why is it so paradoxical, if so? The following graphic from NOAA gives an idea of John what is talking about: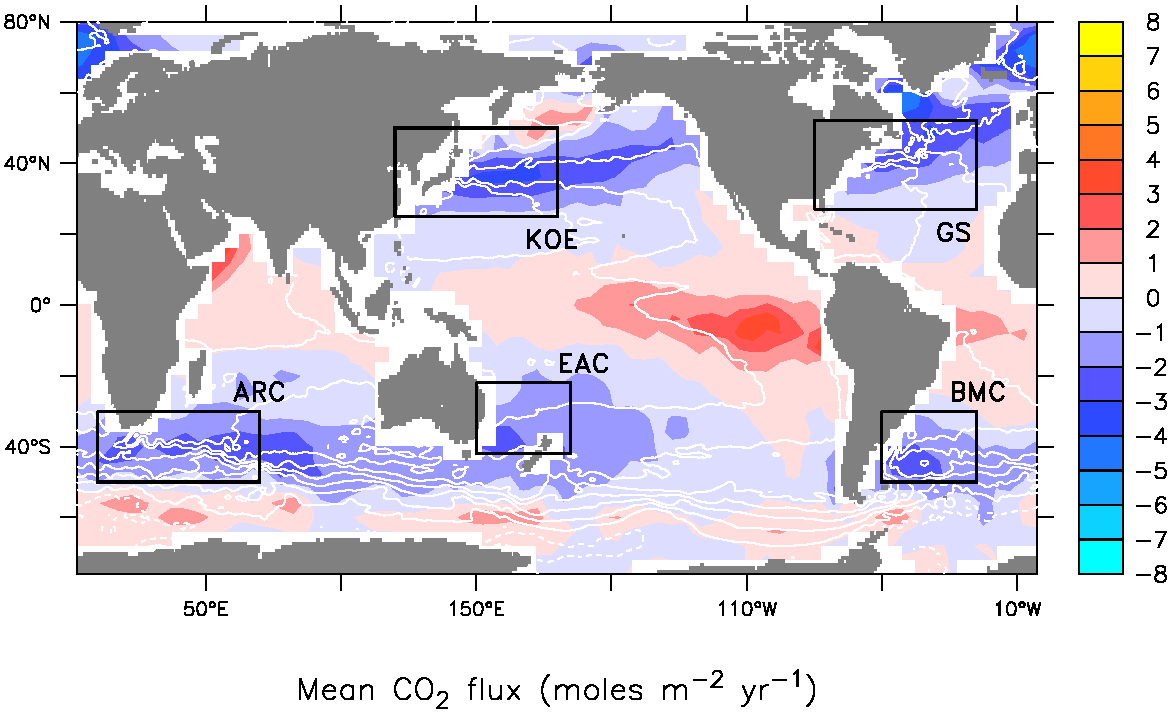 A simplified version is that CO2 is less soluble in the oceans at higher temperatures. You can see the band of CO2 flux to the atmosphere around the tropical regions, where water temperatures are higher, and the absorption of CO2 in cooler waters (Note the obvious warming around Antarctica & flux of CO2 to the atmosphere).
So you can see that both absorption and release of CO2 from the oceans can occur at the same time, it's a matter of temperature, the net effect at the moment is seeing CO2 build up in the ocean, as also evidenced by increasing ocean acidification measurements and declines in carbonate saturation states. So there's no contradiction.
Now as the oceans continue to absorb more heat their ability to store CO2 will diminish, and we'll see the red regions in the graphic start to rise.
A simplified version is that CO2 is less soluble in the oceans at higher temperatures. You can see the band of CO2 flux to the atmosphere around the tropical regions, where water temperatures are higher, and the absorption of CO2 in cooler waters (Note the obvious warming around Antarctica & flux of CO2 to the atmosphere).
So you can see that both absorption and release of CO2 from the oceans can occur at the same time, it's a matter of temperature, the net effect at the moment is seeing CO2 build up in the ocean, as also evidenced by increasing ocean acidification measurements and declines in carbonate saturation states. So there's no contradiction.
Now as the oceans continue to absorb more heat their ability to store CO2 will diminish, and we'll see the red regions in the graphic start to rise.
-
thepoodlebites at 08:15 AM on 29 December 2010It's Pacific Decadal Oscillation
Re: #43 Thanks for the link, I like the title "Open Mind," with the Douglas Adams subtitle. Don't really care for the name-calling but I guess it comes with the territory. The GISS baseline of 1951-1980 is during mostly negative PDO, while the UAH 1980-2000 is during mostly positive PDO. The UAH baseline is warmer than GISS which explains some of the differences. Comparing the 12-month running means using the same 1980-2000 baseline, there doesn't appear to be any significant warming since the 1998 El Nino. But the GISS plot in post #39 seems to show an upward trend continuing through 2008. I think that the GISS plot is misleading, which is unfortunate. Please allow me to review the material more and get back to you. I'm concerned about the integrity of the surface observing sites that GISS et al. uses, possible contamination from urbanization. The satellite data represents better ground-truth, I think. Whenever raw observations are altered (corrected), the data no longer represents ground-truth but are best described an an analysis. -
gallopingcamel at 08:12 AM on 29 December 2010Is it safe to double atmospheric Carbon Dioxide over a 200 year period?
Daniel Bailey (@87), It took a while but I managed to write up my visit to NOAA in Asheville that look place in October. You and "scaddenp" requested a link so here is the first of two parts: http://diggingintheclay.wordpress.com/2010/12/28/dorothy-behind-the-curtain-part-1/#more-1204 By sending you the link I have "outed" myself. How will that work out? -
dhogaza at 07:23 AM on 29 December 2010Did Global Warming stop in
1998,1995,2002,2007, 2010?
"Just to be clear you're telling the population of the UK the weather is "dead normal" at the moment?" As of 8:18 PM the temperature in London was 45F. Average high for January is 45F. -
Bibliovermis at 07:10 AM on 29 December 2010Lindzen and Choi find low climate sensitivity
I see the post I was replying has been removed through moderation. The contention was that satellite temperature data showed a decreasing temperature. -
Bibliovermis at 07:07 AM on 29 December 2010Lindzen and Choi find low climate sensitivity
George White (co2isnotevil), That is a wholly false contention. Why did you link to a unreferenced chart? What source data did you use? What atmospheric level? Why did you convert the data to absolute temperature rather than leave it in its native temperature anomaly format? It's interesting that your purported satellite data shows no spike in 1998. Here is the actual satellite temperature data. Source: University of Alabama in Huntsville - lower troposphere satelitte temperature data Moderator Response: The post you are responding to was deleted due to a number of off-topic and inflammatory comments. If you would like to discuss the temperature record, please move the discussion to Are surface temperature records reliable? or Warming Stopped in 1998.
 -
Alexandre at 07:03 AM on 29 December 2010A Positive Outlook For Clouds
Dana, thanks for the post. That figure says roughtly the same thing I've seen on Dr. Archer's lectures (recommended, btw). But I have also heard otherwise, and Nasa's figure on your link has arrows with different proportions. Are these rough behaviours still subject of considerable uncertainty? Or can it already be said for sure that high clouds mainly retain heat whereas low clouds mainly reflect sunlight? -
Albatross at 06:47 AM on 29 December 2010It's Pacific Decadal Oscillation
Re #43: Please read this. And also note the trend in global SATs associated with previous moderate to strong La Nina events (ONI <-1.0. Global SAT anomalies from GISTEMP are for the latter year for each event relative to 1951-1980 baseline: 1949-1950: -0.16 C 1954-1955: -0.10 C 1955-1956: -0.17 C 1964-1965: -0.11 C 1970-1971: -0.10 C 1973-1974: -0.08 C 1975-1976: -0.16 C 1984-1985: +0.04 C 1988-1989: +0.19 C 1998-1999: +0.32 C 1999-2000: +0.33 C 2007-2008: +0.44 C 2010-2011" +0.50 C (?) -
RSVP at 06:39 AM on 29 December 2010Stratospheric Cooling and Tropospheric Warming - Revised
Both of you guys can do yourselves a favor by going to this website (there are many others)... http://www.engineeringtoolbox.com/radiation-heat-transfer-d_431.html q = ε σ (Th4 - Tc4) Ac ...and note that radiation loss depends on two distinct temperatures. That of the emiter AND the receiver. That is your last heads up from me. See ya. -
thepoodlebites at 06:10 AM on 29 December 2010It's Pacific Decadal Oscillation
#39 Why does NASA's Global Land-Ocean Temperature Index differ so much from satellite Weekly Global SST anomaly plots and UAH Global Average Tropospheric Temperature plots? Specifically, compare 2008 data points. The NASA plot shows (+.42) but both weekly SST anomaly and lower tropospheric measurements were near or below zero in 2008. We could be headed back down to 2008 levels or lower, considering the switch from El Nino to La Nina, and current -PDO, -NAO, although the SST website says La Nina seems to be bottoming out. The 2010 El Nino was similar to 1998 and contributed to the higher global average in the first half of 2010, just like in 1998. I tried to provide web links but had trouble getting them to show up properly in the preview. The SST data are from bobtisdale.blogspot.com, Roy Spencer provides the lower tropospheric data, UAH. -
Paul D at 06:04 AM on 29 December 2010Did Global Warming stop in
1998,1995,2002,2007, 2010?
HR: "Do crops get damaged by weather or climate?" Erm, I live in the UK and often listen to a BBC radio programme called 'farming today'. Firstly lets start with the weather on the South Coast from Sept through to Dec 2010. Basically from Sept to Nov, it was incredibly warm for the time of year. Secondly the warm weather generally has resulted in bumper crops in some cases, the main problem is harvesting vegetables (eg. brussel sprouts). According to a organic farmer on 'farming today', he can harvest most of his crop at temperatures down to -10. Below that, the crop rots when it thaws. Actually what we do have in the UK is crop migration due to warming, which is why Camel Valley vineyard in Cornwall no longer has to use poly-tunnels to protect their vines. You also seem to have forgotten that Wheat prices have shot through the roof due to Russian droughts and wild fires. As has been stated in previous comments, a graph of crop yields has little to do with eventual production figures, carry over etc. The subject of climate change impact on farming and species is complicated. Simple statistics do not show crop migration (farmers adapting to changing climate) and other issues. UK organisations such as the Tree Council and the Forestry Commission are looking at trees that will grow in changing climates in the UK, including Oaks that have adapted to warmer climates in France.Moderator Response: Additional discussion of crops must move to a more relevant thread such as "It's Not Bad." -
dana1981 at 06:01 AM on 29 December 2010A Positive Outlook For Clouds
Nick - water vapor is a significantly less powerful greenhouse gas than CO2. It's just more prevalent in the Earth's atmosphere, thus it accounts for more of the greenhouse effect. Atmospheric water vapor will indeed increase as the planet warms - there's really no question about that. 'Skeptics' like Lindzen simply postulate that the negative cloud feedback will be so strong as to overwhelm both the CO2 forcing and all positive feedbacks, including water vapor. I can't speak for how sure Lindzen is, but I think the evidence clearly shows that we would be unwise to put our eggs in the 'cloud feedbacks will save us' basket. -
Nick Palmer at 05:26 AM on 29 December 2010A Positive Outlook For Clouds
If we speculate that there will be more clouds around as a feedback to CO2 induced warming, there will also be more water vapour around (needed to form them). Leaving aside the reflectivity due to the clouds, there will be plenty more water vapour (uncondensed) in the areas between and under the clouds. I am probably showing the limits of my knowledge here, but, as water vapour is a more powerful greenhouse gas than CO2, have Lindzen et al taken into account that whilst his hypothesized "Iris" like effect is reducing the radiative forcing, the increased water vapour necessary to generate the extra "Iris" clouds will be increasing the forcing right back up again? How sure is Prof. Lindzen which effect will dominate? Anyone? -
Phila at 05:19 AM on 29 December 2010Did Global Warming stop in
1998,1995,2002,2007, 2010?
Albatross: Now either you support that trickery or you do not. So, where do you stand on that? I think HR's use of a cherrypicked FAO graph answers that question for him. Meanwhile, FAO's 2009 Profile for Climate Change notes that "Climate change negatively affects the basic elements of food production, such as soil, water and biodiversity." Furthermore, "it affects all four dimensions of food security: food availability, food accessibility, the stability of the food supply and the ability of consumers to utilize food including food safety and nutritional value." Therefore, "Action is needed now, [because] inaction will significantly increase future costs." In other words, FAO seems to agree with this article's claim that AGW is "more than enough to disrupt weather systems and cause severe damage to crops and human populations." -
Eric (skeptic) at 04:16 AM on 29 December 2010The Scientific Guide to Global Warming Skepticism
Paul Barry, my explanation for (b) is that like most parts of the climate system, ocean heat storage is not a nice monolithic, even process. The graph in the guide is crude. But looking at the ENSO numbers here http://www.cpc.noaa.gov/products/analysis_monitoring/ensostuff/ensoyears.shtml it shows that whenever there is strong El Nino (ocean releasing heat) there is a leveling off or dip in the OHC chart (e.g. early 80's, early 90's, 1998). So basically the ocean is storing heat over the long run but the rate of storage can fluctuate based on weather-related ENSO cycles in the Pacific. -
Albatross at 04:15 AM on 29 December 2010Did Global Warming stop in
1998,1995,2002,2007, 2010?
HR @27, This thread is about skeptics cherry-picking dates to fallaciously and misleadingly make claims about global temperature trends, and changing their dates for "global cooling". Now either you support that trickery or you do not. So, where do you stand on that? Then you can address your unreferenced graph and claim that crops are holding up "pretty well"-- although that discussion is probably better suited on another thread. -
Hyperactive Hydrologist at 03:56 AM on 29 December 2010Did Global Warming stop in
1998,1995,2002,2007, 2010?
This is why temperature changes need to be considered on the decadal timescale. HM, poor choice of graph. That is just showing yield of crops per unit area which is pretty much meaningless in the context of your argument. Of course crop yields are going to increase as agriculture becomes more intensive. I bet those figures also correlate quite nicely with fertiliser production. -
HumanityRules at 03:35 AM on 29 December 2010Did Global Warming stop in
1998,1995,2002,2007, 2010?
"While these increases do not sound like much they are more than enough to disrupt weather systems and cause severe damage to crops and human populations." Do crops get damaged by weather or climate? Long term agriculture production seems to holding up pretty well in the face of this onslaught.
-
Bibliovermis at 03:22 AM on 29 December 2010Is it safe to double atmospheric Carbon Dioxide over a 200 year period?
Batsvensson, Indignation is not a viable substitute for published research. If your way of thinking is based on indignation than you are correct that it isn't compatible with a way of thinking based on independently validated, empirical research. -
HumanityRules at 03:08 AM on 29 December 2010Did Global Warming stop in
1998,1995,2002,2007, 2010?
24 dhogaza So you are using two predicted temperature reading from one location to re-inforce the idea that Argus is a terrible cherry-picker? No comment. Just to be clear you're telling the population of the UK the weather is "dead normal" at the moment? -
archiesteel at 02:45 AM on 29 December 2010Is it safe to double atmospheric Carbon Dioxide over a 200 year period?
@batsvensson: "This is indeed true, nor have the skeptic publish a paper which demonstrate that the ears of the global warming camp has no significant effect on the climate system. But should a precaution principle make us cut them off anyway? I don't think so." This is a ridiculous, and faulty, analogy. The "global warming camp" hasn't claimed its ears have an effect on climate, nor do they have a mountain of evidence to support it. Meanwhile, the growing body of evidence supporting AGW cannot be ignored by skeptics. If they want to disprove it, they need evidence presented in peer-reviewed paper to support their claim. AGW being the accepted science, the burden of proof is on skeptics to disprove it. "It seams to me that the aim of this article is not to present a objective scientific picture but to paint up all skeptical people as being a minority with lunatics ideas." I don't get that, however it is true there are very few skeptics who seem to follow the scientific method while promoting their views. Case in point: the many contrarians on this very web site who keep repeating the same debunked theories, jumping from one topic to the next when cornered and confronted with their own contradictions. "Unfortunately what you believe is far for the truth and even more unreachable is the idea of coming to an understanding in each others way of thinking." Science is not negotiations. There's no "two sides to each story." There's the truth, and our attempts to get to it. We don't have to "come to an understanding" with skeptics, deniers and contrarians: they have to come up with the evidence to support their claims, and be prepared to admit they were wrong when their arguments are defeated. -
muoncounter at 02:42 AM on 29 December 2010Lindzen and Choi find low climate sensitivity
#429: "I understand there are many time constants,... " Merely stating that you understand something doesn't necessarily make it so. We've heard all about time constants before. And yet the basic disregard for the entirety of thermal inertia evidenced here and in other prior postings continues. "the 25 years of data I used was to extract the response ..." Except, as pointed out in a number of prior comments, neither RW1 nor you accept the fact that there has already been greater temperature change (and a greater rate of temperature change) than your so-called sensitivity predicts. So you do not have the full response in your model. Perhaps it's time for a new model. Let's boil it down to essentials: You show that instantaneous magnitudes of seasonal heating/cooling and other short-term variations far outweigh the GHE. Everyone else understands that those changes average to 0 over the course of the year (or cycle) and therefore contribute nothing to the long term warming trend. In fact, nothing you've presented contributes to any long term warming. And yet you insist that you have calculated a 'sensitivity', so you must accept that there is long term warming. Thus we arrive at a contradiction between your model and your stated position. I suggest the two of you do the homework (off line, as we do not need to see it played out here) to resolve this basic internal contradiction. -
archiesteel at 02:35 AM on 29 December 2010Stratospheric Cooling and Tropospheric Warming - Revised
@RSVP: "Whether an IR energy packet gets picked up by a GHG or reaches outer space is indifferent to the surface. It looses this energy the same." Sure, the surface does lose the energy, but the capture IR packet is eventually released, and may go back to the surface, warming it again (and thus making the system retain more energy than if it escaped into space). Stop running in circles, and try learning some actual science. -
Paul Barry at 02:21 AM on 29 December 2010The Scientific Guide to Global Warming Skepticism
I was going to print the guide out to give to a skeptical friend, but now I am hesitating because of several confusion black spots (rather than actual errors) which I see it containing. I know he will be alert to these because, although he is not fully abreast of climate change science (who is anyway?), he is clever and knows enough science to spot problems straight off. Sadly there are plenty. I’m going to point to just two now: (a) the figure showing an example of a positive feedback on page 3 and (b) the figure showing build-up of Earth's total heat content on page 4. They immediately raise questions. I wouldn't be concerned so much if it was easy to find answers to these questions by searching the site. Unfortunately that's not the case. (a) The example of positive feedback on page 3 has a caption saying “Warming causes oceans to give up more CO2”. Elsewhere we are told that the oceans are getting more acidic - i.e. more dissolved CO2. So which it? Is CO2 in the ocean going up or down or both? Is it different in different places? Is one from the deep sea and the other not? Why is it so paradoxical, if so? (b) The graph of Build-up in Earth’s total heat content. My problem here is a bit harder to explain. I’m fascinated by that graph of increasing ocean heat energy. I’m also confused by its seeming variability. Why is it going up in such a stagger? Where is the heat going when it seems to level off every decade or so? So I look at the reference at the back and I see it is from Murphy et al in 2009. Hmmm. 2009 that’s good - recent. But wait. Hang on. It says: “Figure redrawn on data from paper supplied by Murphy.” Hmmm. It would be better to get a graph taken from an actual paper. So I check around the site here doing searches for ocean heat content and I can’t find this graph or anything similar. I know it used to be here somewhere. Has it disappeared? All I can find are rebuttals of claims that the ocean cooled during the last decade. Not quite the same thing, though, is it? Why isn’t there more information on this graph? How reliable is it given that ocean temperature data are supposedly so vexatious and that reliable temperature measurements, we are told, are almost non-existent until recently? How is heat content calculated, roughly? Does it include the whole ocean or is it just a part? I really feel that this graph needs more explanation. It is probably the most interesting graph I’ve seen illustrating global warming. If it is reliable, why isn’t it shown more often? You can see how suspicions arise in the mind just following this line of thought. I would really appreciate it if someone could provide satisfactory answers to these questions for me - pointing elsewhere if necessary. I would be even more delighted if my queries give rise to improvements to the clarity of the site and the guide too. Please keep up the good work, it is greatly appreciated.Response: "Is CO2 in the ocean going up or down or both?"
CO2 in the ocean is going up. The ocean is building up CO2 because it's absorbing much of the CO2 we're emitting. But as the ocean warms, it's ability to absorb CO2 is lessening. So we are seeing more of our CO2 emissions remain in the atmosphere each year (the airborne fraction). The trend in the airborne fraction is slight, teetering on statistical significance.
"I’m fascinated by that graph of increasing ocean heat energy. I’m also confused by its seeming variability. Why is it going up in such a stagger?"
I haven't discussed this with Dan Murphy, author of the paper where that graph came from, but my speculation is the variability in the ocean heat graph is because he calculates total ocean heat from the upper ocean heat content. Upper ocean heat shows more variability compared to the total ocean heat calculated to greater depths because the upper ocean exchanges heat with the deeper layers. This is why when you see graphs of heat over 0 to 700 metres, the heat content jumps up and down while graphs of heat down to 2000 metres deep show a more monotonic increase in heat.
To calculate ocean heat back to 1950, Murphy had to use ocean data calculated from measurements of the upper ocean. To extrapolate this to deeper waters, he used studies that found the heat accumulating in the deep ocean was around 30% of the heat accumulating in the upper ocean. Thus if he'd have had access to direct ocean heat measurements down to the abyssal depths, I'm guessing the ocean heat graph would've shown less year to year variability. That's just speculation on my part. -
muoncounter at 02:17 AM on 29 December 2010Did Global Warming stop in
1998,1995,2002,2007, 2010?
#18, #20: See the 'Its freaking cold' thread, where our old friend BP has weighed in on this question. -
muoncounter at 02:12 AM on 29 December 2010Comparing all the temperature records
#49: "I was talking about a bias ... " Apparently a 'bias' that is in the eye of the beholder. I did not say anything questioning the value of your "longest cold spell"; I merely said that I was sure that you understood the importance of using significant measures as valid discussion points. If anything, the most common bias here is against making judgments on the basis of too few data points. We just don't like cherries and those who pick 'em are suspect. -
dhogaza at 01:48 AM on 29 December 2010Comparing all the temperature records
"Thank you for pointing out how insignificant my "longest cold spell" is! I had a hunch about that when I wrote it. But the long heat spell this year around Moscow, was very significant, as we all know." Significant, how? As "proof of global warming"? No, but it falls into a lengthening trend of extreme high temperature events being much more frequent as extreme low events. This is exactly the pattern of extreme events one would expect in a warming world. And, it was a much rarer event than your cold spell, as Russian meteorologists have described it as "unprecedented" - proxy reconstructions going back 1,000 years show nothing at all like the month long heat wave. Also, while Stockholm has been cold, it's been raining in the capital of Greenland, and ice in Hudson's Bay has been melting, resulting in exceptionally low sea ice extent in the Arctic at the moment: http://nsidc.org/data/seaice_index/images/daily_images/N_stddev_timeseries.png -
Stratospheric Cooling and Tropospheric Warming - Revised
RSVP - I will have to qualify my last post; this particular example hasn't been discussed much, and there may be some points I wasn't clear on. However: The greenhouse effect is all about rates, not fixed amounts, and your "double duty" fixed amount postings are a complete strawman - an incorrect distortion of the system under discussion. It's a deeply invalid analogy, and arguing from it is a logical fallacy. -
Stratospheric Cooling and Tropospheric Warming - Revised
RSVP - "it is not clear how the box can emit anything" Through the same clear window through which the 100W bulb light comes in. Energy (visible light) continuously comes in, warms the black plate, continuously radiates out (Stephen-Boltzmann equation) as IR - an ongoing flow. GHG's make the flow out less efficient, energy builds up, the plate temperature rises, until outgoing equals incoming again. Again, rates, not fixed amounts! Honestly, RSVP, if you cannot understand these very basic characteristics of the greenhouse effect, and of the analogy, after so many cycles of explaining it to you, there's really nothing more I can say - you either won't or can't listen. -
CBDunkerson at 01:01 AM on 29 December 2010Comparing all the temperature records
Argus, you claim that it is commonplace for a warming trend of just ten years to be considered completely acceptable as a valid indication of warming on this website. Please. Cite examples. I can't imagine that being true for anything except an extreme warming signal where the degree of change clearly overwhelms the noise signal even over such a short time frame... and I can't actually think of any examples of such. I have seen a few instances of short warming trends being cited... but they were always followed by caveats and notes about lack of significance. You claim otherwise... so please, prove your case. Post some links. -
dhogaza at 00:13 AM on 29 December 2010Did Global Warming stop in
1998,1995,2002,2007, 2010?
Actually, The Ville, the strawman's even more flimsy than you say ... "An all time record cold spell in Europe, however, is worth nothing." Argus ... this year's not been an all-time record cold spell in Europe ... and temps in London, for instance, are forecast to hit 50F tomorrow and will then drop into the low 40s later this week ... dead normal. Meanwhile, the capital of Greenland is forecast to be 24F above the historical average for January on Sunday ... -
RickG at 00:06 AM on 29 December 2010Did Global Warming stop in
1998,1995,2002,2007, 2010?
Re Argus @ 19 Rubbish! You are making accusations about articles where references to specific events are made while leaving out the surrounding context. You are "cherry picking" to make a claim of "cherry picking". -
Paul D at 23:28 PM on 28 December 2010Did Global Warming stop in
1998,1995,2002,2007, 2010?
Re mspelto@20 Thanks for pointing that out. -
Paul D at 23:26 PM on 28 December 2010Did Global Warming stop in
1998,1995,2002,2007, 2010?
Argus: "But don't forget that 'warmists' also frequently take selected areas of the world where heat records for the recent past are being set, while ignoring other areas where cold records are being set" That is complete junk. You have created a straw man. eg. you have fabricated an entity in order to knock it down. -
Argus at 23:14 PM on 28 December 2010Comparing all the temperature records
48: "Sorry, but you are incorrect." Yes, of course, I am incorrect if we are talking about real science. I was talking about a bias that I have noticed in the writings on this website, a bias that is more forgiving towards faulty statistics in showing evidence of warming, than the opposite. Thank you for pointing out how insignificant my "longest cold spell" is! I had a hunch about that when I wrote it. But the long heat spell this year around Moscow, was very significant, as we all know. -
mspelto at 23:09 PM on 28 December 2010Did Global Warming stop in
1998,1995,2002,2007, 2010?
The impact of Siberian snowcover on NH winter temperatures and weather patterns is not a new idea, that has been around in climate models since the early 1980's. Employing the snowcover data with forecast success in a long term forecast model is new. It is a follow up on the research published by Gong, Frei and Cohen beginning with Gong et al (2003)and a second aper by Gong et al (2003) -
Argus at 22:58 PM on 28 December 2010Did Global Warming stop in
1998,1995,2002,2007, 2010?
"'Skeptics' also take selected areas of the world where cold records for the recent past are being set while ignoring other areas where all time heat records are being set." Yes, that is true. But don't forget that 'warmists' also frequently take selected areas of the world where heat records for the recent past are being set, while ignoring other areas where cold records are being set. For example, I have seen many comments on this web site, where heat records from the current year, 2010, are taken as strong indications of climate change. That is a time period of less than one year! The key point here seems to be "all time". As soon as there is an all time heat record on Ascension Island or in some town in Finland, it qualifies as evidence of a change in climate. An all time record cold spell in Europe, however, is worth nothing. -
indulis at 21:37 PM on 28 December 2010The Scientific Guide to Global Warming Skepticism
John- great book! I've got one request, which is to have the next edition available as a single column instead of/as well as two columns. With a lot more people reading on the screen and on e-readers, two columns are a pain as you have to go to the bottom of a page, then scroll back up to the top, then back down again. A single column allows you to make the best use of the available screen space (i.e. half the page isn't taken up with stuff you shouldn't be reading yet).Response: That's an interesting question. I'll have to investigate the specs of ebooks and how one would put together an ebook version for readers like Kindle and iBooks, both of which I use on the iPad (so I welcome any technical tips from those wise in the ways of ebooks - please feel free to contact me). -
transjasmine at 21:13 PM on 28 December 2010Conspiracy theories
"There is a huge difference between the two. Corporations are designed to create 'fantasies' for humans, whether that is insurance, bank accounts, cars or light bulbs. Those fantasies can be anything (like Marmite flavoured chocolate I saw today!). Corporations are guided by how much they can manipulate the public and governments." Wrong corporations are designed to make a profit and if they can do that by selling you 'the right to pollute' then they will, as for how much they can control government's that just depends on how much money they are willing to offer presidential candidates, congressmen, members of parliment etc etc. of course the interests of science and business are different as its often hard for people to get funding, now if you had the idea to sell a prolific pollutant but you needed a 'scientific' opinion in order to better sell that idea to big business it wouldnt be naive to imagine SOME people might be willing to agree in exchange for research funding. none of the scientists who disagree or question anthropomorphic climate change have been granted UN funding -
BaerbelW at 21:05 PM on 28 December 2010Ocean acidification isn't serious
The link to the IAP-statement no longer works. It needs to be updated to http://www.interacademies.net/10878/13951.aspxModerator Response: Link has been updated. -
Paul D at 20:52 PM on 28 December 2010Did Global Warming stop in
1998,1995,2002,2007, 2010?
There is an interesting article in The New York Times by Judah Cohen about the current Northern Hemisphere winter: http://www.nytimes.com/2010/12/26/opinion/26cohen.html?_r=2&ref=opinion Cohen works for AER. I didn't know anything about this company until I read the article. Apparently AER have a new model that shows the Siberian snow having a big impact on the winter elsewhere. It successfully predicted last years winter and this years. News release in 2002: http://www.aer.com/news/pr/2002/2002-11-18-cold_winter.html The main point made is that it is most definitely a feature of global warming.
Prev 1991 1992 1993 1994 1995 1996 1997 1998 1999 2000 2001 2002 2003 2004 2005 2006 Next


