


 Arguments


Recent Comments
Prev 2011 2012 2013 2014 2015 2016 2017 2018 2019 2020 2021 2022 2023 2024 2025 2026 Next
Comments 100901 to 100950:
-
Joe Blog at 12:59 PM on 19 December 2010Stratospheric Cooling and Tropospheric Warming - Revised
But through O2/O3 UV absorption... -
Eric (skeptic) at 12:39 PM on 19 December 2010A detailed look at climate sensitivity
To RW1 on the Lindzen thread, muoncounter recommended that you visit this thread for evidence of high sensitivity. I second that, but IMO the arguments here come up short in several respects. One is that the average measurement of higher water vapor do not take into account the distribution of WV. If it is higher and evenly distributed then it is a positive feedback to CO2 warming. But if WV is unevenly distributed in a world warmed slightly by CO2, then an average increase in WV will result in less or no amplification. Second, the derivation of sensitivity from paleo studies routinely ignores unmeasured confounding factors. I gave one possibility here: cosmic-rays-and-global-warming.htm but there are others. Typically the response is to treat solar geomagnetic variations as a proxy for TSI and then dismiss it because of poor correlation and low amounts of TSI change. Also the last 30 years of detailed measurements don't show much in the way of GCR related climate effects. However the penultimate interglacial coincides with an abrupt decline in GCR so a relatively small TSI increase could be amplified without the need for CO2 feedback. -
Joe Blog at 12:39 PM on 19 December 2010Stratospheric Cooling and Tropospheric Warming - Revised
oamoe at 12:30 PM Because the stratosphere isnt really warmed by terrestrial LW absorption. But through UV O2/O3 absorption, terrestrial LW does off set loses somewhat, but CO2 is emitting just under twice what it absorbs in the stratosphere. Its a Q of path length, how opaque the atmosphere is to what wavelength. At the tropopause the path length in 15micron is already short enough that it basically just acts to transmit energy. This is a result of the reducing pressure, so for a given area(volume) there are less molecules than at a higher pressure. -
oamoe at 12:30 PM on 19 December 2010Stratospheric Cooling and Tropospheric Warming - Revised
Let me ask my previous question in a different way, why does the absorption of IR in the troposphere not dominate as the major cause of the cooling of the stratosphere. It seems odd that collisional activation of IR emission by CO2 would be so important. -
Riccardo at 12:04 PM on 19 December 2010Lindzen and Choi find low climate sensitivity
RW1 there are a few pieces that got to be fixed. "All I did was apply the same gain factor for solar power to additional power from CO2." You did it wrong as I explained in my previous post, you're confusing surface and TOA. "Ultimately, what matters is the total infrared power at the surface" The energy balance of the planet is governed by what happen at TOA, not at the surface. What we see (measure) at the surface is the effect of the change at TOA. "The point I was making about the perihelion power increase of about 14 W/m^2 was that a much larger increase in radiative forcing above the average doesn't have anywhere near the proportionally predicted effect as the AGW warming theory says will happen with just a 2 W/m^2 increase in radiative forcing from a doubling of CO2." (emph. mine) You should not expect any proportionality, indeed. When you have a cyclic forcing, the effect depends of the response time of the system. If the response is slow you won't get the full effect of the forcing; you are comparing a forcing with a one year period with a response time of the order of decades. An extreme example is the diurnal cycle, where you have the forcing going from about 240 W/m2 to zero but the temperature doesn't change proportionally. -
RW1 at 11:18 AM on 19 December 2010Lindzen and Choi find low climate sensitivity
I'm asking the question because I think it's a significant hole in the AGW theory that I've yet to see adequately explained. What I'm trying to show is that the CO2 AGW theory is saying that the climate system is all of the sudden going to treat an additional 2 W/m^2 of power at the surface radically different than it does the original existing 99+ percent, and while I suppose that is theoretically possible, there is no physical, empirical or logical reason why it would, especially in a system that is constantly changing everywhere, by relatively large magnitude. Ultimately, what matters is the total infrared power at the surface, independent of where all the power orginates from - the the Sun, GHGs and/or clouds. Both 2 W/m^2 of additional infrared power from the Sun "forcing" the surface and 2 W/m^2 of additional infrared power from CO2 "forcing" the surface are the same - all the surface 'knows' is what the total power is, and the total power is directly tied to temperature via Stefan-Boltzman (*if this was not true, then power from the Sun and additional power from CO2 cannot both be expressed in W/m^2 as they are). The point I was making about the perihelion power increase of about 14 W/m^2 was that a much larger increase in radiative forcing above the average doesn't have anywhere near the proportionally predicted effect as the AGW warming theory says will happen with just a 2 W/m^2 increase in radiative forcing from a doubling of CO2. Now of course one can always say that it will be the 2 W/m^2 increase above the total cumulative average that will cause a much larger amount of warming by suddenly triggering very large positive feedbacks (that don't happen to exist or act on the original 99+%), but there really isn't any physical, logical, or empirical basis for that, especially given the total amount of radiative forcing is constantly changing spatially and in time...all the time (warming, cooling, etc). If the climate as a whole was a steady state and static system, it might be more plausible, but the climate system is incredibly dynamic instead. That the global climate doesn't even appear to be phased by a 14 W/m^2 increase in radiative forcing, suggests the net feedback operating on the system as a whole is strongly negative - not positive, and the tiny increase of only about 2 W/m^2 from a doubling of CO2 will be - if not infinitesimal, benignly small. -
RW1 at 11:15 AM on 19 December 2010Lindzen and Choi find low climate sensitivity
Riccardo (RE: Post 12), All I did was apply the same gain factor for solar power to additional power from CO2. -
Riccardo at 11:05 AM on 19 December 2010Lindzen and Choi find low climate sensitivity
RW1 you first calculated a sort of energy balance at the earth surface to calculate the "amplification factor"; then you took the (net) energy imbalance at TOA, the 4 W/m2 for doubling CO2, and used the same "amplification factor" to calculate the extra energy received by the surface and the increase in temperature. -
muoncounter at 11:03 AM on 19 December 2010Should The Earth Be Cooling?
#67: Apparently not. Look here and use that thread for further discussion if warranted. -
Henry justice at 10:50 AM on 19 December 2010Should The Earth Be Cooling?
Whenever a solar cycle stretches beyond 13 years as did SC23, then doesn't a grand minimum soon follows with global cooling. The role of water vapor, our major GHG, will then take on a devilish role. The air becomes colder, dryer, and the warming effect of our greatest GHG diminishes. Shouldn't this greatly overshadow the miniscule effects of CO2? Also, isn't airborne soot implicated in the melting of the glaciers, even when the air above them has not risen above freezing? -
Tom Curtis at 10:42 AM on 19 December 2010Stratospheric Cooling and Tropospheric Warming - Revised
Humanity Rules @5, your comment shows a misunderstanding of how the greenhouse effect works. It does not work by absorbing a certain amount of energy which is then distributed between troposphere, earth's surface and ocean. Rather, it reduces the amount of outgoing energy from the Earth's atmosphere. The temperature of the ocean, surface, and troposphere than adjust until the outgoing energy is restored to its previous value, in which it balanced with incoming energy. -
oamoe at 10:40 AM on 19 December 2010Stratospheric Cooling and Tropospheric Warming - Revised
Is it true that the troposphere absorbs almost all of the IR coming from the Earth's surface, reducing the amount of surface-originated IR that stratospheric CO2 absorbs? Does this help explain the cooler stratosphere? -
muoncounter at 10:25 AM on 19 December 2010Lindzen and Choi find low climate sensitivity
#5: "from a doubling of CO2 ... an additional 3.2 W/m^2 will increase the surface temperature only about 0.6 degrees" We've already had more than 0.6C warming since ~1960, which only represents an increase of atmospheric CO2 from 317 to 388, nowhere near a doubling. So its clear your numbers are coming up short. But at least you agree that it's warming and that CO2 is part of the GHE, so that's a start.
The general climate sensitivity question was dealt with on prior threads, notably here. You should check there for additional information.
But at least you agree that it's warming and that CO2 is part of the GHE, so that's a start.
The general climate sensitivity question was dealt with on prior threads, notably here. You should check there for additional information.
-
RW1 at 10:16 AM on 19 December 2010Lindzen and Choi find low climate sensitivity
Riccardo (RE: Post 8), I'm not sure what you're trying to say either. Can you give me some specifics? -
AWoL at 10:11 AM on 19 December 2010The 2nd law of thermodynamics and the greenhouse effect
3 posts removed now , so obviously hit the spot. I would like to reply, scaddenp, but althought I feel free, I am not free.....if you see what I mean.Moderator Response: [muoncounter] No, no one sees what you mean. If you keep your posting to scientific questions and stop throwing around innuendo, suggestions of conspiracy, whining about moderation and such tripe, in keeping with the comment policy, you wouldn't have such problems. -
RW1 at 10:10 AM on 19 December 2010Lindzen and Choi find low climate sensitivity
Very Tall Guy (Post # 7), You need to be more specific - I'm not sure what you're trying to say. The halving of the CO2 absorption is because the re-radiated energy goes out in all directions - meaning half is radiated upward in the same general direction it was already headed; thus it cannot contribute to additional warming. -
Chemware at 09:45 AM on 19 December 2010Stratospheric Cooling and Tropospheric Warming - Revised
@ RSVP #5 "How does a packet of energy that raises the troposphere's temperature, also raise the temperature of the Earth's surface or ocean waters?" You're serious, aren't you ? Can't you see the connection between air getting hotter ergo surface (land or ocean) getting hotter ? -
Bob Guercio at 09:42 AM on 19 December 2010Stratospheric Cooling and Tropospheric Warming - Revised
VeryTallGuy Thanks for the complement and I will start thinking about more blogs related to this. Let's not forgot that I got a tremendous amount of help and input from you guys. It's really a credit to the Skeptical Science website and forum members. Thanks, Bob -
Bob Guercio at 09:35 AM on 19 December 2010Stratospheric Cooling and Tropospheric Warming - Revised
Jeff T - 6 Thanks for the comment about linearity. It's fixed. I reread the post and I think the verbiage pretty much agrees with what you said. Bob -
Riccardo at 09:31 AM on 19 December 2010Lindzen and Choi find low climate sensitivity
RW1 if you wish to (even roughly) calculate the result of an energy (im)balance you have to do it at the top of the atmosphere (TOA). You can not take two different pieces, at surface and at TOA, and mix them together. -
Phil at 09:28 AM on 19 December 2010The human fingerprint in the seasons
Argus @171 In addition to Daniel's comment, you might also google "Warm Arctic Cold Continent pattern" and look at some of the modeling. The high pressure over the arctic that we Europeans have had for the last 3 winter seems to be related to late freezing of the Arctic ice.Moderator Response: [Daniel Bailey] Article on that subject here. -
Daniel Bailey at 09:21 AM on 19 December 2010The human fingerprint in the seasons
Re: Argus (171) OK, I'll play. Let's take a look at the global temperature trend for the last 110 years or so:
Despite variability (noise in the dataset) overall temps are up. And up. And up. Despite predilections for cherry-picked short periods of declines, the overall trend is up.
OK, let's look at it a little differently. How about decadally? Here we go:
 Hmm, 80s warmer than the 70s, 90s warmer than the 80s, the "aughts" warmer than the 90s, check. Getting warmer. Got it.
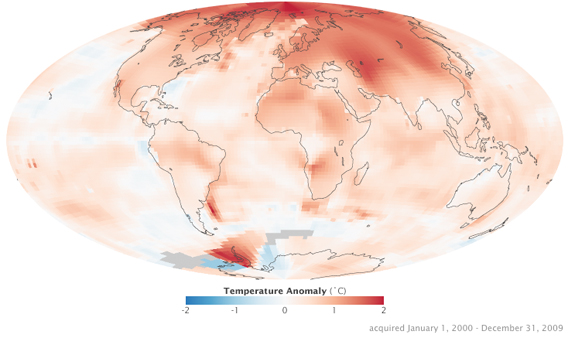
But when we speak about globally, surely it actually isn't warming everywhere? Aren't some places experiencing cold? Here's the 2000 - 2009 Temperature anomaly:
Hmm, 80s warmer than the 70s, 90s warmer than the 80s, the "aughts" warmer than the 90s, check. Getting warmer. Got it.
But when we speak about globally, surely it actually isn't warming everywhere? Aren't some places experiencing cold? Here's the 2000 - 2009 Temperature anomaly:
 What about some of the temperature datasets, some of them have to show it's cooling!
 Baseline-to-baseline, not really. Still up.
What about up north? Surely it's cold up there!
Baseline-to-baseline, not really. Still up.
What about up north? Surely it's cold up there!
 Sorry, Argus. Outside of recent, short-term weather events, looking at actual data says you're wrong. Well, maybe except where you live. But then that's not very global is it?
But do go ahead and watch that blue curve.
The Yooper
Sorry, Argus. Outside of recent, short-term weather events, looking at actual data says you're wrong. Well, maybe except where you live. But then that's not very global is it?
But do go ahead and watch that blue curve.
The Yooper
-
VeryTallGuy at 09:02 AM on 19 December 2010Lindzen and Choi find low climate sensitivity
RW1@3 "Then how do you explain the relatively large and fast seasonal temperature changes that occur in each hemisphere every year?" They are the ripples on the bathtub. Effects of external forcing are additive to them. @5 you are putting forward a logical fallacy. The greenhouse effect is made up of forcings (largely CO2) and feedback (largely H2O). The overall effect on the heat balance is the sum of both. Let's put a bizarre analogy together. Celebrities (CO2) are stalked by paparazzi photographers (H2O feedback). Each celebrity attracts 2 paparazzi. With one celeb, how many people are on the pavement - 3 Add one more celeb - by your calculation we only get 4 people, a 33% increase. In reality, of course, we get 6, a 100% increase. And your arbitrary halving of the CO2 effect from 4 to 2 W/m2 is also incorrect. -
Argus at 08:45 AM on 19 December 2010The human fingerprint in the seasons
"They found that winters have been warming faster than summers." Looking at the diagram in Figure 1 (top post), it certainly seems that way. At least as long as we limit ourselves to the period 1970-2000. But after 2000 the blue curve actually goes downwards! My prediction is that we will see a new trend with progressively colder winters, bringing the yearly average down. Watch that blue curve in the years to come! Just take a look at the winter 2010-2011 so far: record lows in the British Isles in November. The earliest winter for decades in many European countries. And it is not only western and northern Europe: in November, in Russia, Tver had -24 C, and all the way 6000 kilometers towards the east, Oymyakon had -50 C. I also read about severe problems with snow in Canada some of weeks ago. Right now British major airport are closed because of snow, and many motorists have to stay overnight in their cars on snowy roads. It is almost as bad in France. In Toscana traffic is severely hindered on the roads. Flights have been cancelled in France, Netherlands, Italy, and Germany because of snow. In Sweden the winter so far is the coldest for 100-150 years (depending on what city you are looking at). In Stockholm we have had snow cover for a month now (while the snow usually does not stay on the ground until after Christmas). -
RW1 at 07:57 AM on 19 December 2010Lindzen and Choi find low climate sensitivity
muoncounter (RE: 4) "Are you suggesting that seasonal temperature changes are solely due to the difference in sun-earth distance at peri vs. api?" No, not at all. -
RW1 at 07:56 AM on 19 December 2010Lindzen and Choi find low climate sensitivity
Here is a summary of where I'm getting my figures: The average incident solar energy is about 340 W/m^2. If you subtract the effect of the earth’s albedo (about 30% or 0.3 = 102 W/m^2), you get a net incident solar energy of about 238 W/m^2 (340 – 102 = 238). (*The albedo is the amount of incoming short wave radiation from the sun that gets reflected back out to space off of clouds, snow, ice, etc., and cannot be absorbed by GHGs or contribute to the greenhouse effect, which is why it’s subtracted out). From this you take the surface power at the current average global temperature of 288K, which is about 390 W/m^2 (from Stefan Boltzman), and with it you can calculate the gain or the amount of surface warming as a result of the greenhouse effect in the atmosphere. To get this you divide the current surface power by the net incident solar power, which comes to about 1.6 (390/238 = 1.6). What this means is that for each 1 W/m^2 of solar input, you get 1.6 W/m^2 of power at the surface due to the presence of GHGs and clouds in the atmosphere – a boost of about 60%. A doubling of CO2 alone absorbs only about 4 W/m^2 of additional power. About half this is directed upward out to space and the other half is directed downward toward the surface, resulting in a net of about 2 W/m^2. If you then multiply this additional 2 W/m^2 of power by the same gain calculated for solar power (as a result of the greenhouse effect), you get an increase in the surface power of about 3.2 W/m^2 from a doubling of CO2 (2 x 1.6 = 3.2). Using Stefan Boltzman, an additional 3.2 W/m^2 will increase the surface temperature only about 0.6 degrees C (390 + 3.2 = 393.2 W/m^2 = 288.6K). This is much less than the 3 degrees C predicted by the IPCC. Even if you assume all of the 4 W/m^2 from a doubling of CO2 goes to the surface, the temperature increase would still only be 1.2 degrees C – significantly less than the low end of the IPCC’s claimed range of 2 – 4.5 C. To get the 3 degrees C claimed by the IPCC, an additional 16 W/m^2 would be needed. This requires a gain of 8 rather than 1.6 (or at least a gain of 4 instead of 1.6 if we assume all of the absorbed power is directed back to the surface). The bottom line is the actual response of atmosphere (from GHGs and clouds) relative to net incident solar power, measured in W/m^2, is far less than the response claimed by the IPCC from a doubling of CO2, which is also measured in W/m^2. A watt/meter squared of heat and power is watt/meter squared of heat and power, independent of where it originates from – whether it’s the Sun, or redirected back to the surface as a result of more CO2 in the atmosphere (*If this was not true, then power from the Sun and additional power from CO2 cannot both be expressed in W/m^2 as they are). Ultimately, the total power flux at the surface is directly tied to temperature via Stefan-Boltzman - there is no escaping this. In short, the surface gain factor of about 1.6 supports an upper limit of only about 0.6 C from a doubling of CO2 because there is no physical or logical reason why a small increase of less than 2 W/m^2 will behave radically differently than the original 99+ percent - i.e. a gain of 8 or more needed for a 3 C rise is simply way outside the bounds of empirically derived observations of how the system responds to changes in radiative forcing. -
muoncounter at 07:41 AM on 19 December 2010Lindzen and Choi find low climate sensitivity
#3: "difference in solar radiance between perihelion and aphelion" Are you suggesting that seasonal temperature changes are solely due to the difference in sun-earth distance at peri vs. api? -
RW1 at 07:28 AM on 19 December 2010Lindzen and Choi find low climate sensitivity
Then how do you explain the relatively large and fast seasonal temperature changes that occur in each hemisphere every year? The seasonal hemispheric fluctuations in radiative forcing that occur are astronomically greater than the measly 1.85 W/m^2 that will come from a doubling of CO2. If what you’re saying is true, we wouldn’t see anywhere near the seasonal variability that occurs each year. (*The peak to peak difference in solar radiance between perihelion and aphelion is about 80 W/m^2. Divide by 4 to get the average of 20 W/m^2, then subtract out the albedo of about 0.3 and you get a net increase of about 14 W/m^2 at perihelion. -
VeryTallGuy at 07:28 AM on 19 December 2010Stratospheric Cooling and Tropospheric Warming - Revised
Bob, Great effort on a complex subject. I enjoyed the original thread, did a lot of thinking and learned a lot as a result. Putting the effects of UV heating of the stratosphere in a made it much easier for me to get my head around this - how about an intermediate version including temperature profiles & UV heating (greedy, I know). -
scaddenp at 07:11 AM on 19 December 2010The 2nd law of thermodynamics and the greenhouse effect
AwoL - before you think of new experiment, perhaps you might like to examine the many experiments already done. However, I am fully in agreement that nature is the arbiter. I have already suggested damorel provide an experiment which he/she thinks vindicates imaginary physics over textbook version. Certainly feel free to pose or demonstrate one also - though in this area I suspect the experiment is likely to have been already covered by painstakingly intricate work in the 1950s. -
Joe Blog at 07:00 AM on 19 December 2010Stratospheric Cooling and Tropospheric Warming - Revised
Good article Bob, as good as ive seen anywhere as far as this topic goes. -
VeryTallGuy at 06:57 AM on 19 December 2010Lindzen and Choi find low climate sensitivity
RW1 I've no idea if your figures are correct (reference please?). However the answer to your question is that CO2 adds the heat all the time, year after year (think of a bathtub filling), whereas changes during a year cancel out over longer timescales (think of waves in the bathtub). -
muoncounter at 06:19 AM on 19 December 2010The 2nd law of thermodynamics and the greenhouse effect
#271: "Backyard Science: " Maybe AwoL missed the infamous Dr. Spencer experiment and subsequent articles, which were mentioned back at comment #70 and probably don't need further rehash. An interesting thread, though, might be 'What goalpost moves are required when a denier has to argue with another denier's results?' -
RW1 at 05:46 AM on 19 December 2010Lindzen and Choi find low climate sensitivity
If the cloud feedbacks are indeed positive and inline with the IPCC model predictions of about a 3 C rise in temperature from a doubling of CO2 (a 3.7 W/m^2 gross increase in radiative forcing; 1.85 W/m^2 net), then why doesn’t the same proportional amount of positive feedback amplification lead to 16+ C rise in temperature when the net albedo adjusted incident solar power at perihelion is about 14 W/m^2 higher? Instead, average global temperatures are actually colder at perihelion in January then at aphelion in July. What is so special about 1 W/m^2 of additional power from CO2 that it’s at least 5 times more powerful than 1 W/m^2 of additional power from the Sun? -
DSL at 05:03 AM on 19 December 2010The 2nd law of thermodynamics and the greenhouse effect
Ok, AWoL. You come up with an initial design for a set of experiments, and then open up the design to the community and we'll adjust as necessary. Then we'll do them. So let's see some design statements. Might a pyrgeometer be involved? Maybe John should have a new thread on this: "Backyard Science: Providing Evidence for the Layman when Established Science Just Isn't Good Enough (or is thoroughly corrupt or too obtuse or whatever)" -
Phil at 04:30 AM on 19 December 2010Stratospheric Cooling and Tropospheric Warming - Revised
Jeff, @6 Yes CO2 is linear, although, thanks to zero-point energy, it will be vibrating in all 4 modes, including the bends, even when "unexcited"; so maybe Roberts picture isn't too bad... -
Daniel Bailey at 03:54 AM on 19 December 2010Stratospheric Cooling and Tropospheric Warming - Revised
Re: Jeff T (6) You can see 3D visualizations of the different modes of the CO2 molecule, including bending mode, in my comment here. The Yooper -
Philippe Chantreau at 03:37 AM on 19 December 2010The 2nd law of thermodynamics and the greenhouse effect
AWoL, you misinterpret what you read. As KR pointed above, Damorbel agreed to ALL the components of the GH effect. Yet he argues against what comes out of that effect. Fortunately, we don't need arguing about that (or much of anything else for that matter) since the result of that effect is well accounted for by both line by line radiative transfer models and observations. There is an abundant litterature treating of IR radiation at the surface, in the bands of GH gases. Ultimately, this is the real proof of the existence of the GH effect. If there was not a GH effect theory, we would have to come up with an explanation for that downwelling IR radiation and it would have to account for the fact that it is in the bands of the GH gases. Asd for your concept of how scientific results should be released, your own inability to sort out among what you read here indicates how bad an idea that would be. -
Alec Cowan at 03:36 AM on 19 December 2010Stratospheric Cooling and Tropospheric Warming - Revised
@ RSVP #5 "How does a packet of energy that raises the troposphere's temperature, also raise the temperature of the Earth's surface or ocean waters?" Are you trying quantum mechanics now? Is it the "same packet"? -
Alec Cowan at 03:28 AM on 19 December 2010Stratospheric Cooling and Tropospheric Warming - Revised
@ Karamanski #7 You may be mixing up radiative energy that is absorbed by an specific layer with all the radiative energy that crosses that layer. Similarly a sunbeam in the room warms the hand you interpose but not the air. -
Karamanski at 03:12 AM on 19 December 2010Stratospheric Cooling and Tropospheric Warming - Revised
If the second mechanism that causes stratospheric cooling results from the absorption of infrared in the troposphere, leaving less to warm the stratosphere. Would this only hold true if the planet was in energy imbalance? Because if less radiation reaches the stratosphere, that means the planet is absorbing more radiation than it absorbs; thus the planet would, in my mind, continue to accumulate heat unless the stratosphere warmed back to its previous temperature. If the planet is to maintain thermal equilibrium, how does stratospheric cooling allow the infrared radiation from the earth to match the incoming radiation from the sun when we experience global warming? -
Jeff T at 02:54 AM on 19 December 2010Stratospheric Cooling and Tropospheric Warming - Revised
Robert, Thank you for taking the time to write this description. It is useful, but there are some minor errors that should be corrected. I think CO2 is a linear molecule; Fig. 2 shows it bent like H2O. Temperature is a measure of random energy. To be more precise requires a discussion of entropy, which is too much depth for this post. The random energy can be translational, rotational, vibrational or radiative. In a polyatomic gas (like CO2, O2 or N2) at low temperature, most of the random energy is translational and rotational kinetic energy. At higher temperature, a larger fraction of the energy is vibrational. That fraction depends on the characteristic energies of vibrations of the molecules that the gas contains. As figure 2 shows, collisions change translational energy into vibrational and vice versa. A vibrating molecule is in an excited state. It can change to its unexcited state through a collision or by radiating the energy away as light. The characteristic vibrational energies of O2 and N2 are relatively high; they are not excited by collisions in earth's atmosphere. CO2's characteristic energy is lower. Its vibrations are excited by collisions in the atmosphere. -
michael sweet at 02:52 AM on 19 December 2010Renewable Baseload Energy
Actually thoughtful, I looked more at ground source heat pumps at your suggestion. I had thought that a buried heat exchanger was the most expensive part of the system. It turns out in my area people use wells for water supply. I already have two wells on my property! I will be costing out the system to see if I can afford to change before next summer. -
RSVP at 02:37 AM on 19 December 2010Stratospheric Cooling and Tropospheric Warming - Revised
How does a packet of energy that raises the troposphere's temperature, also raise the temperature of the Earth's surface or ocean waters? Afterall, hasnt it been said that all this extra energy is accumulating in the oceans and raising water temperature? If that little bit more of IR gets absorbed at a lower altitude due to the extra CO2, this should raise its kinetic energy or that of the gases around it,... in which case the work is done and accounted for... end of story. How can it then do "double-time", going off and warming other things? -
Daniel Bailey at 02:31 AM on 19 December 2010Greenland Ice Sheet outlet glaciers ice loss: an overview
Keep a weather eye on SST's around the Antarctic Peninsula and the Pine Island/Thwaites Glacier areas. The Climate Progress article I linked at the end of the post shows much warmer SST's have been present around the ice shelves in those areas. Some breakup could be expected as a result. The Yooper -
muoncounter at 02:28 AM on 19 December 2010It's CFCs
Lu 2009, full version in pdf, postulated that ozone loss is driven by that other catch-all of CO2 deniers, the much-maligned cosmic rays. Here's their prediction: The intensity of cosmic rays is still peaking in 2009, so we should expect to observe one of the deepest ozone holes over the spring Antarctica in 2009-2010. The data for the Antarctic ozone hole are available here. Sept 2009 had a max hole area of 24 million km^2, smaller than nearly every prior year back to 1992. Sept 2010 was 22.2 million km^2. The ozone hole is shrinking during peak cosmic ray intensity? Ooops. That their mechanism turned out to be incorrect makes further predictions suspect: The CRE-driven ozone depletion is expected to decrease after 2010 due to the CR cycles, but the EESC will keep decreasing ... . If the above observation is confirmed, then we expect to observe a continued decrease in global surface temperature - 'global cooling'. That is, global warming observed in the late 20th century may be reversed with the coming decades. Indeed, global cooling may have started since 2002 ... This is supposed to be credible? -
Daniel Bailey at 02:22 AM on 19 December 2010Greenland Ice Sheet outlet glaciers ice loss: an overview
Re; michael sweet (20) Not speaking for Dr. Pelto on this one, but consider the primary mechanism for ice-loss of an outlet glacier: The Jakobshavn Effect. Increased SST's will enhance loss at the calving front due to increased melt, thinning and calving. As the loss exceeds replacement by downslope transport of ice, the calving line then retreats upslope. Most Greenland outlet glaciers are still at or relatively near their grounding lines (think terminal moraine for a terrestrial glacier). What happens as the calving front retreats upslope is the ice tongue retreats into deeper water, ungrounding the ice front. Without the resistive stress of the grounding line, more of the glacier floats and then picks up speed in the downslope direction as the loss of resistive stress is propagated upglacier. If warmer SST's persist, expect greater calving (even in the absence of warmer air temps). Air temps above 0C will drive surface melt and percolation of water from the surface through moulins, driving heat downward into the heart of the ice mass. Hope this helps, The Yooper -
michael sweet at 02:02 AM on 19 December 2010Greenland Ice Sheet outlet glaciers ice loss: an overview
For the last month the temperatures over southern Greenland have been 10C above normal see this reanalysis by NOAA. The ocean temps appear to be about 5C above normal. Much of southern Greenland has been above 0C for weeks. Sea ice around southern Greenland is much reduced. How will that affect the glacier flow this year? Dr. Pelto: thank you for your very well informed comments. It is always interesting to see what professionals are thinking. -
muoncounter at 01:56 AM on 19 December 2010Water vapor is the most powerful greenhouse gas
#105: See comment re CFCs here. -
Riccardo at 01:53 AM on 19 December 2010The 2nd law of thermodynamics and the greenhouse effect
AWoL do you think that whoever comes with such a misunderstanding/misinterpretation of a century old science, scients should start from scratch to demonstrate something so well known? Are you asking scientists (or anyone else) to go back to the 18th century? The reference community of scientists is that of other scientists and none of them would make such weird claims.
Prev 2011 2012 2013 2014 2015 2016 2017 2018 2019 2020 2021 2022 2023 2024 2025 2026 Next


