


 Arguments


Recent Comments
Prev 2177 2178 2179 2180 2181 2182 2183 2184 2185 2186 2187 2188 2189 2190 2191 2192 Next
Comments 109201 to 109250:
-
archiesteel at 06:32 AM on 4 October 2010An underwater hockey stick
@TOP: which two graphs have you overlaid, and how is this a good argument against AGW? -
Doug Bostrom at 06:19 AM on 4 October 2010An underwater hockey stick
So sorry, johnd, I forgot: you've got more knowledge stuffed between your ears than entire faculties of multiple universities. In future I'll remember not to bother trying to offer you anything that might be of interest to us ordinary mortals. -
TOP at 06:11 AM on 4 October 2010An underwater hockey stick
I just overlayed the two graphs. Seems to be a good argument against AGW. I'll have to read the paper. -
scaddenp at 05:58 AM on 4 October 2010Climate Change: Past, Present, and Future
GC - I completely agree that we can find the energy for our civilization without fossil fuel. What I am amazed about is the apparent assumption, too political for you to post, that somehow climate scientists would disagree. -
johnd at 05:42 AM on 4 October 2010An underwater hockey stick
doug_bostrom at 00:08 AM, the UNSW video only reinforced my opinion about their climate expertise. Early last year they published an article "Indian Ocean causes Big Dry: drought mystery solved". Anyone reading the article would get the impression that "the surprising finding" had been done by the UNSW scientists alluding it was they who had discovered the Indian Ocean Dipole IOD and "detailed for the first time" the link to Australia's weather. I found it most disappointing that they created that impression as it had been discovered by Japanese researchers, but also it had been discovered a decade before which put them well behind everybody else, even private forecasters and researchers here in Australia. In the video one of the speakers mentioned how the negative dipole that is associated with increased rainfall had been absent for about 15 years and seemed to allude that this was due to a permanent change in circulation patterns. What he didn't say however was the the long absence was not something new, in fact in the late 1800's it was absent for at least 25 years (the chart I took that from only began in 1880), absent again from about 1917 - 1930 and absent again 1942 - 1958, apart from the smaller gaps, but overall it seemed to be present more frequently from the 1970's to 1990's than any other period since the 1800's. All in all I wasn't impressed by the video presentation. -
Albatross at 05:36 AM on 4 October 2010Climate Cherry Pickers: Falling sea levels in 2010
And note also please, it seems that Goddard used the SL data to which the inverse barometer correction has not been applied. If true, double fail for Goddard. -
CBDunkerson at 04:53 AM on 4 October 2010Climate Change: Past, Present, and Future
gallopingcamel #57, without getting into the political downfalls around taking 'free market' ideology to extremes... I always find the free market argument against controlling fossil fuels inherently illogical. The amount of money spent to subsidize fossil fuels is enormous. Even leaving out the cost of wars instigated, at least in part, over these resources we are talking about amounts far in excess of anything which has even been proposed in the way of subsidies for other energy sources. Ridiculous amounts of public funding are provided to oil companies for exploration and research. Entire aircraft carriers have been built and permanently assigned to the gulf region with the sole, officially stated, purpose of protecting oil shipments. Switch all public funds currently supporting fossil fuels to renewable energy (even ignoring the larger disparity which has accumulated over the past ~150 years) and it is the fossil fuels which are not economically viable. -
johnd at 04:52 AM on 4 October 2010An underwater hockey stick
Ken Lambert at 00:02 AM, this may not be the paper you were think of, but may be be of interest anyway CHANGES IN AUSTRALIAN PAN EVAPORATION FROM 1970 TO 2002 One of the earliest things I remember learning about the Darling River at school was how the river boats that used to go up the Darling in the 1800's to carry the wool out, would get stranded for years at a time if they missed getting out before the water levels fell. Even the Murray River stopped flowing during some of those early droughts. -
Albatross at 04:37 AM on 4 October 2010Climate Cherry Pickers: Falling sea levels in 2010
Goddard, FYI.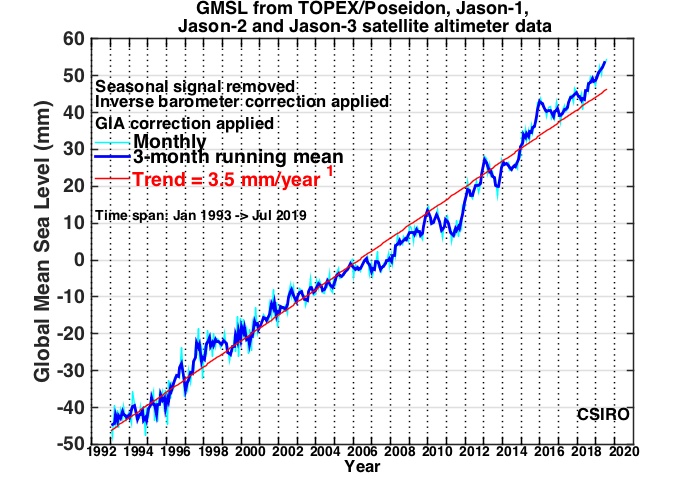
-
DSL at 04:37 AM on 4 October 2010Newcomers, Start Here
Or mountain pine beetles. The current destructive spread of this beetle is ten times worse than any previous infestation. I lost a tree yesterday, and the tree cutter said that "ten times" sounds about right, because he'd cut down about ten times the usual number of pines this year. The current spread is being blamed primarily on warmer winter temps preventing the usual die-off. Many tree species may be more flexible than insects in their ability to individually survive changing climate conditions, but they can't, as species, rapidly evolve to survive a changing insect, bacteria, and/or fungal context. -
CBDunkerson at 04:22 AM on 4 October 2010Newcomers, Start Here
Ken #34: "These fraught 'wildlife' impacts of AGW always follow the same theme - the impact will always trend between negative and disaster." I take it you haven't heard about global warming impacts on mosquitoes or marmots. -
johnd at 04:20 AM on 4 October 2010Uncertain Times at the Royal Society?
Daniel Bailey at 01:14 AM, whilst there may be higher levels of moisture in the atmosphere, your comments about evaporation are a distortion of reality. Evaporation data collected around the world show falling evaporation rates over the last 50 years as this study shows,CHANGES IN AUSTRALIAN PAN EVAPORATION FROM 1970 TO 2002 which notes that "the terrestrial surface in Australia has, on average, become less arid over the recent past, just like much of the Northern Hemisphere." -
Paul D at 04:10 AM on 4 October 2010Newcomers, Start Here
ClimateWatcher, you have completely ignored my comment which covered the issue you raised. Human with gun versus polar bear. The same situation has been seen in Afrika with Elephants and India with Tigers. Humans win the habitat war, so lets assume the bears migrate and adapt, they aren't going to compete with humans. -
PeteM at 03:39 AM on 4 October 2010Uncertain Times at the Royal Society?
An earlier post referred to how certain UK newapapers ( such as the Daily Mail) might report this . Just to point out that several commenters made a spirited defence of science of global climate change and of the Royal Society At one point there were 212 comments about their article on http://www.dailymail.co.uk/sciencetech/article-1316469/Royal-Society-issues-new-climate-change-guide-admits-uncertainties.html I'm not sure why, but these have all mysteriously disappeared . Perhaps we need a commission on this. -
tobyjoyce at 03:21 AM on 4 October 2010Irregular Climate podcast 11
chriscanaris #20 "three years in a row of unusual conditions." is a fairly bland and anaemic misrepresentation of the factual situation, given the actual figures on ice volume. What conditions are you talking about, exactly? I have no doubt the Arctic holds some surprises for us. They may not be the ones anyone expects. If you have been keeping a weather eye on political developments, you will find that all the Arctic nations (Russia, Canada, Norway and Denmark) are making medium term preparations for a growing regional population and a resource-rich ice-free ocean. The USA is also making preparations of sorts, but we have to wonder what a Tea Party Secretary of Defence will make of it all. Arctic ice is recovering, after all, so let's not waste the taxpayers' $dollars, right? Russia Claims Arctic Natural Resources "Russia has a "natural claim" to vast supplies of natural resources in the polar region a Kremlin aide told an international forum on the Arctic on Wednesday." -
HumanityRules at 02:19 AM on 4 October 2010An underwater hockey stick
I see your hockey stick and raise you a wavy line. The first reconstruction I found from a search I did on Web of Science. A NEW RECONSTRUCTION OF TEMPERATURE VARIABILITY IN THE EXTRA-TROPICAL NORTHERN HEMISPHERE DURING THE LAST TWO MILLENNIA Ljungqvist FC GEOGRAFISKA ANNALER SERIES A-PHYSICAL GEOGRAPHY Volume: 92A Issue: 3 Pages: 339-351 From the data and methods section "The new reconstruction presented in this paper consists of 30 temperature sensitive proxy records from the extra-tropical Northern Hemisphere (90–30°N), all of which reach back to at least AD 1000 and 16 all the way back to AD 1." From the abstract "The highest average temperatures in the reconstruction are encountered in the mid to late tenth century and the lowest in the late seventeenth century. Decadal mean temperatures seem to have reached or exceeded the 1961–1990 mean temperature level during substantial parts of the Roman Warm Period and the Medieval Warm Period. The temperature of the last two decades, however, is possibly higher than during any previous time in the past two millennia, although this is only seen in the instrumental temperature data and not in the multi-proxy reconstruction itself." The money shot. http://i54.tinypic.com/11wd2r5.png
John it worries me that lines such as "The growing body of evidence is strengthening the view that current warming is unprecedented over the past 1000 years" means that this has turned into a fight over a sound bite.
I'm more curious about what the various reconstructions tell us about natural variability. I know the conclusions drawn from a Mann hockey stick are very supportive of AGW. Would something like the Ljungqvist wavy line say this approach to diagnosing AGW is less conclusive?
http://i54.tinypic.com/11wd2r5.png
John it worries me that lines such as "The growing body of evidence is strengthening the view that current warming is unprecedented over the past 1000 years" means that this has turned into a fight over a sound bite.
I'm more curious about what the various reconstructions tell us about natural variability. I know the conclusions drawn from a Mann hockey stick are very supportive of AGW. Would something like the Ljungqvist wavy line say this approach to diagnosing AGW is less conclusive?
-
gallopingcamel at 02:17 AM on 4 October 2010Climate Change: Past, Present, and Future
That's better! (posts #54,55 & 56), Daniel Bailey doubts my motives so let's clear that up. I am not trying to bait a trap in the hope of shouting "Gotcha!". It is much simpler than that; I strongly support the idea of a sharp reduction in CO2 emissions (point A), one of the key notions on this thread. Many people seem to believe that points A and B are mutually exclusive so my task is to convince you otherwise. If you tell people that they have to give up heating/cooling their homes, motor transportation etc. etc. in the hope of limiting global temperature rise to <2 degrees Kelvin, nothing is going to change. doug_bostrom, it is clear that you are familiar with BNC (Brave New Climate). Marxists can be found there but also plenty of free market folks (like me). Persuasion works much better than coercion (IMHO). I want people to drive electric cars (as I do) because it makes sense rather than because they have no choice. scaddenp, John Cook will (rightly) censor me if I respond to your question about the motivations of "Climate Science". All I am suggesting is that there are ways to get the energy our civilization needs at an affordable price without burning fossil fuels. -
archiesteel at 02:01 AM on 4 October 2010Irregular Climate podcast 11
@chriscanaris: when posting images from wikipedia (or wikicommons, which in this case has an updated graph), you have to click on the file name again at the "File" page (the page you linked to) to get the actual file path. As you can see from this more recent graph, the September minima was actually lower this year. The earlier graph probably used the early September figures, which included a lull in the decrease that was mistakenly interpreted as the minima.
-
archiesteel at 01:38 AM on 4 October 2010New temperature reconstruction vindicates ...
@KL: I'm not particularly interested in your interpretation of the P&J paper. Unless I'm mistaken, they don't claim to have found all of the missing heat, but rather showed heat could be found in such places that are not adequately measured. #122: A "flattening?" You're grasping at straws, here. Even BP agrees that his graphs show a "linear increase." I'm sorry, but your repeated errors and mischaracterizations have pretty much destroyed your credibility on the matter. -
Daniel Bailey at 01:14 AM on 4 October 2010Uncertain Times at the Royal Society?
Re: adelady (87) You make a very cogent point about people not understanding the impacts. Perhaps the most useful way to frame a better understanding is in terms of capacity. In a warmer world, air has more capacity to store moisture (and thus more energy). As a result, soils on average dry out more between precipitation events. When those events do occur, they have a greater capacity to deliver precipitation (think: bigger fuel tanks) due to the extra moisture available. The perverse result? More droughts AND more floods. More floods, more erosion and landslides. All of which result in declines in crop productions. Equals less food... The Yooper -
adelady at 01:02 AM on 4 October 2010Uncertain Times at the Royal Society?
Mike I think you're right about people not understanding the impacts of warming climate. The global average temperature is literally a statistic. No-one anywhere lives in this "average" state. What people really need to understand that warming or heating is another way of saying 'a higher level of energy'. Then you marry that to higher water vapour because of higher evaporation. That higher level of energy and higher evaporation means more variations and more extremes in temperature, evaporation and precipitation extremes lead to more droughts, more floods, more snowstorms. What I see in many comments in various places is that many NH people really think that another couple of degrees would be mild, pleasant and therefore desirable. They overlook the horrible 2003 summer and the recent death toll in Russia's heatwave. And it's really hard to get across the message that "global warming" means more shovelling of snow in some places rather than less. Hence my preference for the "climate disruption" description. Warming is too likely to evoke images of holidays at an idyllic beach or a hot toddy by an open fire, rather than a scalding hot bath or a non-functioning air conditioner. Disruption has no immediately positive imagery to counteract,nor is it irretrievably catastrophic. Routine disruption is roadworks or power blackouts or storm damage or delays in deliveries. It's always annoying and in some circumstances it can wreck your plans. Serious disruption can wreck your life. -
chrisd3 at 00:57 AM on 4 October 2010Climate Cherry Pickers: Falling sea levels in 2010
muoncounter #14: And, of course, the 15,000-year period he uses includes almost all of the sea level rise resulting from the end of the last ice age. The vast majority of this rise was finished by about 7,000 years ago. This is like saying that the four pounds Harry has gained since last year is meaningless because it's less than his average annual weight gain since birth. Goddard has to compare the current rate to the rate over the entire post-glacial period rather than to the rate over the last ~5,000 years because then he'd have to change "much lower than" to "much higher than". That wouldn't be helpful to his position. -
Mythago at 00:57 AM on 4 October 2010Climate Cherry Pickers: Falling sea levels in 2010
Just two points that I know may have an effect (without denying climate change) is when glaciers melt the weight allows the continental land mass to rise in a reflex action. The other issue is when heat leaves one body and enters another the former body will naturally contract as the heat (energy) leaves and the structural atoms slow down their activity due to less energy to drive the activity and move closer together hence contraction. Sea level would therefore fall marginally. The only snags to these two ideas is that I have no idea what data points they use to measure the sea level from outer space and whether the expansion/contraction actually is that massive to give a observable change in sea levels. On the issue of graphs you can make them look even more impressive by simply changing the scales on the x or y axis to heighten the point you wish to make. Take a 1 degree temperature rise over 30 years. If you shorten the x axis and lengthen the y axis you will produce a graph that looks like the Himalayas. Do the opposite and it becomes a flat line which appears to show nothing. Depends on who you want to convince of the facts and how gullible the listeners are I suppose. -
barry1487 at 00:55 AM on 4 October 2010Climate Cherry Pickers: Falling sea levels in 2010
SSTs respond to ENSO cycles. The current la Nina is a very cold one. You can check out the drop here by selecting 'sea surface' (instead of near surface layer ch04). You can see the drop graphically here, and see the indices here. -
Doug Bostrom at 00:38 AM on 4 October 2010New temperature reconstruction vindicates ...
9x10^16 Watt-hours here, 9x10^16 Watt-hours there, pretty soon you're talking real SLR. -
Ken Lambert at 00:25 AM on 4 October 2010New temperature reconstruction vindicates ...
Archisteel #118 "As far as OHC goes, the Purkey and Johnson study gives a good hint as to where the "missing heat" is hiding (with troubling implications)." This is my take on P&J from the 'Billions of Blow-dryers thread which elaborates P & J paper: "Dr Trenberth's TOA imbalance is 0.9W/sq.m of which he can account for about 0.55W/sq.m with wide error bars. Of the 0.35W/sq.m 'missing' the above analysis (0.095) accounts for about 27% - again with wide error bars. A total contribution 0.146mm/yr of SLR is tiny compared with the current trend of 2.1 - 2.5mm/yr." Strangely I am not looking over my shoulder for the P&J missing heat to suddenly king hit the SLR. -
muoncounter at 00:13 AM on 4 October 2010Climate Cherry Pickers: Falling sea levels in 2010
#5" "His sample consists of only twelve data points (apparently not grasping that his data set only amounts to less than one third of calendar one year" Ah, but with such a sample, the graph above and a ruler, one can see the new trend: sea level is falling by 30 mm/yr! Clearly, Goddard must now be considered an alarmist! An yet, he goes on to throw a stone at our own John Cook, observing Current sea level rise rates are much lower than the average for the last 15,000 years. Current trends are more than an order of magnitude lower than Hansen’s forecast. In the-world-according-to-Goddard, trends can simultaneously be both smaller and larger. -
The Skeptical Chymist at 00:09 AM on 4 October 2010Uncertain Times at the Royal Society?
Doug, I thought your comment about the treatment of uncertainty in the report was very interesting. When I talk to people in my lab (other scientists, PhD students etc) I know they understand the difference between "uncertainties" and "uncertain", we inhabit a world of error bars and standard deviations so evaluating uncertainties is second nature. But I'm really not sure how this plays to the general public. Having just read the RS Guide, what is there is almost identical to the IPCC working group 1 (scientific basis). Which as Steven Schneider observed is packed so full of caveats and expression of uncertainties it doesn't make for very entertaining reading. As MarkR observed the RS Guide doesn't deal with paleoclimate and how this is used to constrain climate sensitivity against real world data. Paleoclimate also gives us a pretty good handle on how much sea level changes with global temperature. Omission of these important points, although with the fact that uncertainties in ice melt are all pretty much in the "how much faster" category was unfortunate IMHO. As to Joe Romm's critique I think I understand where he is coming from. The report doesn't explain what a warming climate will actually mean for people and as such is lacking in meaningful context. I would guess, for example, that lay readers would be more interested in how various amounts of warming will effect heat waves than the change in radiative forcing (in Wm-2) from a doubling of C02. -
Daniel Bailey at 00:09 AM on 4 October 2010Uncertain Times at the Royal Society?
Re: tobyjoyce (82)"Finally, I get to the point. The more I read your logic, the more I am convinced (and by other evidence also) that the climate science - denier debate is at its core political, and is really concerned with the political and economic impacts of global warming. Faux-scientific "debate" is just the first line of defence favoured by fairly powerful economic agents, as it was in the minor case of nicotine abuse. I believe we are now seeing a fallback to the second line (a grudging, fighting retreat) by denialism - that the problem is exaggerated, climate change may be beneficial etc. etc."
Well-spoken, sir. You unerringly strike at the crux of the science/"skeptic" debate @ expose its heart to the light of day. Deny, Delay, Mitigate, Adapt...or Die. The longer we take to reach the Adapt stage with our way of life, the more likely the option becomes closed to us & we then pass to the final stage. In the end, it may be that our descendants will have little say regarding us and these times as there may well be none left to judge us. The Yooper -
Doug Bostrom at 00:08 AM on 4 October 2010An underwater hockey stick
Ken and JohnD may find this of interest: Shifting Storms (UNSW faculty discuss relationship of latitude and climate change in Australia). -
kdkd at 00:06 AM on 4 October 2010New temperature reconstruction vindicates ...
KL #122 Presumably you mean one of the graphs presented in this post. Pray tell where you might see a statistically significant change in the rate of sea level change in any of those graphs? Given that I've explained to you how this can be acheived previously (see post #121 for links to the details) and the large effect sizes required to do so in any convincing way, then it should be fairly straightforward for you to determine this once you've located the raw data. However it's pretty easy to see by eyeball that any change in trend over different time periods is not statistically significant. Given this inconvenient truth, you could apologise for wasting our time with this pseudo-scientific subjective by-eyeball approach, and admit that you've been subject to confirmation bias that does not have empirical support. -
Ken Lambert at 00:02 AM on 4 October 2010An underwater hockey stick
johnd #19 My point precisely johnd. kdkd and I debated this about 12 months ago and I quoted a paper in Australasian Science by a leading expert in evaporation and rainfall (will look for it). The conclusion for the Australian continent under warmer conditions was - wetter in the north and 'don't know about the MDB - could be wetter or drier' I recently saw a photo of the wharves at Bourke on the Darling taken in 1902 after 8 years of drought. There was a couple of puddles in the dry bed of the mighty Darling. Sturt described it in 1845 as 'coffee coloured and about 100 yards wide'. When I saw it recently, it was coffee coloured and about 90 metres wide below the weir. -
Doug Bostrom at 23:59 PM on 3 October 2010Climate Cherry Pickers: Falling sea levels in 2010
Riccardo, I'm afraid Goddard is reduced to self-publishing his poetry these days, having fallen off the bottom of the food chain. -
Wibble at 23:51 PM on 3 October 2010Climate Cherry Pickers: Falling sea levels in 2010
@ Bob #9 Agreed; sadly this will not change, as the contrarians consider anything that waste the time of those working against them as a win. -
MarkR at 23:50 PM on 3 October 2010Climate Cherry Pickers: Falling sea levels in 2010
Isn't the heat spike in atmospheric temperatures caused by El Nino from heat being dumped from the ocean into the atmosphere? In which case, it makes sense that sea levels might fall, even whilst sea _surface_ temperatures rise, because the heat is being transferred from lower down. I have no idea if this is correct, I'll check it out... -
Riccardo at 23:48 PM on 3 October 2010Irregular Climate podcast 11
chriscanaris, you talked about recovery, not me. And, on this line of reasoning almost everything may have some surprise for us. It is not of any help, we won't anywhere in this way. -
Ken Lambert at 23:47 PM on 3 October 2010New temperature reconstruction vindicates ...
archiesteel #118 kdkd #121 Sea level is flattening with Jason (aro 2.1mm/year): see here for a good graph which agrees with recent data: http://www.skepticalscience.com/Sea-level-rise-the-broader-picture.html BP Post #19 The difference with 1985 is that CO2GHG forcing is reputedly running at 1.7W/sq.m and has been at an increasing level in proportion to the log of CO2 concentration. Is the forcing gap (imbalance) increasing or decreasing? Flattening of Temperature and SLR and OHC would indicate that cooling forcings (IR radiative cooling and Cloud & Direct Albedo) might be closing the gap. -
Riccardo at 23:38 PM on 3 October 2010Climate Cherry Pickers: Falling sea levels in 2010
I don't care that Goddard does not even remotely understand how our climate works. What's important is why Watt still publishes his posts after having stopped him on Arctic sea ice. By the way, even the x axis label is wrong. -
chris1204 at 23:35 PM on 3 October 2010Irregular Climate podcast 11
CBDunkerson @ 16, tobyjoyce @ 18, & Riccardo @19: I guess we've had three years in a row of unusual conditions. However, let's assume sea ice is not recovering but is fast disappearing. Let's also assume a Greenland ice cap melt. I came across a fascinating paper co-authored by Phil Jones (I gather it’s his first foray into publication after what has been an undoubtedly very tough time for him) entitled 'An abrupt drop in Northern Hemisphere sea surface temperature around 1970' in Nature Volume: 467, Pages: 444–447 (23 September 2010) (doi:10.1038/nature09394) states: 'The prevailing view of twentieth-century SST variability is that Northern Hemisphere SST decreased smoothly in the decades following the Second World War, and/or oscillated continuously on multidecadal timescales throughout the twentieth century... This view is derived from analyses based on either spectrally filtered...or low-pass filtered5... versions of the data, which are incapable of revealing sudden changes in SSTs owing to the method of their construction. The monthly-resolution residual time series... give a different picture of observed mid-century SST variability. Northern Hemisphere SSTs did not oscillate continuously on multi-decadal timescales, but rose steadily throughout the twentieth century apart from two discrete events: the drops in 1945 and around 1970. The suddenness of the drop around 1970 becomes apparent when we adjust the Northern Hemisphere data to suppress the effects of ENSO and volcanic eruptions without reducing the time resolution of the data... or when we subtract the monthly-resolution Northern Hemisphere SST and Southern Hemisphere SST from one another... The suddenness of the drop in Northern Hemisphere SSTs is reminiscent of ‘abrupt climate change’, such as has been inferred from the palaeoclimate record... but is inevitably obscured in analyses of twentieth century decadal variability based on low-pass filtered versions of the SST data. A similar drop is evident in the fourth empirical orthogonal function of the global SST field.... Unlike the discontinuity in global-mean SSTs at 1945... the drop in NH − SH SST around 1970 is not linked to any known biases in the SST data... the drop is evident in the uncorrected gridded summaries calculated from the International Comprehensive Ocean-Atmosphere Data Set version 2.4... It is present in all historical SST products derived primarily from ICOADS measurements, including the Met Office Hadley Centre's SST data set (HadSST2), the Extended Reconstruction SST (ERSSTv3b) product developed at the US National Oceanic and Atmospheric Administration’s National Climatic Data Center, the Kaplan Extended SST data set developed at the Lamont–Doherty Earth Observatory, and the Centennial in situ Observation-Based Estimates (COBE) SST product developed at the Japanese Meteorological Agency... The drop is not tied to any apparent changes in the volume of available observations... or any known changes in SST measurement techniques recorded in the metadata (Supplementary Information), and it is not unique to observations made by ships from a single country of origin ... A drop around the same time is also evident in measurements of night-time marine air temperature data, which are processed very differently from the SST data... And a concurrent drop is evident in the fully independent Northern Hemisphere land temperature data, particularly when those data have been adjusted to suppress the effects of variations in the high-latitude atmospheric circulation, ENSO, and volcanic eruptions... The rapid drop in NH − SH SSTs around 1970 seems to be a real and robust aspect of twentieth-century climate variability.... The timing of the drop corresponds closely to a rapid freshening of the northern North Atlantic in the late 1960s/early 1970s (the ‘great salinity anomaly’...). The spatial and temporal structures of the drop in NH − SH sea-surface temperatures suggest that the hemispheric differences in surface temperature trends during the mid-twentieth century derive not from hemispheric asymmetries in tropospheric aerosol loadings... or oscillatory decadal variability in the ocean... Rather, the hemispheric differences seem to derive in large part from a discrete cooling event in the Northern Hemisphere oceans that was not geographically localized, but had its largest amplitude over the northern North Atlantic.’ Significantly, just such a great salinity anomaly may have triggered the transition between the MWP and the LIA. Of course, there are other hypotheses relating to that particular switch which don't involve the thermohaline circulation. Even so, the possibility that such mechanisms might be operating even in a world with substantially higher CO2 levels is cause for some caution when prognosticating future trends. In short, the Arctic may have some surprises for us yet - the system may not be without feedbacks sometimes overlooked in the context of very understandable concerns about the future of Arctic ice. -
Bob Guercio at 23:12 PM on 3 October 2010Climate Cherry Pickers: Falling sea levels in 2010
It's criminal that the best minds we have are forced to spend their valuable time neutralizing the nonsense of the contrarians. Their valuable time would be much more productively utilized if they spent their time on the real challenge awaiting us in the future! -
chrisd3 at 23:08 PM on 3 October 2010Climate Cherry Pickers: Falling sea levels in 2010
Interestingly, in a comment, he attributes a "spike in late 2009" to El Nino--yet the subsequent decline must be due to Hansen's perfidy, not to the end of El Nino and the beginning of La Nina. He's not only cherrypicking data, he's cherrypicking explanations, too. -
Nick Palmer at 22:55 PM on 3 October 2010Climate Cherry Pickers: Falling sea levels in 2010
@MatJ #1 I have to object to you objecting to the description of cherry picking as a "rhetorical technique". Does Aristotle's "On Rhetoric" have a section on nitpicking? :-) -
Riccardo at 22:29 PM on 3 October 2010Irregular Climate podcast 11
chriscanaris, it's really easy to take the lowest year on record and predict a recovery. Strictly speaking it is undeniable that the last three years showed a larger minimum extent than 2007, but does this tell us somenthing? Not much. What is the meaning as far as the climate is concerned? That the three years are below the long term trend for four years in a row. Adding that it happend only at the begining of the satellite dataset and that for nine years in a row the data point in the middle of the range lie above the trend line, it indicates a parabolic trend, i.e. the downward trend is accelerating. But I can understand that people may find the recent "recovery" reassuring, bad news are never welcome afterall. As for multiyear ice, i find a bit trivial that ice which didn't melt again in 2008 after 2007 is now two years ice. I do not find it that much comforting, expecially when older ice keeps decreasing. -
Doug Bostrom at 22:19 PM on 3 October 2010Uncertain Times at the Royal Society?
Chris: We've no idea whether our descendants will judge the outcome of our musings on AGW as foolish denialism, proactive foresight, or a passing distraction impeding our understanding of our planet and its workings. I'm struck by how this remark captures and expresses what seems a vast gulf of disagreement between us, or frightfully different perspective in any case. Reading Chris' words, I find myself asking, "In 1880, did people debate whether James Clerk Maxwell would be thought of as a fool or a scientific giant in future years, because his understanding of the phenomena he described was imperfect?" Not really a perfect analogy; Maxwell modeled certain physical behaviors in ways that were usefully predictive against observations but did not address the agencies of what he described, whereas in this case we've got predictive models comporting with observations as well as causative explanations. All the same, by the time Maxwell died it was clear he'd established foundational scientific results unlikely to be suddenly discovered worthless in later years, even though everybody was quite clear there was a lot of work left to be done before the job he'd helped advance was truly finished.. My point is, we actually have a very good idea of how this will turn out; the level of uncertainty is quite low, the chances of a big surprise are slim, the probability of future generations thinking we were mad to be concerned over this is not something we've got much cause to worry over. If things go well, if we surmount the challenges presented by our understanding, this warming business will indeed turn out to be a "passing distraction" in the grand scheme of things, in perhaps the same relative sense that dealing with infectious diseases has been a "passing distraction." The alternative is that a lot of energy has to escape the planet in a way of which we're completely unaware, and the possibility of such a discovery at this late date is very poor. To use another analogy, details of the workings of the organisms causing infectious diseases are still emerging but we long ago captured enough of the gross features of their operation so as to reasonably deal with many of them, having not taken the perspective that perfect understanding must precede amelioration; we've not decided Pasteur was a fool because his familiarity with intricacies of the operation of bacteria was not as good as ours. Not to pick on Chris, it's just that the way he said what he did sort of struck a gong in my head. -
tobyjoyce at 22:14 PM on 3 October 2010Irregular Climate podcast 11
 This is surely relevant. The blue at the top represents the oldest ice, falling to the red (the youngest).
it was provided to Joe Romm by Julianne Strove of the NSIDC, from a forthcoming paper by Maslanik & Fowler.
Sharp drop in oldest, thickest Arctic Ice
This is surely relevant. The blue at the top represents the oldest ice, falling to the red (the youngest).
it was provided to Joe Romm by Julianne Strove of the NSIDC, from a forthcoming paper by Maslanik & Fowler.
Sharp drop in oldest, thickest Arctic Ice
-
chris1204 at 22:14 PM on 3 October 2010Irregular Climate podcast 11
 If this attempt fails, I give up for today - I'm not sure what I'm doing wrong. The graph is meant to show PIOMASS - the point is no change in the September minima for three years (though maxima are less encouraging).
-
CBDunkerson at 22:11 PM on 3 October 2010Irregular Climate podcast 11
Chris #14/15, ironically that graph shows exactly the same data as the one posted by Doug in comment #4 above. The Y-axis is given as area rather than percentage and it shows the full year rather than just the September results, but it's the same data... and thus every bit as 'dramatic', regardless of subjective impressions of how things 'look'. Statistically there is no evidence of a 'recovery' in sea ice extent. Rather the data is consistent with continuation of the ongoing trend and minor random variations. Further, the accelerating collapse of ice volume clearly makes it impossible for extent to recover. In 2007 an extent below 5 million km^2 was only possible with a rare combination of weather events. This year it happened starting from an abnormally high extent, late start to the melt season, and mixed weather. What once required a 'perfect storm' of complimentary factors is now merely ordinary... because the volume of ice has decreased dramatically since 2007. Unless volume somehow recovers, which is unlikely as ocean temperatures continue to climb, there cannot be a recovery of extent. -
tobyjoyce at 21:58 PM on 3 October 2010Uncertain Times at the Royal Society?
chriscanaris #80, I delved back into some of my Hegel references - I never tried to read the man himself as he is notoriously impenetrable. However, it is clear he distinguished between Dialectic reasoning, where he proposed his "Thesis - Antithesis - Synthesis" structure, and Analytic reasoning, which he declared was the domain of the natural sciences. Hence, you do not have Hegel on your side in this argument. Ironicially, it was Marx who converted Hegel's Dialectic Reasoning into Dialectic Materialism and Scientific Socialsm, but you probably don't want to go there. I am afraid telling an Irishman that the 17th century was not religion-obsessed is like telling a Jew that Anti-Semitism was not an issue in 1930s Germany, so let's not go there either! See also the Thirty Years War and the English Civil War. There is a case of Synthesis in science - present day Evolutionary theory is known as the Modern Synthesis. However, this is not Hegelian systhesis, because the two components (Darwinian Evolution and Genetics) are complementary, not Thesis and Antithesis. Finally, I get to the point. The more I read your logic, the more I am convinced (and by other evidence also) that the climate science - denier debate is at its core political, and is really concerned with the political and economic impacts of global warming. Faux-scientific "debate" is just the first line of defence favoured by fairly powerful economic agents, as it was in the minor case of nicotine abuse. I believe we are now seeing a fallback to the second line (a grudging, fighting retreat) by denialism - that the problem is exaggerated, climate change may be beneficial etc. etc. "Synthesis" may be possible at this line, at which the core science will be conceded by denialism, but not the impacts. At the end, the winners and losers will be clear. Talking about our descendants, the imperative is to make sure they can make decisions about us their ancestors in free, secure and flourishing surroundings -otherwise they will be right to judge us harshly. -
chris1204 at 21:53 PM on 3 October 2010Irregular Climate podcast 11
Oh well, the graphic didn't work but never mind - you can see it when you click on the link to the page. I was feeling chuffed for overcoming technophobia and managing to post a link successfully. I thought I'd try to do the same with an image but no luck this time. -
chris1204 at 21:48 PM on 3 October 2010Irregular Climate podcast 11
Well, Wikipedia for all its limitations does strive for balance: Yearly freeze and melt cycle 'Sea ice freezes and melts due to a combination of factors, including the age of the ice, air temperatures, and solar insolation. During the winter, the area of the Arctic ocean covered by sea ice increases, usually reaching a maximum extent during the month of March. As the seasons progress, the area covered in sea ice decreases, reaching its minimum extent in September most years. First-year ice melts more easily than older ice for two reasons: 1) First year ice is thinner than older ice, since the process of congelation growth has had less time to operate, and 2) first-year ice is less permeable than older ice, so summer meltwater tends to form deeper ponds on the first-year ice surface than on older ice, and deeper ponds mean lower albedo and thus greater solar energy capture.' From the same page, a less dramatic looking graphic:The issue is the stubborn refusal of new ice to melt into oblivion. Of course, this by no means guarantees a recovery and could be attributed to a range of causes. Even so, consistent increases in ice extent minima albeit over a short period raises the question of whether or when some of this ice might in fact turn into old ice. I note the most recent JAXA AMSR-E/ NSIDC/ NANSEN Arctic ROOS- Sea ice extent again suggest a jump in extent. Only time will tell whether any of this turns into a robust recovery whether partial or complete. It would be nice for the world if it did but of course my wishing it won't make it so.
Prev 2177 2178 2179 2180 2181 2182 2183 2184 2185 2186 2187 2188 2189 2190 2191 2192 Next


