


 Arguments


Recent Comments
Prev 2247 2248 2249 2250 2251 2252 2253 2254 2255 2256 2257 2258 2259 2260 2261 2262 Next
Comments 112701 to 112750:
-
Doug Bostrom at 09:18 AM on 14 August 2010More evidence than you can shake a hockey stick at
...the basis of the greenhouse theory is that the heat content of the atmosphere is absorbed and then carried by those gases that have been identified as greenhouse gases. Stopped me in my tracks, that did. The heat content of the atmosphere, primarily carried by the greenhouse gases, is measured as a temperature... And again. Bruising, really. Letting aside those problems and ignoring the flawed analogy between the taste of coffee versus phase changes in water and what causes and maintains them, the reason why the atmosphere is more humid is because the atmosphere is capable of carrying more water vapor before it condenses. In other words, atmospheric humidity is increasing because an increase in temperature allows it to do so. This is not even slightly complicated and it just boggles my mind to see the gymnastics some of us will go through to avoid looking at a graph and dealing with a conclusion. Or do we believe in an alternate explanation for why precipitation frequently happens as moist air is driven up and over mountains, experiencing adiabatic cooling and thus following the prediction that water will precipitate as the atmosphere approaches saturation? And of course, it's worth noting this increasing humidity is following the simple prediction that a given amount of C02 forcing will be followed by amplification by increased water vapor in the atmosphere. -
kdkd at 09:05 AM on 14 August 2010On Statistical Significance and Confidence
BP #50 "Yes, but you have to get rid of the assumption of normality. Temperature anomaly distribution does get more regular with increasing sample size, but it never converges to a Gaussian." From a theoretical perspective this is an important consideration, but from a practical perspective it often makes little difference. It is of course quite reasonable to use non-parametric methods whenever you think it's sensible, but NP methods will always have less power for a normal-enough dataset. So it's important to consider whether there's any practical benefit from eschewing the normal distribution. In the case of the two graphs you posted in this discussion, they're what we would consider close enough to normal as makes no odds. (I've spent some time working on this as part of my day job, to satisfy myself empirically of when NP and P approaches are best) -
Dikran Marsupial at 09:03 AM on 14 August 2010On Statistical Significance and Confidence
tobyjoyce@51 - maybe a student-t distribution and vary the degrees of freedom to match the kurtosis. IIRC the student-t distrubution can be represented as an infinite sum of Gaussians. -
Berényi Péter at 09:02 AM on 14 August 2010Of satellites and temperatures
#17 Ned at 04:52 AM on 14 August, 2010 Bandwidths for AMSU are here, along with a great deal of additional information that might be of interest. Bandwidths for MSU are here. Thanks. I see AMSU-A 5 is actually two closely packed channels at 53481 MHz and 53711 MHz, nominal relative bandwidth is 3.2×10⁻³ for both, pretty narrow. MSU 2 is 53740 MHz, relative bandwidth 4.1×10⁻³. As these frequencies are much (by more than two orders of magnitude) lower, than the typical νmax for thermal radiation of Earth, energy flux in this narrow frequency band should be proportional to absolute temperature [at low enough frequencies Planck's law can be approximated by I(ν,T)=2kTν2c-2]. However, it is true only for a black body, one for which absorptivity/emissivity is one. Temperature of a solid opaque surface can only be measured this way if its emissivity is known. With a semi-transparent medium (like the atmosphere) which has different temperatures at different depths and absorptivity can also vary, it gets much more tricky. With no additional information it is utterly impossible to recover anything remotely reminiscent to proper temperature from the signal measured. As at the TLT channel temperature is measured down to the surface, at this frequency the atmosphere should be pretty transparent (meaning it also have a low emissivity by Kirchhoff's law). So thermal radiation directly from the surface (e.g. rock warmed by the sun) also makes through and at he instrument it is indistinguishable from the portion of radiation originating from the atmosphere itself. Therefore not only a sophisticated model of atmosphere is needed to make sense of the dataset measured, but the radiative properties of the surface below have to be known as well. So this kind of temperature measurement is far more complicated than advertised and needs a lot of additional information that should be gathered (and validated) by other means. -
Esop at 08:54 AM on 14 August 2010NASA-GISS: July 2010-- What global warming looks like
batsvensson: The unusual cold in parts of Europe and the US last winter was caused by an extreme negative phase of the Arctic Oscillation, bringing cold Arctic air to lower latitudes, with warmer air flowing into the Arctic, causing the Arctic temps to rise to unusually high levels. Some info: http://nsidc.org/arcticmet/patterns/arctic_oscillation.html http://www.appinsys.com/GlobalWarming/AO_NAO.htm This has been linked to the extreme ice melt and rapid heating of the Arctic, and it is expected that we can see similar weather patterns during the coming winters: http://ipy-osc.no/article/2010/1276176306.8 http://ipsnorthamerica.net/news.php?idnews=3127 -
johnd at 08:51 AM on 14 August 2010More evidence than you can shake a hockey stick at
CoalGeologist at 03:34 AM, the basis of the greenhouse theory is that the heat content of the atmosphere is absorbed and then carried by those gases that have been identified as greenhouse gases. Water vapour is the primary and majority greenhouse gas and it only becomes a gas, and thus a greenhouse gas upon absorbing heat energy at the earths surface, which it then transports aloft where it is gradually dispersed, finally giving up all the heat where the highest clouds are formed. The heat content of the atmosphere, primarily carried by the greenhouse gases, is measured as a temperature, thus rather than considering rising humidity as confirmation of warming, they must be considered as one and the same, the temperature being merely a measure of the heat content residing primarily within the water vapour. How much water vapour is moves into the atmosphere at any time is dependent on what conditions prevail on the earths surface where the atmosphere and the surface waters interact and not the temperature of the atmosphere, because it is the water vapour itself that primarily determines the temperature of the atmosphere. Much like those who struggle with their coffee each morning. By whatever means they measure the sweetness of the coffee, there will be a correlation found between the measure of sweetness and the amount of sweetener being added to the coffee. For rising humidity to be used as proof of rising temperatures, so too could rising sweetener levels be used as proof of a rising measure of sweetness. That seems rather confused to me. It is not the rising measure of sweetness that causes the rising level of sweetener, but that is what has been suggested regarding the atmosphere. -
Doug Bostrom at 08:23 AM on 14 August 2010NASA-GISS: July 2010-- What global warming looks like
Bat the best way to answer your questions with the least ambiguity would be to travel to the NOAA-GISS and WMO links in the article. Or do a literature search and see what's been predicted and what's being observed. However-- boiling down this post to fewer words-- while attributing any single event to anthropogenic climate change is a very high bar to cross the trend of weather extremes we're seeing is in keeping w/predictions and could reasonably be considered a signature of a process dominated on the short term by natural variation but with an overwhelming trend. That's the point both NASA-GISS and WMO are making. Regarding last winter, I'm not an expert but I've read that it was down to natural variation, hardly unexpected as a glance at a host of data shows (see the NCDC data visualization tool linked near the beginning of the article). As both the WMO and NCDC say, as La Nina exerts itself (herself?) we can expect to see a drift back to what are considered more normal conditions but we should not expect trends to vanish. The real story is neatly encapsulated-- variation and all-- in that 12 month running average global mean temperature graph. A picture really does tell a thousand words. A lot of us are terribly dismayed with what such pictures tell us so our first instinct is to disbelieve them. Unfortunately disbelief is not an argument and can't stop the processes driving that graph upward. -
Doug Bostrom at 08:10 AM on 14 August 20101934 - hottest year on record
Broadlands, it's no wonder NCDC doesn't want to reply to letters containing questions they've taken pains to answer in bulk. Here's Peter Hogarth's comment conveniently supplying links to the information you claim you can't find. Go read, or choose to remain mystified. Your choice. -
batsvensson at 07:57 AM on 14 August 2010NASA-GISS: July 2010-- What global warming looks like
@michael sweet at 07:36 AM on 14 August, 2010 A lot of snow is not the same as record cold. This is strawman. The rest of your comment is as a red herring. -
David Horton at 07:52 AM on 14 August 2010NASA-GISS: July 2010-- What global warming looks like
Michael - yes indeed - "as soon as one argument is shown to be false they make up a new one". The obvious question to ask them would be - what would you expect to see happening if the CO2 levels in the atmosphere were rising rapidly in the last 30 years or so and with them global temperatures were increasing rapidly? Would you really expect to see nothing happening given that we know about the major climatic shifts the Earth has undergone n the past? And do you imagine that if you pretend that every single unprecedented (I use the word literally) event is somehow "normal" then you can also pretend that rising CO2 levels (with known physical consequences) and rising temperatures are not happening? The really depressing thing, as readers will be aware, is that the current Australian government's plan (the Opposition has no plan at all) to deal with global warming is to hold a conference of "ordinary" people (certainly not climate scientists) to decide what to do. It has been pointed out - http://davidhortonsblog.com/2010/08/11/deliver-da-letter/ - that such a conference would closely resemble the kind of discussion we see in this thread and many others. A denial, based on the most improbable propositions, that there is any problem at all. -
batsvensson at 07:46 AM on 14 August 2010NASA-GISS: July 2010-- What global warming looks like
@michael sweet at 07:36 AM on 14 August, 2010 So many hot records have been set this month that it may no longer be up to date. I don't know where you live, but I can hardly say any heat records been set this month where I live (western Europe) on the contrary this month may be just another "normal" or slightly cooler in the record - but we are not even half way so still far to early to tell what it will be. -
batsvensson at 07:37 AM on 14 August 2010NASA-GISS: July 2010-- What global warming looks like
@doug_bostrom at 04:16 AM on 14 August, 2010 Unfortunately I can not access the full article, I also noticed this article is published 2006 and obviously they can not have any opinion in that paper whether last winter was due to climate or weather or even if it was extreme – if you ask me I wouldn' t say it was extreme more like winters used to be 15-20 years ago about. Anywat, that does not matter. What I am asking for is statements from official institute about what have happen, that is I am not asking for predictions but explanations. Like the one that has been made about the current wild fires in Russia and flooding in Pakistan as contrary to explanation made before about extreme weather phenomena - these has been explained as variation in weather and nothing more, however variations that we can suspect to see much more often – the difference now is that this latest explanation seams to claim that climate change is a direct cause (and I think such strong claims never been made before, has it?) Secondly since this winter was a mess and is directly related to this summer it falls natural to ask the question – was this winter also due to a climate effect or was it just natural variations? -
michael sweet at 07:36 AM on 14 August 2010NASA-GISS: July 2010-- What global warming looks like
Batsvennson: Doug Bostrom posted these national records from this year on an earlier thread. So many hot records have been set this month that it may no longer be up to date. There are 17 national hot records so far this year and one (1) cold record. This winter was cold in Europe (and parts of the US), but not record cold. A lot of snow is not the same as record cold. Global warming models show more precipitation and in the winter that comes as snow. Maybe the snow plow crews were not ready for the snow because there has been so little snow in recent years. Perhaps they no longer can clear snow that they could clear 30 years ago when it was colder. The trends are for warmer winters, this was a cold dip. David, It seems as soon as one argument is shown to be false they make up a new one. The surface record drum no longer beats so loud but they find something new. I think this summer will start to tip more people. If I were the commander of Afganistan I would be worried to see all those people homeless in Pakistan-- some of them will go to Afganistan and fight. The military has to plan for the future. -
dhogaza at 07:29 AM on 14 August 2010NASA-GISS: July 2010-- What global warming looks like
Yep, and obviously it is because of this increased weight on earth, by all the fat people, that sea levels are rising.
No, no, the earth's crust is being compressed by all that extra weight, making the sea *appear* to rise! -
David Horton at 06:58 AM on 14 August 2010NASA-GISS: July 2010-- What global warming looks like
I woke up a bit depressed and this thread certainly tips me into very depressed. In Deniaworld it seems there is no measurement, no series of measurements; no extreme unprecedented weather event, no series of such events; no series of different extreme events in different regions; no record high temperatures, no series of record temperatures; no changes in species distributions or breeding patterns; no changes in ocean acidity: there is nothing, literally nothing that can't be arbitrarily dismissed, "explained" away by appeal to anecdote or bizarre physical mechanism or conspiracy or simultaneous unlikely technological failure or extremely improbably statistical anomaly. The result , if these people had their way, is that we on this little planet would sit idly by watching the climate change rapidly and soon irreversibly, all the while wondering what on Earth global warming would look like. -
batsvensson at 06:58 AM on 14 August 2010NASA-GISS: July 2010-- What global warming looks like
RSVP, at 04:52 AM on 14 August, 2010 There was some cold record broken this last winter. For instance I believed they registered a new lowest temperature in Scotland this winter (around -20C) and as well longest period of a cold snap (but that I will leave unsaid). What the mean temp for the period is I dont know, but think it was "normal". Nor do I know if the precipitation was any bigger than normal. However, when consider Europe, there was some pretty long persistent cold snaps last winter and there was more precipitation coming down as snow than "normal" causing complete chaos in the traffic situations all over Europe. Peopel was asked to stay at home or avoid public transport as public transport was canceled or stopped for several days due to cold and snow. I also think airports also was closed down when it was at worst but cant remember for sure. But I do know in the UK they did closed down all public education for a while when the snowing was at worst and they was not able to keep the roads clean of snow. Many countries had problem with salt stocks running low – salt to keep the roads free of ice. And when it was at coldest there was no use at all to salt but only plow and sand the roads - those road they had time to plow that is. There was real worries about salt stocks would deplete. Since snow plowing was not able to keep up a lot people got their cars trapped in the snow due to this - people was asked to stay home. As a result emergency service had more incidents calls and elder was not able to get public service due to sever traffic disruption etc, etc, you name it. In short last winter was a big mess and I just wonder if there is any finding that tells whether this mess last winter was due to climate or to weather? -
Broadlands at 06:21 AM on 14 August 20101934 - hottest year on record
"What your references have in common Broadlands is that they're all at least 34 years old." Doug... The fact that they are "at least 34 years old" should not change their values unidirectionally. Why should thermometers at least 34 years ago have measured higher temperatures most of which seem to have required lowering? Some specific examples. According to NCDC 1895-2009 in North Carolina it was 60°F in 1900 and 59°F in 2009... the two are essentially the same. No statistical difference, no warming or cooling. A level trend for 114 years. In 1921 it was 61°F in NC according to the NCDC and it was 61.0°F according to the US Weather Bureau's reports. Maybe a 0.1 degree difference... easily within expected variability.. No problem. No corrections? BUT... in other states? Official weighted Weather Bureau data list Arizona in 1921 at 61.6°F and Idaho at 46.5°F. The NCDC 1895-2009? Arizona in 1921: 59.4°F, 2.2°F lower. Idaho in 1921: 44.9°F, 1.6°F lower. Were the thermometers in 1921 that bad in AZ and ID? I will write again to NCDC. BTW, do you know what the temperature of the northern hemisphere was in 2009? -
Berényi Péter at 05:55 AM on 14 August 2010Three new studies illustrate significant risks and complications with geoengineering climate
#45 batsvensson at 04:20 AM on 14 August, 2010 Well Lewis, we will all look forward to see you and your familly be the first to move in to these spot where they plans to put these SO2 exhaust plants Don't worry. China takes care of the SO2 exhaust plant program just fine. Her altruism borders self-sacrifice.
-
actually thoughtful at 05:45 AM on 14 August 2010NASA-GISS: July 2010-- What global warming looks like
Pete Ridley, others who would claim there is no trend in the trend: Can you explain why NONE of the zigs or zags take us back to below an arbitrary zero line of 1960-1990 (or pick any other 30 year period that excludes the 2000s)? If this is all random, natural, modulating behavior, isn't it necessary to spend some time BELOW the zero line? -
Doug Bostrom at 05:23 AM on 14 August 2010NASA-GISS: July 2010-- What global warming looks like
fydijkstra if you read a little more carefully you'll see "This is what global warming looks like" are the words of NOAA-GISS, not John Cook. The 12 month running average was not invented for the purpose of presenting this year's weather; your eagerness to invent and then run with that notion is quite remarkable. And of course decades of running averages pointed in the same direction contain some thought-provoking information. -
tobyjoyce at 05:23 AM on 14 August 2010On Statistical Significance and Confidence
Berenyi Peter #54, I know at least one statistician who would love to get his hands around a problem like that and who would not walk away with "There's no unique solution, anyway"!!! :)) -
Pete Ridley at 05:15 AM on 14 August 2010NASA-GISS: July 2010-- What global warming looks like
Why all of the excitement about weather events? You may be interested in the comments a Russian scientist about the unusual (but not unheard of) weather presently being experienced in western Russia. “Russian Scientist: Extreme Central Russian Heat Wave Not An Indication Of A Future Climate Catastrophe By P Gosselin on 12. August 2010” (Note 1) QUOTE: Time to calm down everybody. .. Michail Kabanov, corresponding member of the Academy of Sciences and advisor of the Institute For Climate And Environmental Monitoring. .. Deviations in one direction or the other, in this region or the other, are explained completely by the instability of the climate system. It meanders constantly and reaches various anomalies as a result, and does include extremes. The weather conditions of this year are precisely a result of this. Scientists must still determine if this anomaly is part of a trend in one direction, i.e. global warming, or if it’s just another climate fluctuation says the scientist. According to Ria Novosti: The earth also experienced climate warming in the past, which was then followed by cooling. The question is: To what extent does the anthropogenic factor effect the fluctuations? Kabanow says the current drought is not the start of a future catastrophe. Rather it is simply one extreme event that rarely occurs. Michail Kabanow also says the thawing of the permafrost also poses no threat to man. The permafrost has been thawing since the last ice age 10,000 years ago. The rate of thawing is by no means catastrophic. The expert sees no approaching global catastrophe UNQUOTE.. Note 1) see http://notrickszone.com/2010/08/12/russian-scientist-extreme-central-russian-heat-wave-not-an-indication-of-a-future-climate-change/ Best regards, Pete Ridley -
Ned at 05:03 AM on 14 August 2010Of satellites and temperatures
Doug Bostrom, thanks for the reminder of that investigation into the annual cycle in UAH. I think the other problem with that discussion at Watts's site is the analysis of 5-year (!) trends in the difference between RSS and GISS. Those fluctuate around a lot -- over the past few decades, they've ranged from GISS warming faster by +0.03C/decade to RSS warming faster by +0.03C/decade. In other words, you can pick five-year intervals to show either one "diverging" from the other ... but they keep converging again. As noted above, over the entire 1979-present interval RSS and GISS both have a warming of +0.16C/decade -
fydijkstra at 04:56 AM on 14 August 2010NASA-GISS: July 2010-- What global warming looks like
The present situation with floods in Central Europe and Pakistan and wildfires in Portugal and Russia strongly reminds me of 2005, when many people thought that global warming was to blame for the extreme hurricane season. Even some IPCC members declared global warming to be the culprit. In later years this soon was shown to be wrong. At the moment we have already seen several years with extremely low hurricane activity. The IPCC has learnt its lesson from 2005. So far we have not yet heard any false attribution claims for the present disasters, but John Cook thinks, that this is what global warming looks like. I think, that we can wait for the next few years to come without fires and floods, so that global warming again will be exonerated. An interesting feature in this article is figure 2: the 12-month running average of the temperature. Maybe I have not read the right papers, but so far I have never seen this indicator before. Was it really necessary to invent this indicator, now that the 2010 El Niño is over, and the average of 2010 as a whole will probably not break the 1998 record? Please, remember, that 12 months is a completely irrelevant interval in climate science. The climate is the average of 30 years of weather. -
actually thoughtful at 04:52 AM on 14 August 2010NASA-GISS: July 2010-- What global warming looks like
Doug - great article, interesting perspective. I will use the 2:1 ratio in discussions with skeptics. Another twine in the massive AGW rope! -
RSVP at 04:52 AM on 14 August 2010NASA-GISS: July 2010-- What global warming looks like
batsvensson #29 Sorry. I overlooked you specifying winter, but was it actually a colder winter or just one with more precipitation? -
Ned at 04:52 AM on 14 August 2010Of satellites and temperatures
Sorry, Berényi Péter. Let's see: TLT uses AMSU-A channel 5, which as you can see is quite close to MSU channel 2. "Rotate with scan angle" refers to fact that the plane of polarization changes as the instrument scans back and forth perpendicular to the nadir line. Bandwidths for AMSU are here, along with a great deal of additional information that might be of interest. Bandwidths for MSU are here. -
Doug Bostrom at 04:50 AM on 14 August 2010Of satellites and temperatures
Doug Proctor, that situation has been superseded by events. There was no genuine physical basis for longitudinal drift between the various measurements, or that is to say the drift was down to an error in satellite data analysis. See this for a narrative of what happened. Some remarks by Dr. Spencer are here. Another "leaping to conclusions" moment, one of many. I'm surprised Watts has not amended that article so as not to continue propagating an incorrect impression. -
Berényi Péter at 04:41 AM on 14 August 2010Of satellites and temperatures
#10 Ned at 03:48 AM on 14 August, 2010 BP, this chart compares the bands on MSU and AMSU instruments. Thanks.
All of these rotate with scan angle, whatever that means. I still don't know the bandwidths and whether TLT uses AMSU-A or AMSU-B.MSU 2 53.74 GHz (5.58 mm) AMSU-A 5 53.60 GHz (5.59 mm) AMSU-B 5 176.3 GHz & 190.3 GHz (dual channel) (1.7 mm & 1.58 mm) -
Ned at 04:31 AM on 14 August 2010Of satellites and temperatures
Also, Doug Proctor, if you're interested in the accuracy of surface temperature records, you might want to check out another recent thread: Assessing global surface temperature reconstructions -
Ned at 04:27 AM on 14 August 2010Of satellites and temperatures
Doug Proctor, actually the RSS satellite temperature trend is rather similar to the various surface trends over the same time period: Trends 1979-present NASA GISS: +0.16 C/decade HADCRUT: +0.16 C/decade NOAA NCDC: +0.16 C/decade RSS TLT: +0.16 C/decade UAH LT: +0.14 C/decade The only outlier is UAH, which is slightly lower than the others. -
batsvensson at 04:20 AM on 14 August 2010Three new studies illustrate significant risks and complications with geoengineering climate
@LewisC at 22:39 PM on 8 August, 2010 Well Lewis, we will all look forward to see you and your familly be the first to move in to these spot where they plans to put these SO2 exhaust plants. Good luck with your new home. -
Doug Bostrom at 04:16 AM on 14 August 2010NASA-GISS: July 2010-- What global warming looks like
Bat, w/regard to cold air outbreaks see this article which interestingly enough refers to changes in "blocking," the same issue apparently contributing to extreme weather in Russia this summer: The behavior of extreme cold air outbreaks under greenhouse warming -
Alexandre at 04:11 AM on 14 August 2010Of satellites and temperatures
Thanks BP and Ned. So TLT is roughly equivalent to AMSU-A 5. Frequencies are similar. A chunk of air far wider than the surface standard measurment. -
Doug Proctor at 04:08 AM on 14 August 2010Of satellites and temperatures
http://wattsupwiththat.com/2009/01/18/giss-divergence-with-satellite-temperatures-since-the-start-of-2003/ For the satellite/Hansen data divergence, check this out. Both the UAH and the RSS data show divergence with the GISS/NOAA ground station ADJUSTED temperature stations. GISS/Hansen has serious warming going on. About 0.3C* of it, out of 0.7C*. This makes the global warming part of the 1850-1982 "normal" warming, not the pCO2 induced hyperbole. -
batsvensson at 04:03 AM on 14 August 2010On Statistical Significance and Confidence
@barry at 13:56 PM on 13 August, 2010 Why are all the lines crossing at the same(?) point at about 1935? -
batsvensson at 03:52 AM on 14 August 2010NASA-GISS: July 2010-- What global warming looks like
@RSVP, at 02:48 AM on 14 August, 2010 RSVP, I do not follow you, the volcano eruption came early this summer and can not possible have affected last winter. Therefore I do not understand the relevance of your comment to my question. -
Berényi Péter at 03:51 AM on 14 August 2010On Statistical Significance and Confidence
#53 tobyjoyce at 03:12 AM on 14 August, 2010 there is software that will fit as many as you like I happen to know the algorithm itself, which is pretty straightforward. But what's the point of this exercise? There is no unique solution to this problem anyway. And tails do matter. Those are the parts of weather that can get costly (both in terms of money and human lives). -
Ned at 03:48 AM on 14 August 2010Of satellites and temperatures
BP, this chart compares the bands on MSU and AMSU instruments. -
Berényi Péter at 03:41 AM on 14 August 2010Of satellites and temperatures
#7 Alexandre at 03:14 AM on 14 August, 2010 How high is this layer?
It is channel TLT (Temperature Lower Troposphere, MSU 2 and AMSU 5). It's up to about 5 km, but the intensity measured by the satellite in this band also depends on absorptivity of the layers above (e.g. clouds, humidity, aerosols, etc.) and vertical temperature distribution. I don't know the actual frequencies and bandwidths. Anyone? -
batsvensson at 03:40 AM on 14 August 2010NASA-GISS: July 2010-- What global warming looks like
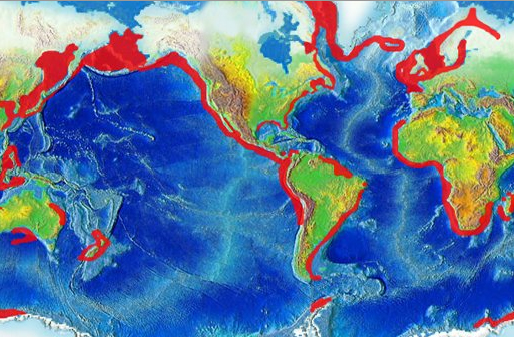
If one compare figure 1 with the areas of upwelling it seams like there is relation between heating and upwelling areas. Is this observation correct? -
Paul D at 03:36 AM on 14 August 2010NASA-GISS: July 2010-- What global warming looks like
re Thingadonta "You refer to a comment above-global warming makes more rain and worse droughts, but you cant have it both ways..." Then you fail to understand the nature of energy and the impacts it has on weather and climate. You get rain because of an energy input, that is how the water gets into the atmosphere to create rain. Increased energy indeed does result in worse rain, drought and more wind. The fact is mate, if you have more energy in a system and it is unevenly distributed, you can expect a lot strange stuff happening to the weather. -
CoalGeologist at 03:34 AM on 14 August 2010More evidence than you can shake a hockey stick at
The cyclicity of H2O evaporating or sublimating into the atmosphere, then recondensing as liquid or solid is why water is not regarded as a forcing in climate warming. The time period for this cycle is measured in terms of days and the net energy balance is zero. To my understanding enhanced greenhouse warming is driven primarily by the enhanced absorption of IR radiation by the increasing quantities of GHGs in the atmosphere, especially CO2 & CH4, plus the additional water vapor content due to warming (i.e. the notorious, and still disputed, water vapor "feedback"). Water vapor feedback is complicated by the fact that water vapor can condense to solid or liquid to form clouds, which have their own characteristics in terms of absorption or reflection of incident radiation. It was my impression that the water vapor you were discussing is the incremental quantity that has been added to the atmosphere (on average) due to net warming of the atmosphere due to higher concentration of GHGs, which I still believe is negligible. Perhaps you could offer some quantitative support for whatever is your position on this. Better yet would be to cite a source in the peer-reviewed literature. -
Doug Bostrom at 03:19 AM on 14 August 2010Of satellites and temperatures
Thank you, Ned! For folks interested in learning more about the NOAA constellation: The National Environmental Satellite, Data, and Information Service (NESDIS) (complete information on orbiters including systems and subsystem status) NOAA Satellite Services Division (quick data product access) NOAA's "Satellites" page (a potpourri of links to satellite-related NOAA pages) NOAA "Image of the Day" (just for fun) Or, depend for information on websites making such broad and surprising remarks as "Official weather forecasting hasn’t improved since it began and is of insufficient accuracy to be useful." -
Alexandre at 03:14 AM on 14 August 2010Of satellites and temperatures
I assume those sattellite data we see around are usually the channel 04 - near surface layer. How high is this layer? How does it compare to the standard surface measurements like NCDC´s? -
tobyjoyce at 03:12 AM on 14 August 2010On Statistical Significance and Confidence
BP #52, I said "approximated", and there is software that will fit as many as you like (a finite number, obviously). There may even be an R package that does it. In many cases, tails (which contain the low probabilities) may not be important. -
dhogaza at 03:05 AM on 14 August 2010Of satellites and temperatures
Anybody remember the boy who cried wolf?
Well, science denialism is more like crying "sheep" when there's a wolf at the door ... -
RSVP at 02:48 AM on 14 August 2010NASA-GISS: July 2010-- What global warming looks like
batvensson 22 We did have volcano erupting Iceland. Now was the volcano, or the fact that there were all those canceled flights spewing less CO2. -
JMurphy at 02:48 AM on 14 August 2010NASA-GISS: July 2010-- What global warming looks like
Rick1521 wrote : "The UHI effect can easily explain the change in record highs and lows." Easily ? I don't think so, unless you can provide evidence that goes against these studies : On the reliability of the U.S. surface temperature record 3.2.2.2 Urban Heat Islands and Land Use Effects Urban Heat Island Assessment: Metadata Are Important Perhaps Watts has finally brought that paper of his out ? -
RSVP at 02:46 AM on 14 August 2010NASA-GISS: July 2010-- What global warming looks like
And global warming afterall is quite subjective. Note the article... "we're looking at a system with enormous inertia" enormous interia? or simple ultra-stable and slow in changing giving the impression of enormous inertia. Does this mean a supernova has no inertia, since it disintegrates in three days?
Prev 2247 2248 2249 2250 2251 2252 2253 2254 2255 2256 2257 2258 2259 2260 2261 2262 Next


