


 Arguments


Recent Comments
Prev 2250 2251 2252 2253 2254 2255 2256 2257 2258 2259 2260 2261 2262 2263 2264 2265 Next
Comments 112851 to 112900:
-
Chemware at 11:05 AM on 31 August 2010The empirical evidence that humans are causing global warming
Suggested correction to point (3): (We know this because the two types of carbon have different chemical properties.) Err, no. They have the same chemical properties. They have different physical properties, specifically different 13C : 12C ratios. -
Berényi Péter at 11:03 AM on 31 August 2010Sea level rise: the broader picture
Posted by doug_bostrom at 10:26 AM, Monday, 30 August, 2010 observed sea level rise is already above IPCC projections and strongly hints at acceleration No, there is no acceleration. Sea level rise is fairly linear. Let's have a look at the New York tide gauge, for example: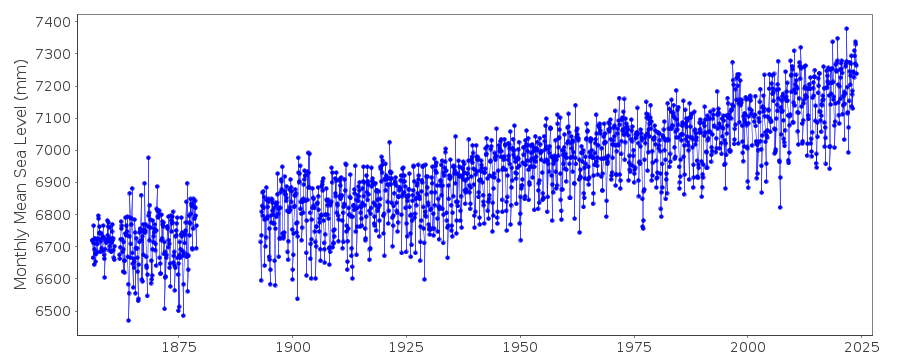 Acceleration can be computed by fitting a least square quadratic form to data. Acceleration is twice the coefficient of the quadratic term.
For New York it is 0.001 mm/year2 since 1900. That is, sea level rise got faster by 0.1 mm/year in a century, which is equal to zero for all practical purposes.
Of course it is possible the southern tip of Manhattan is accelerating upward at the same rate sea level rise is supposed to accelerate. However, it is extremely unlikely.
There is no substantial tectonic activity in the region, the island is a huge granite rock stable enough to carry the weight of the city and vertical movement due to post-glacial rebound, if anything, is decelerating as time goes by (New York is close to the neutral line where no vertical movement occurred after the Laurentide ice sheet melted away).
Acceleration can be computed by fitting a least square quadratic form to data. Acceleration is twice the coefficient of the quadratic term.
For New York it is 0.001 mm/year2 since 1900. That is, sea level rise got faster by 0.1 mm/year in a century, which is equal to zero for all practical purposes.
Of course it is possible the southern tip of Manhattan is accelerating upward at the same rate sea level rise is supposed to accelerate. However, it is extremely unlikely.
There is no substantial tectonic activity in the region, the island is a huge granite rock stable enough to carry the weight of the city and vertical movement due to post-glacial rebound, if anything, is decelerating as time goes by (New York is close to the neutral line where no vertical movement occurred after the Laurentide ice sheet melted away).
 As for more recent times, global sea level is measured by satellites.
 The trend line looks impressive, but if we draw a separate trend line for the TOPEX and Jason eras, a considerable deceleration is seen. On top of that, there is a hint of a 4 mm offset error between data from the two satellites (at the beginning of 2002). If it is taken into account, the trend is decreased for the full period.
 BTW, I can believe acceleration values derived from satellite measurements, but absolute rate of sea level change also depends on the selection of the reference point set. As acceleration of vertical land movement is much smaller on these timescales than linear rates, it is easier to have a reference set with zero average acceleration than one with zero rate of change.
-
johnd at 10:59 AM on 31 August 2010The surprising result when you compare bad weather stations to good stations
That raises the question as to why adjustments are necessary to individual records. By rights a random selection of sufficient stations that represents consistent global coverage, that is constantly changed should provide a consistent global record of temperatures over time irrespective of which individual stations are in each selected mix. -
HumanityRules at 10:33 AM on 31 August 2010Sea level rise: the broader picture
15.Peter Hogarth Thanks for those papers. I'm glad you point out the caveats in the Wenzel paper. Personally I have no problem with scientists describing the limitations of their work. In fact it's sound scientific practise. The opposite leads to wild exaggerated claims. I guess the caveat surrounding the uncertainty in early data is true for all SLR reconstructions, even those that use a larger number of gauges. With regard to the two papers. Both show SLR records from 1992-2010(ish). Both records look linear, ignoring the inter-annual variability. I'm just trying to imagine how this acceleration is working and how it fits into the real world. We have a 100 year record which shows a 1.6mm/yr rise and an 18 year record which shows a rate ~double (3.4) that suggesting something extraordinary is happening but at the same time that acceleration doesn't show up in the past 18 years. This would have to suggest that the acceleration occured prior to 1992 and for the last 18 years things have returned to a steady increase (albeit at a higher rate). This fits with neither the supposed acceleration in OHC and land ice melt over that time period. Can you just describe the nature of the acceleration? -
Doug Bostrom at 10:30 AM on 31 August 2010Can humans affect global climate?
Uh-oh. Dr. S. Fred Singer in his own words, in the PBS interview that is the source of Smitty's quotation. I'd heard of this guy but now I understand why he's notorious. The interview is worth an entire article in its own right. A sample of internal consistency and accuracy: "But since 1979, our best measurements show that the climate has been cooling just slightly. Certainly, it has not been warming." Followed later by: "Since aerosols are mostly emitted in the northern hemisphere, where industrial activities are rampant, we would expect the northern hemisphere to be warming less quickly than the southern hemisphere. In fact, we would expect the northern hemisphere to be cooling. But the data show the opposite. Both the surface data and the satellite data agree that, in the last 20 years, the northern hemisphere has warmed more quickly than the southern hemisphere." Completely incoherent but Singer ironically goes on to say this is very embarrassing to the "modelists." -
Riduna at 10:25 AM on 31 August 2010Ocean acidification threatens entire marine food chains
actually thoughtful @ 13 So only 5% of the global population depend on fish as their only or primary source of protein. This is at odds with views expressed by James et al (2010) and the FAO which claim that over16% are dependent seafood. Peter Hogarth @ 36 Thank you (I think) for a comment which alas reinforces my view that the future is indeed bleak and unlikely to improve given our voracious fishing industry driven by the need for profitability rather than sustainability. -
Unrecovered at 10:10 AM on 31 August 2010The empirical evidence that humans are causing global warming
KR. Yes certainly, when you referring to the transient state. I guess my point is that, I don't think we have direct measured evidence of this imbalance. The current estimated imbalance (models) of 0.9 Wm-2 at the TOA is beyond our current capabilities to measure from satellite. What we have, and I think what you are referring to, is evidence is that the emission spectrum at the TOA has changed in the way we would expect it to from increases in various green house gases. That's useful information but doesn't quite amount to evidence that: "less heat escapes to space". Of course I haven't made a better suggestion yet. -
johnd at 09:46 AM on 31 August 2010The empirical evidence that humans are causing global warming
KR at 05:16 AM, there is no philosophizing necessary, the H2O spectra moves from high absorption to high emissivity then to high absorption within a range that provides a window of opportunity for conditions conducive to the existence of life, that range being due to the unique properties of H2O. CO2 might be able to alter to some degree the factors that drive the closing of the emission window on one side, but that doesn't change the fact the properties of H2O alone would have closed that same window, all be it after a greater loss of heat from the system than what CO2 would close that same window of emissivity. -
Doug Bostrom at 09:40 AM on 31 August 2010Can humans affect global climate?
Which board, Smitty? The answer helps determine whether it's worth devoting any effort to an attempt. Meanwhile, it might help to put Singer's quote into context. -
johnd at 09:28 AM on 31 August 2010The empirical evidence that humans are causing global warming
KR at 05:06 AM, the change of state that allows water vapour to enter the atmosphere is due entirely to conditions that occur at the immediate surface of the earth where the reservoir of H2O resides in either it's liquid or solid state. The process extracts heat from the surface which is then carried into the atmosphere being liberated through various levels until finally all is exhausted at the highest levels at which clouds form. The rate at which water vapour enters the atmosphere is therefore dependent primarily on the amount of solar radiation and water that is available at the immediate earths surface, and the rate at which the change of state takes place to enable the hydrological cycle to complete is dependent on being able to liberate heat into an environment where there is a ongoing process of nett heat loss out of the system. -
Smitty at 08:56 AM on 31 August 2010Can humans affect global climate?
I should have prefaced the previous comment. I am currently debating a number of people (who are probably smarter than I am) on a message board and I was asked to respond to Dr. Singer's claim. I have searched for an answer and have come up empty. I truly don't know the answer and any help would be appreciated. Thanks, Smitty -
johnd at 08:48 AM on 31 August 2010Human CO2: Peddling Myths About The Carbon Cycle
muoncounter at 13:33 PM, the peak to trough variation in the annual cycle is far greater in some places, as high as 50ppm as shown in Mechanisms for synoptic variations of atmospheric CO2 in North America, South America and Europe so there is far greater capacity to sequester CO2 than is fully realised. If the growing seasons extend then perhaps more of that capacity will be utilised. As virtually all enrichment trials indicate, plant growth under present conditions is far from optimum, low CO2 levels being the factor being focused on, with CO2 enrichment being a long established practice in many commercial intensive plant production systems. -
The empirical evidence that humans are causing global warming
Unrecovered - Actually, it's not the same amount of energy escaping. Reducing the emission spectra at a particular temperature directly reduces the amount of energy radiated at that temperature. The difference is the radiative forcing induced by changing amounts of greenhouse gases, accumulating energy here on Earth until the temperature rises, the emission spectra scales up accordingly, and the summed energy escaping matches the energy coming in - equilibrium. The various feedbacks and energy accumulation take a bit of time - even if we were to stop changing CO2 levels right now warming would still continue for decades, until that sum energy emitted matches the amount coming in. -
Unrecovered at 07:46 AM on 31 August 2010The empirical evidence that humans are causing global warming
The amount of energy escaping is the same. Not sure if emissivity helps much here. -
dsleaton at 07:39 AM on 31 August 2010Climate Models: Learning From History Rather Than Repeating It
Fortunately, Pete, I saw your post of Droz (or druz, as Le Guin might call him) before it disappeared. Droz had the amazing logical faculty to promote the idea that unless a model perfectly predicts what it sets out to predict, it should be tossed out. Pete, look yourself in the mirror and ask yourself if you truly believe that. Every day you bet your life on imperfect modeling that you yourself perform. When you ride your bike to work, you know that the possibility exists that a car could swerve into the bike lane and kill you. Yet you make an educated guess that the likelihood is fairly low (yet people still die in bike lanes). Now, when people gather together and develop a rigorous public and peer-reviewed methodology that produces climate models, you reject them as useless because they do not perfectly predict the future. When all variables and rules are completely known, as in certain programming situations, then models can be created that perfectly predict the future. What about the climate suggests to you that such perfection is possible for climate forecasting? Or perhaps it is that you have a climate model that is capable of perfection? Your position, however, seems to consistently be that trying to model climate is totally pointless and a waste of taxpayer dollars. If that's not what you believe, then shut up already about it and try to help improve the modeling! -
Smitty at 07:27 AM on 31 August 2010Can humans affect global climate?
Is Dr. Singer's statement true? If not, how can it be refuted? " There is no dispute at all about the fact that even if punctiliously observed, (the Kyoto Protocol) would have an imperceptible effect on future temperatures -- one-twentieth of a degree by 2050. " Dr. S. Fred Singer, atmospheric physicist Professor Emeritus of Environmental Sciences at the University of Virginia, and former director of the US Weather Satellite Service; in a Sept. 10, 2001 Letter to Editor, Wall Street Journal -
The empirical evidence that humans are causing global warming
Unrecovered - Yes, "At equilibrium, the amount of heat escaping to space has to be the same has what is coming in". However, when increasing GHG's change the emissivity spectra, reducing the amount of radiation emitted at a particular temperature, the equilibrium temperature for equal energy is higher - things get hotter. Perhaps the statement should be "Less energy escaping to space at any given temperature [due to reduced emissivity]"? A bit wordy, but I think correct? -
Paul D at 07:17 AM on 31 August 2010The empirical evidence that humans are causing global warming
factfinder: "For all this "empirical -circumstantial evidence" there is still no experimental data and test that prove that the "greenhouse gas effect " exists." Well Roy Spencer is happy with it: http://www.drroyspencer.com/2009/12/what-if-there-was-no-greenhouse-effect/ So why aren't you? It's based on fundamental science used as a basis of thermal imaging, in chemistry and other areas of engineering and science. eg. infrared spectrography, quantum physics. Some teenagers do an experiment: http://www.nvcc.edu/home/cbentley/geoblog/2009/05/greenhouse-effect-experiment.html However such experiments don't demonstrate the lapse rate. -
Unrecovered at 07:10 AM on 31 August 2010The empirical evidence that humans are causing global warming
I find the "less heat escaping to space" label in the figure to be rather confusing and it could potentially be used to discredit the effort. I looked at it and cringed a bit until I saw that this label refers to the spectral signature of the TOA emission. At equilibrium, the amount of heat escaping to space has to be the same has what is coming in. If you are talking about the current imbalance due to lagging ocean warming, then I think you have to tell a different story. Maybe the label should be "emission fingerprint" but that might be too complicated still. -
Doug Bostrom at 07:02 AM on 31 August 2010Arctic sea ice... take 2
Argus dance around your words all you like but their meaning was fairly clear. You doubt what's reported, or perhaps more specifically you want to create an impression of doubt. "Dark water absorbs more of this energy than white ice." Sure, but how much energy are we talking about here? You go on to specify various parameters affecting absorption of solar energy in sea water at high latitudes. You "wonder" while projecting a rhetorical stance: Those who lament the absence of ice in the Arctic seem to forget (or pretend to forget) that the amount of solar energy per area unit that actually passes into the Arctic ocean through the surface, is at most a few percent (my guess) of what passes into tropic oceans. So how important is this effect? Duly answered. Nobody has forgotten the parameters you mention, but apparently you're not really interested in improved understanding, your mission or preferred perspective seems more about doubt. So in your next comment you focus on your earlier question about the difference in radiative properties of ice versus water: I have no answer, but I would like to see the subject discussed. Maybe the increased radiation during the darker hours, compensates for the absorption of energy when the sun is up? It sounds, to me, like an important negative feedback. You could have a stab at that question yourself, you could provide a constructive comment here with your result, but you appear to prefer leaving the question hanging in the air, conveying doubt. I'm done playing the game with you but here are clues to your answer: ice conducts heat about 4 times better than water, water and ice are similarly good radiators with water being a little better than ice with more emissivity particularly at longer wavelengths. Don't forget to extend your experiment into the atmosphere so as to get a net effect. -
mscavazz at 06:32 AM on 31 August 2010The empirical evidence that humans are causing global warming
doug_bostrom, what brazen omission are you talking about ? -
Argus at 06:28 AM on 31 August 2010Arctic sea ice... take 2
doug_bostrom, First, I think you ought to be more careful with how you quote people. Where did I say "I doubt it"? The answer is nowhere. You made it up, just as you invented the N+ iterations. And what is so "boringly repetitious"? I have never before raised these matters about arctic ice. Instead of answering at least one of my questions yourself, you claim that I am implying that "the people studying this" are naive. I have read through the report you recommended, and I cannot find that they adressed the function of heat radiation from a dark ocean anywhere at all. The only things they talked about were ice albedo and solar heat input. But where there is input there is also output, and it is obvious that a warm black body radiates a lot more than an icy white cold body. So most of my thoughts from #29 remain unanswered. -
citizenschallenge at 06:14 AM on 31 August 2010Sea level rise is exaggerated
20 Andrew Hobbs at 21:06 PM on 13 June, 2010 Thank you for your post. Especially in light of no one else elaborating on the statement made in "The Skeptical Argument," and that I've been trying to find something on that charge for a little while: ~ ~ ~ "Scientists from Flinders University, Adelaide, certainly DID NOT abandon the project. " "In 2003 the University decided to cease the operations of the National Tidal Facility Australia (NTFA). ... The operation was transferred to the Commonwealth Government effective from 1 January 2004." "It is possible to access their latest results on the Australian Bureau of Meteorology website at the web page for the South Pacific Sea Level and Climate Monitoring Project. " "These results support the general rate of global sea level rise noted elsewhere." ~ ~ ~ Beyond that, earlier a comment was made: "... my comments have been deemed inappropriate by a rather draconian comments policy." Well, I for one, found this back and forth discussion another wonderful (and educational) example of how science should be discussed. Too bad such a sight can't be found in the AGW Hoax blogosphere. My point is that I'm sure it is the "draconian comments policy" that makes such discussion possible so thank you John for sticking to your guns. -
Doug Bostrom at 06:05 AM on 31 August 2010The empirical evidence that humans are causing global warming
Wow, quote-miners going to work on the IPCC review w/pick and shovel. Amazingly brazen omission in pursuit of impressionism, mscavazz. How fortunate that the IPCC does not follow such degenerate techniques. Those looking for context might start w/the complete executive summary: Climate Change Assessments Review of the Processes and Procedures of the IPCC Meanwhile, notice that mscavazz' plucked cherry was from WGII. Notice from the topic heading here, this thread is about scientific evidence of climate change itself, not the subject of WGII. Find an appropriate thread mscavazz. Try plugging "IPCC" into the search box at upper left, pick an appropriate thread, go there w/further comments on the InterAcademy Review. -
Climate Models: Learning From History Rather Than Repeating It
Pete Ridley - I'm not terribly surprised that your post got deleted; I believe John Cook and the moderators prefer links to giant quotes, rather than cut-n-paste. Sadly, your post (and your ongoing attitude regarding models as in your posts here, and here) reflects one of the major characteristics of denialism: #4, Impossible expectations and standards of proof. If you include your references to John O'Sullivan and others, as you did discussing satellite temperature records, you are also using tactic #2, Fake Experts. Demanding absolute accuracy, absolute proof, 100%+ certainty - these are all tactics that have repeatedly been used to deny evidence and scientific consensus. I clearly recall these very same tactics used to argue that second hand smoking was not proven harmful, and that CFC's weren't shown to damage the ozone layer. In fact, my brother used to be one of the public apologists/deniers for a major tobacco company, trying to argue against the 'second-hand smoke' issue on his companies behalf. He frequently used the "Not absolutely proven" certainty argument - and he knew quite well he was making s**t up. He referred me to the book "Thank You For Smoking", and stated "This is my job - I am this man." I just cannot take the absolutist argument seriously. We're well past the 95% certainty level for anthropogenic global warming, with a 3 deg. C +/- ~1 warming for a doubling of CO2. Insistence on absolute proof, on climate models that absolutely reproduce temps in the presence of noise - these are just calls to do nothing, and have no scientific basis. The models do a decent job, which has been statistically shown, and ignoring predictions from them is just foolish. -
mscavazz at 05:50 AM on 31 August 2010The empirical evidence that humans are causing global warming
breaking new InterAcademy Council - Review of the Processes and Procedures of the IPCC Quote: "authors reported high confidence in some statements for which there is little evidence. Furthermore, by making vague statements that were difficult to refute, authors were able to attach “high confidence” to the statements. The Working Group II Summary for Policy Makers contains many such statements that are not supported sufficiently in the literature, not put into perspective, or not expressed clearly." -
michael sweet at 05:48 AM on 31 August 2010Why we can trust the surface temperature record
Johnd, If people noticed that you had no winter that is a predicted sign of global warming. You claimed that the seasons were not shifting in post 12. Now we agree that the seasons have shifted so much that people are noticing it. Thats what scientists call "Climate Change". There is more water in the hydrological cycle because of increased temperature of the atmosphere and ocean. Increased temperature is caused by increased CO2. This was forcast decades ago. Water responds to temperature change. Water does not force temperature to change. Yes, it is complicated, but the base of the pyramid of climate change is CO2 forcing in the atmosphere. -
Doug Bostrom at 05:35 AM on 31 August 2010The empirical evidence that humans are causing global warming
KR there is a place here suitable for cloud discussions but it does seem as though a specific "Clouds will save us" topic would be a good thing. Comes up time and again. The albedo effect. Related to this I'm interested in current efforts to reprocess old Nimbus tapes to extend ice trends farther back. Follow that link and you can see the stunning results available via reprocessing. The same methods ought to work w/longitudinal cloud cover as well, something that's not well quantified now. -
Pete Ridley at 05:28 AM on 31 August 2010Climate Models: Learning From History Rather Than Repeating It
I tried to post this yesterday but it has disappeared so I try again. You should be interested in the alternative opinion of “physicist, computer Programmer, environmental activist, financial expert” John Droz presented in his January article “Climategate: The Perils of Global Warming Models” (Note 1). This requires no embellishment from me as it reflects my own opinion perfectly. QUOTE:Moderator Response: Use your own words, please. -
The empirical evidence that humans are causing global warming
johnd, as regards to the H2O spectra - What we need to do is pay attention to what the various GHG spectra are, not philosophize on the anthropogenic principle. The various spectra are what they are; discussing whether or not we would exist in alternate universes is a completely separate (although interesting, over sufficient high quality beer) discussion. -
The empirical evidence that humans are causing global warming
johnd - Residence time for H2O is anything but a red herring. The short residence time makes H2O extremely responsive to temperature changes induced by other forcings - H2O level is a feedback, not a forcing. As to clouds - I'd have to say that CBDunkerson's comment is right on the money. We've had satellite observations of cloud cover and water vapor levels for decades, and the forcing from cloud cover is so small that there's no agreement on whether it's positive or negative. It certainly does not match or override the CO2 forcing in magnitude. At this point the science indicates that cloud feedbacks are essentially irrelevant. John Cook/moderators - I've been seeing the skeptic argument that 'the clouds are a huge negative feedback' for some time; from the Lindzen 'iris' effect to JoNova's web site, etc. This is essentially a "It won't happen" argument regarding AGW. Should we have a topic to discuss that here on SkepticalScience? -
CBDunkerson at 04:41 AM on 31 August 2010Arctic sea ice... take 2
For those keeping track; Arctic sea ice extent is now at about 5.25 million km^2... placing it below several of the ARCUS predictions for this year and on track to likely wind up somewhere in the middle of the pack. That said, the ARCUS predictions are for the September average rather than the absolute minimum and thus the rate of re-freeze in the latter part of September will be a significant factor. Still, it seems clear that this year will have a lower extent (both absolute and September average) than 2009. It probably won't beat the 2008 (or 2007) minimums and thus will likely be the third lowest extent on record. As noted above, Arctic ice volume is already at a new record low and still dropping. -
johnd at 04:39 AM on 31 August 2010Why we can trust the surface temperature record
michael sweet at 00:55 AM, whilst I'll concede that the timing of the seasons is constantly adjusted to accommodate slippage bought about by orbital cycles, as the chart above indicates the two seasons that are most subject to change due to changing orientation are spring and autumn, granted over a long period of time, but an ongoing process none the less. As we have discussed before, there are more factors that determine the timing of the seasons than just temperature or the calender. Seasons can begin and end early or close late for a variety of reasons. This year for instance in south eastern Australia people could be forgiven for think that spring came 6 months early and we went from spring to summer and then straight back to spring again such was the response of the plants and the animals that depend on them, all due to the amount of water vapour that cycled through the hydrological cycle. -
CBDunkerson at 04:04 AM on 31 August 2010The empirical evidence that humans are causing global warming
TOP #10, a hundred years ago actual skeptics argued that the IR absorption spectrum of H20 completely overlapped that of CO2 and thus CO2 caused no additional warming. However, this was proven incorrect both in that better instrumentation has allowed us to identify bands where the two do not overlap (as you note) but also because CO2 is found higher in the atmosphere than H20 and thus would continue to have a warming effect even if its absorption spectra WERE completely overlapped by H20. You are thus recycling an actual reasonable skeptic argument... from 1908. Unfortunately, as KR points out, you add an additional layer of error in the claim that IR emissions will shift to exclude the 'CO2 only' absorption bands... we'd all be dead LONG before that could happen, but as noted above the CO2 higher in the atmosphere would STILL induce warming even at the wavelengths where H20 overlaps. -
johnd at 04:01 AM on 31 August 2010The empirical evidence that humans are causing global warming
KR at 03:12 AM, the residence time of water vapour is a red herring, what is relevant of course is the volume of water vapour in the atmosphere at any one time and how this changes over time. The relating of CO2 to night time temperatures also applies to clouds which have the same effects both in the short term and over the longer term. It is no coincidence that when looking at periods of long term drought as against periods where above average rains occur in the drought flooding rain cycle, frosts tend to be more frequent, and more severe during the drought cycle because of the generally lower cloud cover. With regards to the absorption spectra, one needs to decide whether the H2O spectra is determined by the properties of H2O that enables it to change state at fixed points or not, and whether it is coincidence or not that the conditions that allow life on earth as we know it just happens to be within that H2O band of high emissivity. -
Doug Bostrom at 03:19 AM on 31 August 2010The empirical evidence that humans are causing global warming
TOP, you apparently agree that water vapor is a positive feedback, increasing w/warming and multiplying the primary effect of additional C02 in the atmosphere, as predicted? Dai, HadCRUH, Barry & Kent specific humidity 1970-. -
The empirical evidence that humans are causing global warming
TOP - You might want to look at the discussion on Water vapor is the most powerful greenhouse gas. Water vapor is more powerful as a greenhouse gas, but changes in water vapor have a lifespan in days or weeks, while CO2 has a lifespan on the order of centuries. Hence the changes in water vapor are feedbacks/reactions to the temperature changes from CO2, the current forcing driver. Secondly, the CO2 and H2O spectra (as seen here), while separable, are quite interlaced. If you remove some of the CO2 spectra by heating then you're removing H2O effects as well. And note that the thermal spectra of the Earth's surface would have to heat up a LOT to no longer involve CO2 and H2O - not quite to plasma levels, but well beyond anything predicted by any greenhouse effect. Paying attention to the reduced emissivity of the atmosphere due to CO2 is by no means cherry picking. It's a core detail of how our climate is changing. -
Doug Bostrom at 03:03 AM on 31 August 2010Arctic sea ice... take 2
Do the numbers on reduced albedo Argus (repeating what researchers have not forgotten to do) and you'll be treated to some staggeringly large figures. Increasing solar heating of the Arctic Ocean and adjacent seas, 1979-2005: Attribution and role in the ice-albedo feedback Follow the references in the paper above and you can see why it's fallacy to believe the people studying this are as naive as you imply. "I doubt it" sure becomes boringly repetitious after N+... iterations. -
Argus at 02:46 AM on 31 August 2010Arctic sea ice... take 2
Whenever sea ice in the Arctic is discussed, I see only one aspect of the ice sheet mentioned: the property of reflecting incoming heat, from the sun, back out into space. The albedo of ice and snow is certainly much higher than that of open, dark, water. But another aspect is that even a relatively thin ice sheet serves to keep the heat of the water locked in. How much heat is radiated from an open ocean surface at, say, 274 degrees Kelvin at night, compared to that from an ocean surface covered by arctic ice? I have no answer, but I would like to see the subject discussed. Maybe the increased radiation during the darker hours, compensates for the absorption of energy when the sun is up? It sounds, to me, like an important negative feedback. "Dark water absorbs more of this energy than white ice." Sure, but how much energy are we talking about here? The same amount of sunlight that hits a square meter, or slightly more, in the tropics, is spread out over more than five square meters at a latitude of 80 degrees north (or south). In addition to this dilution, the same sunlight also has to pass through five times as much atmosphere on its way down to the surface. Even less energy is thus left to possibly pass into the water. But then we have one more factor: much of (most of?) the radiation that hits the water at an angle of 10 degrees, is reflected like from a mirror. Those who lament the absence of ice in the Arctic seem to forget (or pretend to forget) that the amount of solar energy per area unit that actually passes into the Arctic ocean through the surface, is at most a few percent (my guess) of what passes into tropic oceans. So how important is this effect? I do not know, but I would certainly like to learn more from somebody who does. -
TOP at 02:44 AM on 31 August 2010The empirical evidence that humans are causing global warming
Another two observations show that CO2 is trapping more heat: 1. Satellites measure less heat escaping to space at the precise wavelengths which CO2 absorbs. 2. Surface measurements find this heat is returning to Earth to warm the surface. A little cherry picking here. Water vapor is the biggest blocker of radiation to space. There is a notch in that block around the temperatures we need for life. CO2 is a very small block at the bottom of that notch. As temperatures rise the emitted IR wavelength becomes shorter and starts to miss the CO2 block. If temperatures rise enough the effect of CO2 becomes minimal. The whole focus on CO2 while disregarding H2O is cherry picking. While temperature is rising at one rate according to the measurements presented here, the global dew point is rising faster. -
CBDunkerson at 02:08 AM on 31 August 2010The empirical evidence that humans are causing global warming
factfinder, the greenhouse gas effect was first proposed by Joseph Fourier in 1824, proven to exist by John Tyndall in 1858, and quantified by Svante Arrhenius in 1896. Anyone who tells you that it doesn't exist is simply ignorant. It has been unquestioned science for well over a century. -
factfinder at 01:44 AM on 31 August 2010The empirical evidence that humans are causing global warming
For all this "empirical -circumstantial evidence" there is still no experimental data and test that prove that the "greenhouse gas effect " exists. Much of the "empirical evidence " has been shown to be from other causes ,no relationship to CO2 period. The fantasy work of John Cook and the AGW fanatics.Response: The direct observational evidence of a CO2 greenhouse effect is outlined here, giving several independent lines of evidence. The direct observational evidence of an increasing greenhouse effect due to increasing CO2 levels is given above in points 5 and 6 but also fleshed out in more detail here. -
Doug Bostrom at 01:19 AM on 31 August 2010Long Term Certainty
JMurphy, you're forgetting about the forced subsidy we'll be paying to the fossil fuels industry in upcoming years. Estimates on those future payments range from $890 trillion to $1240 trillion, depending on how much we want to comply with industry desire for us to pretend that paying for their products ends when fuel is delivered and money is handed over. Assessing the costs of adaptation to climate change Waffling about making decisions might be considered another gift. The top eight petroleum extraction, refining and marketing firms enjoy something like $2.2 trillion per year of revenue for each year we choose to help them continue thriving. That revenue could be dialed back even as we conserve petroleum products for better uses and simultaneously shrink the subsidy of adaptation we'll be making to those firms in future years. What's really annoying in the case of the petroleum industry is that the adaptation subsidy will continue long after they're unable to deliver useful quantities of their product. What a deal for them, eh? -
RandyL at 01:08 AM on 31 August 2010The empirical evidence that humans are causing global warming
Re; Jaydee #3. Recently the 'average' daily temperatures in Houston have been so high that we will see the hottest August (for that matter the hottest month) ever recorded. This is due significantly to the extremely hotter nights. Yes the nights cool but they cool less and therefore the averages are higher. There, the nights are staying warmer, thus warming faster than the days. Our daily high temperatures are high but not much above the averages. Our nights are much higher than average. Hope this makes sense somewhat. -
Doug Bostrom at 01:04 AM on 31 August 2010Pakistan flood: many more will die unless more aid is delivered quickly
Anything really to argue about here? As the WMO notes: "A series of recent publications indicate that main patterns of atmospheric variability exhibit noticeable changes and are predicted to be different in a warmer climate." Paraphrased, different things are expected to happen and different things are observed to be happening. What happened in Pakistan is novel in our records, could reasonably be attributed in part to what the WMO notes. Meanwhile expansion of human culture is expanding risks incurred when weather explodes old statistics. Monomania is not productive. For my part, I just noticed the point of John's post and will once again dig into the old wallet. If I have any serious reservations they come down to my unfulfilled wish I could get a signed statement about improved birth control when I send money into places like Pakistan. My qualms do not address the needs of the already-quick. -
michael sweet at 00:55 AM on 31 August 2010Why we can trust the surface temperature record
Johnd, The Milankovich cycles affect very long term climate, beyond one human life. It is known that these currently are a net cooling forcing, not a warming forcing. AGW has overwhelmed this effect and converted the trend into warming. This does not affect the timing of seasons and the response of animals and plants to those changes referred to by Steve in post 11. The timing of the seasons is a clear mark of AGW in the empirical evidence. -
CBDunkerson at 00:51 AM on 31 August 2010The empirical evidence that humans are causing global warming
Jaydee, greenhouse gases slow the rate at which heat escapes the atmosphere. As you say, nights tend to cool down... because heat is escaping and no more is coming in from sunlight to replace it. However, as the concentration of greenhouse gases in the atmosphere increases the rate at which heat escapes decreases... and nights cool down more slowly... which causes the average night time temperature to be higher... which is why "nights warm faster than days" under greenhouse warming. -
CBDunkerson at 00:40 AM on 31 August 2010Hurricanes aren't linked to global warming
I was playing around with some North Atlantic hurricane data and got a chart very similar to figure 1 above (except up through 2009 and without the 'major hurricanes' distinction) when something occurred to me. How can Landsea make the 'better detection' argument when there is no evidence of a change in values when the detection methods changed? If you look at the 'tropical storms' section from the end of the 'ships with radio' period through 'aircraft', 'radar', and the start of 'satellite' tracking there is very little change... just some minor up/down variation. If Landsea's claim that storms were systematically missed by the older methodologies were true there should be one or more significant jumps in there. Instead, we see storm levels holding fairly steady until ~20 years into the satellite tracking era... and then climbing steadily for the 20 years since then. Granted, the period of sharply increasing storm activity is fairly short and difficult to draw definitive conclusions from... but that doesn't change the fact that the data doesn't show any evidence of the measurement bias Landsea suggests is behind the increase. Also note that there was an earlier increase in frequency up until leveling off around 1950... that corresponds to the early 20th century warming period and the leveling off to a period of more level temperatures... all within the 'ships with radios' measuring period. Again, it is a short timeframe, but again there seems to be a correlation to temperatures rather than measurement methodology. All of these trends are present, but less distinct, on the 'hurricanes' and 'major hurricanes' subsets of the data as well. Obviously the temperature to storm/hurricane count correlation is not a perfect match... but there is NO correlation between the changing methodologies and increasing storm/hurricane count. Doesn't that invalidate Landsea's argument? -
chris1204 at 23:38 PM on 30 August 2010The empirical evidence that humans are causing global warming
Perhaps it would be better to say that increased CO2 hinders night-time cooling. Also: 4.Corals show that fossil carbon has recently risen sharply. Perhaps better to say, 'Corals show greater amounts/proportions of carbon/ carbonates/ calcium carbonates/ thought to/likely to originate in fossil fuel.' At the risk of pedantry, we don't actually know the specific origin of any individual carbon atom no matter what the isotope in any given coral. A brief statement explaining that corals are animals which produce an outer skeleton made out of calcium carbonate would prevent excessive dumbing down. Also, the presence of increased carbonates of fossil origin seems unreferenced in the original post (though this might be an oversight on my part). Perhaps this leads onto the question of oceanic sequestration of carbon though maybe this could be dealt with in another post. -
Ken Lambert at 23:33 PM on 30 August 2010Sea level rise: the broader picture
Peter Hogarth #15 There are a couple of problems with the consistency of CO2GHG warming with sea level rise. Firstly the chart shows that sea level rise from ARO 1925 to 1960 was similar to or steeper than the overall trend and similar to the recent trend despite the fact that theoretical CO2GHG forcing was around 0.4-0.6W/sq.m compared with 1.66W/sq.m in 2005 and higher since. Three times the theoretical forcing and lower or similar rate of sea level rise. Dr Trenberth finds that approx 2mm of recent sea level rise can be attributed to ice melt out of a total 'observed' of 2.5mm. You don't need very much heat; 2-3E20 Joules to melt this ice, but you need 20E20 Joules to produce 0.4mm of thermosteric rise. The 23E20 Joules required for 2.4mm of SLR is far short of the purported imbalance of 145E20 Joules to meet the postulated CO2GHG warming.
Prev 2250 2251 2252 2253 2254 2255 2256 2257 2258 2259 2260 2261 2262 2263 2264 2265 Next


