


 Arguments


Recent Comments
Prev 220 221 222 223 224 225 226 227 228 229 230 231 232 233 234 235 Next
Comments 11351 to 11400:
-
One Planet Only Forever at 01:26 AM on 17 August 2019Millions of times later, 97 percent climate consensus still faces denial
Joe Wiseman@1,
It is an error to presume that 4% of climate scientists are sociopaths and that 97% consensus means that 25% (not 1%) of the climate scientists who are sociopaths accept the developed and improving understanding of climate science and the related corrections of developed human activity.
Building on Joe Wiseman's point about the science showing that a significant percentage of the population lack the instinct to care about how their actions harm other life forms including future humans (more words, but a clearer statement of the problem than the term 'sociopath'), it is important to understand that the competitions for perceptions of status based on popularity and profitability encourage people to compromise their instinct to be helpful or caring, developing harmful results that can powerfully resist correction.
Tragically for the future of humanity, the socioeconomic-political systems that develop tend towards harmfully undeserving people becoming the Higher Status and more powerful people. And that includes a higher percentage of the 'people who lack the instinct to care about how harmful they are' among the Higher Status than in the general population (google it).
And that higher percentage of the instinctively harmful (because of a lack of the instinct to care or be helpful) among the winners is the evidence that the system they were Winners in promoted and excused that type of behaviour. In those systems others who have the instinct to care are ata competitive disadvantage and are encouraged to compromise their Caring instinct for other interests or instincts. And Jonathan Haidt has identified the set of human Instincts that can work against the Good Work of developing a sustainable constantly improving future for humanity.
The following is the Wikipedia presentation of Haidt's 'Human instinctive/reactive' (not thoughtfully considered) Tastes that he incorrectly identifies as Moral/Ethical (having read Haidt's book I know that Wikipedia has correctly presented them):
"1) Care/harm: cherishing and protecting others; opposite of harm
2) Fairness/cheating: rendering justice according to shared rules; opposite of cheating
3) Loyalty/betrayal: Loyalty or ingroup: standing with your group, family, nation; opposite of betrayal
4) Authority/subversion: submitting to tradition and legitimate authority; opposite of subversion
5) Sanctity/degradation: abhorrence for disgusting things, foods, actions; opposite of degradation
6) Liberty/oppression: objection to coercion by a dominating power or person; opposite of oppression"
Any of the Other 'passionate impulses' can result in a contravention of the Help/Harm consideration (even a claim of needing to be Fair can be abused to defend harmful unsustainable actions - compromising helpfulness in order 'to be fair to those who want to be harmful'). It needs to become understood to be Unethical and Immoral to allow those Other 'instincts/impulses' to count as credits against the Pure thoughtful Ethical consideration/determination of a help/harm evaluation of merit. They are only ethical if their Means and Ends fit fully within the circle of Help/Harm limitation. And it can be seen that political groups Uniting the Right prey on those other instincts to collectively harmfully fight to resist progressive helpful correction.
So the required correction for the benefit of the future of humanity requires the caring instinct to Govern over all other interests. And that will require the people perceived to be higher status to prove that they deserve their status by consistent helpful actions. And that will require legal mechanisms for lower status people, and the future generations of humanity, to effectively penalize any high status person whose actions are contrary to help achieve and improve on the Sustainable Development Goals and similar developed understandings of what it takes to be Deserving of Status, deserving to be admired or valued.
And the Propaganda Model developed by Edward S. Herman explains how competition for popularity and profit can and does make up stories that harmfully resist the required corrections of understanding.
Admitting that the games are massively rigged and require significant correction is a Good Start.
And exposing the harmfulness and unacceptability of the people who choose to resist the correct understanding of the consensus regarding climate science is a powerful mechanism for pushing for the required corrections of understanding.
-
youjaes at 01:12 AM on 17 August 2019Increasing CO2 has little to no effect
@JohnSeers @375
Okay, I'll bite you back.
1. If CO2 isn't driving the initial temperaturte rise, then what reason is there to cite it in subsequent rises?
2. Did you forget about the ice core data? Temperature goes up, then temperature goes down before yhe CO2 does. Were you not paying attention?
3. Go ahead, do some.
4. Do you normally contradict yourself? Decreasing surface wind speeds is associated with increasing surface temperatures. Decreasing global surface wind speeds means what, no global surface temperature change?
Do pay attention.
Moderator Response:[DB] This is a moderated forum. Please comport your comments to comply with this site's Comments Policy.
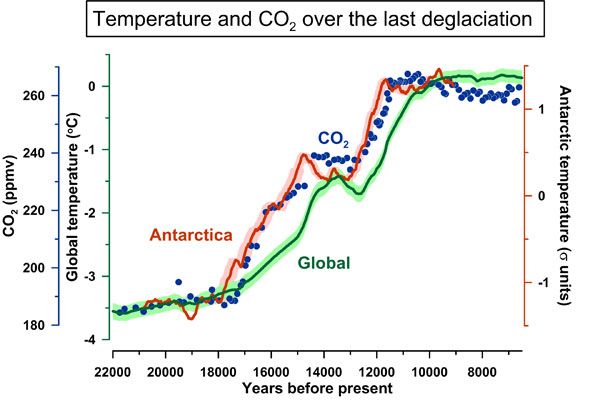
From the depths of the Last Glacial Maximum 20,000 years ago, CO2 levels increased due to warming from Milankovitch forcings, which then triggered an immense increase in atmospheric CO2, which drove the bulk of the temperature increase needed to drive the world from full glacial phase into the full interglacial world of today.
In short, the initial warming was indeed triggered by the Milankovitch cycles, and that small amount of orbital cycle-caused warming triggered the CO2 release from the Southern Oceans, which caused most of the glacial-interglacial warming. CO2 led and was the primary driver behind most of the glacial-interglacial warming.
From Parrenin et al, we see that temperatures and CO2 levels in Antarctica rose synchronously, with no lag in either measurement.
According to the Shakun et al data, we see that increase in atmospheric CO2 led the increase in global temperatures for the remainder of the globe.
https://science.sciencemag.org/content/339/6123/1060
https://www.nature.com/articles/nature10915
Inflammatory rhetoric snipped.
-
Joe Wiseman at 23:12 PM on 16 August 2019Millions of times later, 97 percent climate consensus still faces denial
Greed is a powerful negative motivator. Another important variable is that 4% of the population, on average, are sociopaths. Apparently we have gotten 1% of the sociopaths on side. That's not bad actually.
-
JohnSeers at 22:35 PM on 16 August 2019Increasing CO2 has little to no effect
@youjaes @374
OK, I will take the bait.
You clearly are not very well informed on climate science and you have not spent anytime thinking about the points you make. Let me give you some ideas to think about. If you have more questions there are plenty of knowledgeable people who will (sincerely) help if you ask in good faith.
1. The CO2 may not be driving the initial temperature rise but there is no reason to discount it in subsequent rises.
2. Is CO2 still elevated? What events are you talking about? I would guess Milkanovich cycles may answer your question.
3. Who says you cannot measure greenhouse effects with "backyard" experiments? Why do they have to be "backyard"? Are "backyard" experiments somehow more convincing than frontyard experiments? I suggest you read something about the greenhouse effect as you do not understand it.
4. Um. Yes, wind can reduce/increase local temperatures. What has that got to do with global warming?
-
youjaes at 21:57 PM on 16 August 2019Increasing CO2 has little to no effect
I'm looking at the comments and wondering about what I think are obvious things.
1. The 800 year CO2 lag should indicate that CO2 isn't driving temperature.
2. If increased CO2 raises temperature, what is causing the subsequent temperature crashes since CO2 is still elevated?
3. If you can't measure greenhouse gas effects with 'back yard' science experiments, what makes anyone think there is an effect in the first place? Yes, CO2 is a 'greenhouse gas' where people add over 1000 ppm of CO2 to help the plants grow. Apparently that much additional CO2 isn't noticably changing the inside temperature, so why would a 100 ppm change in the atmosphere have any measurable change in planetary surface temperatures?
4. There is another reason why surface temperatures can increase, specifically, reductions in surface wind speeds, which is occuring. Here is a report complaining about it.
https://wattsupwiththat.com/2018/12/05/study-global-wind-speed-dropping-wind-farms-victim-of-atmospheric-stilling/
-
Philippe Chantreau at 09:41 AM on 16 August 2019Skeptical Science New Research for Week #32, 2019
Here is something else that goes with the Zang et al (on carbon sequestration) paper cited above:
Increased atmospheric vapor pressure deficit reduces global vegetation growth
The old and tired argument that CO2 is plant food seems not to be borne by evidence.
-
MA Rodger at 20:09 PM on 15 August 2019Models are unreliable
rupisnark @1151,
The basic message is as Eclectic @1152 says, Christy is trying to pull the wool over your eyes. It may be he has managed to pull the wool over his own eyes as well. That would square with him being in denial over climate change.
And Eclectic @1152 is correct to say that AGW is a phenomenon at the TOA but Christy is not discussing TOA. He is indeed obfuscating.Your first point, that global evaporation can vary by large amounts month-to-month (Christy quoted examples of 24 and 27 'units' in his talk, a variation peak-to-peak of some 12%, a little more variation than his words in GWPF Note 17 - "In other words, evaporation might be 24 one month, but it might be 26 the next."), looking at actual monthly variation, the maximum variation of measured global monthly precipitation over decads (there's a graph of it 1980-2011 on this web-page) is about 12% peak-to-peak. Thus to say such a variation could occur "one month" to "the next" is pure exaggeration. The typical variation month-to-month is far far smaller.
And it is far far smaller doubly-so. Your point that 12% is a big value is twice incorrect. As they say '100% of naff-all is still naff-all.' And the typical variation month-to-month in surface heat flux due to precipitation is naff-all relative to the total precipitation which in turn is a small component of the total surface heat flux.
And your inference that such variation in precipitation would be even larger at longer timescales, "annual, let alone centennial fluctuation" is not correct. Over longer timescales the variations will tend to average out, although there will be trends caused by the likes of AGW.
You also suggest that longer term fluctuation could exist in "the many other variables of both inut (eg amount of solar radiation) and output." The solar cycle resilts in TSI wobbling by 1Wm^-2 peak-to-peak. In Christy-units that would be 0.07 units peak-to-peak (of the 11-year cycle) but when averaged out over longer periods the measure would be far far smaller. That this is a minor effect climate-wise is evinced by the absence of any noticable 11-year climate cycle.Your second point is that "Christy’s diagram does NOT imply 0.5 units is retained." I don't know why you would suggest such an implication. In GWPF Note 17 Christy states "The extra carbon dioxide we have added to the atmosphere amounts to about an extra 0.5 of a unit of the 100 downwelling from the air." So if the CO2 is there, surely the 0.5 units are there. I see no evidence of any implication that the forcing is not permanent.
You further suggest that there is "extra heat being lost in the troposphere" which might provide "one possible reason," this proposal "backed up" by an area of the upper troposphere that has not warmed in line with modelled projections. I don't follow the logic. By what mechanism would a cooler part of the upper troposphere constitute a sink for a heat flux of 0.5 Christy-units? -
Eclectic at 14:47 PM on 15 August 2019Models are unreliable
Rupisnark @1151 ,
how does evaporation qualify as an input or output of the planet?
"Top Of Atmosphere" [TOA] is normally taken as the planetary boundary, concerning the gaining of heat/energy and the losing of heat/energy (i.e. concerning the equilibrium or disequilibrium of energy flux re global warming or cooling). Evaporation & condensation move the heat around within the boundary ~ this plus convections of ocean and atmosphere do variably affect the distribution of heat/energy . . . but this is all part of the "averaging" which contributes to the TOA energy flux.
The multi-decadal average is the determinant of climate change. Dr Christy is obfuscating.
-
rupisnark at 05:05 AM on 15 August 2019Models are unreliable
@MA Rodger 1141
You state: “The constant 0.5 imbalance is "almost" (Christy also says "much more" which is a poor description - "more" yes, "much more" no.) the same size as the occasional fluctuations, his examples being monthly wobbles of +/-1.0 & +/-1.5.”
But Christy’s examples, which you appear to accept, take for instance evaporation of 24 average increasing to compared to 27 over a monthly which is actually a 12.5% change in the amount of heat lost through evaporation. That is clearly not small and that is just a monthly rather than annual, let alone centennial fluctuation of one of the many variables of both inputs (eg amount of solar radiation) and outputs.
Christy’s diagram does NOT imply 0.5 units is retained. His diagrams show in=out.
I think Christy believes one possible reason for the difference is explained by the extra heat being lost in the troposphere. This backed up by Steven C Sherwood and Nidhi Nishant “ tropospheric warming does not reach quite as high in the tropics and subtropics as predicted in typical models”. https://iopscience.iop.org/article/10.1088/1748-9326/10/5/054007/pdf. -
Philippe Chantreau at 01:24 AM on 15 August 2019CO2 lags temperature
Sorry indeed about the sockpuppetry. In any case, the argument made no sense whatsoever. It's not like there isn't a well known, precisely measured, accurately modeled physical mechanism...
-
One Planet Only Forever at 23:59 PM on 14 August 2019State of the climate: 2019 set to be second or third warmest year
The Image for Actric Sea Ice Extent by Week (from NSIDC) is too wide. It spills over into the blue.
And unlike other images it does not have a scroll bar on the right side. Clicking on the image does allow the image to be scrolled
Moderator Response:[DB] Fixed width issues.
-
Eclectic at 13:24 PM on 14 August 2019CO2 lags temperature
Scaddenp , thanks for your recent comments.
My sympathies, over the sockpuppet business.
At first glance, his comments were rather bizarre and halfway to word-salad. But I always remain hopeful that some Denialist (given enough rope) will one day come up with a decently valid point against AGW science.
But it hasn't happened yet !
-
nigelj at 12:23 PM on 14 August 2019Can Land cause Climate Change? (new IPCC report)
The use of corn and other crops for biofuels is completely senseless. There is not enough land to scale it up significantly; it just displaces other vital crops. There may be future in things like using kelp, or biofuel crops grown on wasteland where nothing edible can be usefully grown.
https://en.wikipedia.org/wiki/Biofuel#Sustainable_biofuels
-
scaddenp at 11:56 AM on 14 August 2019State of the climate: 2019 set to be second or third warmest year
Or to give present sealevel rise some perspective:
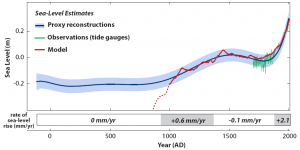
Source: Kemp et al 2011, reproduced and discussed here.
-
Jonas at 08:37 AM on 14 August 2019Skeptical Science New Research for Week #32, 2019
Doug, thank you for providing this list and the introductory comments which I both very much appreciate! (Will not repeat this every time, but until now I only uttered general thanks to the team; someone is doing the work though ..).
-
scaddenp at 08:20 AM on 14 August 2019CO2 lags temperature
Rats, arguing with sockpuppet. What a waste of time.
-
scaddenp at 08:08 AM on 14 August 2019CO2 lags temperature
"Great question. Also an intellegent question. It's something that many Climate Scientists have tried to brush off with a "yes, but CO2 then becomes the forcing agent" as if autocorrelation is only done at the beginning of each interglacial phase. It isn't. It's done over the entire time series, including when CO2 is suppose to become the forcing factor."
Let's break this down. Firstly, do you accept that glacial cycle is orbitally forced? Further discussion makes no sense if this is not the case.
Assuming you accept orbital forcing, how do you explain why SH glaciation is synchronous with NH (since orbital forcing is anti-phased). Its easy if you accept known physics (GHE included) but you apparently want to deny that increasing CO2 will warm the planet.
Secondly, how about linking to some more actual detail about your "autocorrelation" stuff. I dont get your point and I certainly not clear to me what you think you are proving. The relationship between T and CO2 is still somewhat unconstrained but is clearly non-linear and involves multiple mechanisms operating on scales from years to millenia.
What is the basis for your understanding of "their ever decreasing estimates of how much CO2 impact climate". I certainly do not get that from successive IPCC reports.
You seem to be implying that papers on direct observation were arguments from correlation. This is not the case. The arguments in those are of the form, "fundimental physics allows us to predict what observations done by this method would show. Let compare model results with observation".
So from this, you compute how much much the radiation at the surface will change with GHG concentration change - and measure it. You look at how GHG changes would change the spectrum of outgoing or incoming radiation - and measure them. That is what those papers do. Hansen and Sato compute forcing from change in GHG using ice core bubbles as proxy for atmospheric concentration, and compute the change in albedo based on sealevel etc, and finally the global solar irradiation change from milankovitch. Climate theory would expect icecore temperature to be related to that forcing calculation extremely closely and that is what is observed. A failure to observe that would be evidence against.
Can I ask whether you accept Planck Law? ie, if irradiation of surface increases, then it temperature must rise.
Finally, climate change at present appears to be forced by GHG change. The feedback mechanisms that apply during ice ages wont cut in any significant way for 100s of years. The natural system is still moping up about half of our emissions which make 616 invalid (actually so many issues with this, its hard to know where to start. You need 30 year averages remove the internally variability, especially ENSO.)
-
Doug Bostrom at 06:34 AM on 14 August 2019Skeptical Science New Research for Week #32, 2019
Thanks for the heads-up eschwarzbach. For human eye and machinery alike the lack of standard nomenclature or other consistent indicators for open access is a bit of a challenge. We're working on it.
-
MA Rodger at 00:39 AM on 14 August 2019Models are unreliable
I had a second, more focused look at Sarkomaa & Ruottu (2019) and find it a worthless piece of work.
Clouded by ♥ a confusing use of English & ♥ not-scientific presentation, these elderly Finnish professors provide an account riven with ♥ unsupported but controversial assertions, ♥ silly mathematical constructs and ♥ mathematical models that entirely fail to capture the workings of climate (let alone AGW).
Such a conclusion does need some further demonstrating.
......
♥I don't think their poor use of English needs demonstrating.
♥The lack of scientific presentation is shown many times. As an instance, they insist (p6) that:-
"If all linear radiation coefficients of clouds are set zero, the SRclimate model of Appendix 4 [and of their design] calculates about 100 W/m2 increase of solar energy flux to the ground and about 13 °C increase of the mean temperature of the ground. This agrees with the generally known fact that when cloud comes in front of the sun temperature decreases. Thus, IPCC’s climate change claim should be based on calculations with negative, instead of the positive cloud feedbacks."
Their "generally known fact" is of course simplistic nonsense and the absence of "general agreement" is all too evident in Zelinka et al (2017), a reference cited by Sarkomaa & Ruottu. Yet this diparity is not addressed by Sarkomaa & Ruottu who instead treat us to mention of a peurile interchange with Finish climatologists (p6).
♥The lack of science extends to a large number of obviously unsupported controversial assertions. An example:-
"Figure 1[*] Figure shows that the mean temperature of the ground has been always varied and it is sure, that the variation is going to continue. During the latest 50 thousand years the mean temperature of the ground has increased about 6 ºC and that the increase is going on. On long term decreasing trend can be noticed which is due to inevitable decrease of nuclear reactions in the sun. The hundreds year trends are due to variation of surface temperature of the sun. These variations have nothing to do with CO2 concentration in the atmosphere."
[* on Page 20. Figure plotting global temperatures of last 2Myr based on Snyder (2016), Zachos et al (2008), Lisiecki & Raymo (2005) and 800kyr of Vostok ice core data scaled at 1:2. These first two references contradict the "nothing to do with CO2" assertion.]
♥The nonsense is aided by the use of silly mathematical calculations presented seemingly for no reason. Their equation 4.16a p52 presents an easily understandable example, it being a formula for an average global temperature for time t=0 to t=a obtained by integration over the surface of a sphere. Quite how anyone would obtain formula to use in such an integration of average temperature of a planet (Sarkomaa & Ruottu describe it as being "entirely impossible") or for what purpose they present the formula is not explained.
♥Perhaps their main conclusion is expressed within their blog commentary of their analysis which translated @1145:-
"It follows from Planck's Law and the equation for spectral radiance that the effect of increasing atmospheric carbon dioxide on global temperatures is asymptotic, not progressive."
Here Planck's Law is what within AGW is usually expressed in climatology as the Stefan-Boltzmann relationship although here its exact application is not entirely clear.
"Spectral radiance" is described as "The basic physical concept of radiative heat transfer" (p66) and the "asymptotic" level (which is found to be 288K, the average global temperature which the modelling is set to) appears to be the equilibrium temperature which, of course, will be arrived-at in a manner "asymptotic, not progressive" (as in their eq 5.1) as the equilibrium temperature is approached. The modelling is then used to demonstrate that there will be no significant increase in surface temperature if there is more CO2 in surface air. The result should actually be zero because the air has not been allowed to increase in temperature (the AGW effect is not driven by surface phenomenon) and so cannot have any extra radiative effect to warm the surface. All that happens is the IR path-length decreases within the CO2 absorption bands at the same rate at which the amount of CO2 emiting this IR increases - thus zero effect.
Sarkomaa & Ruottu actually report that in the absence of other GHGs, the "increase of carbon dioxide concentration has strong influence on the mean temperature of the ground." Their Fig 5 p73 is missing the 0.0005 'multiplier' plot but the other plots would suggest a 'climate sensitivity' of 1.0ºC at 0.0005 but this value for 'sensitivity' looks to be increasing exponentially as the 'multiplier' decreases. So if the 'multiplier' were reduced to zero, climate sensitivity (for a CO2 doubling) would be infinite.
But with the 'multiplier' at 1 and GHGs properly represented in their model, the "increase of carbon dioxide concentration has practically no influence on the mean temperature of the ground." Yet, as stated above, given what they are apparently modelling (which is not climate sensitivity), the answer should be zero. -
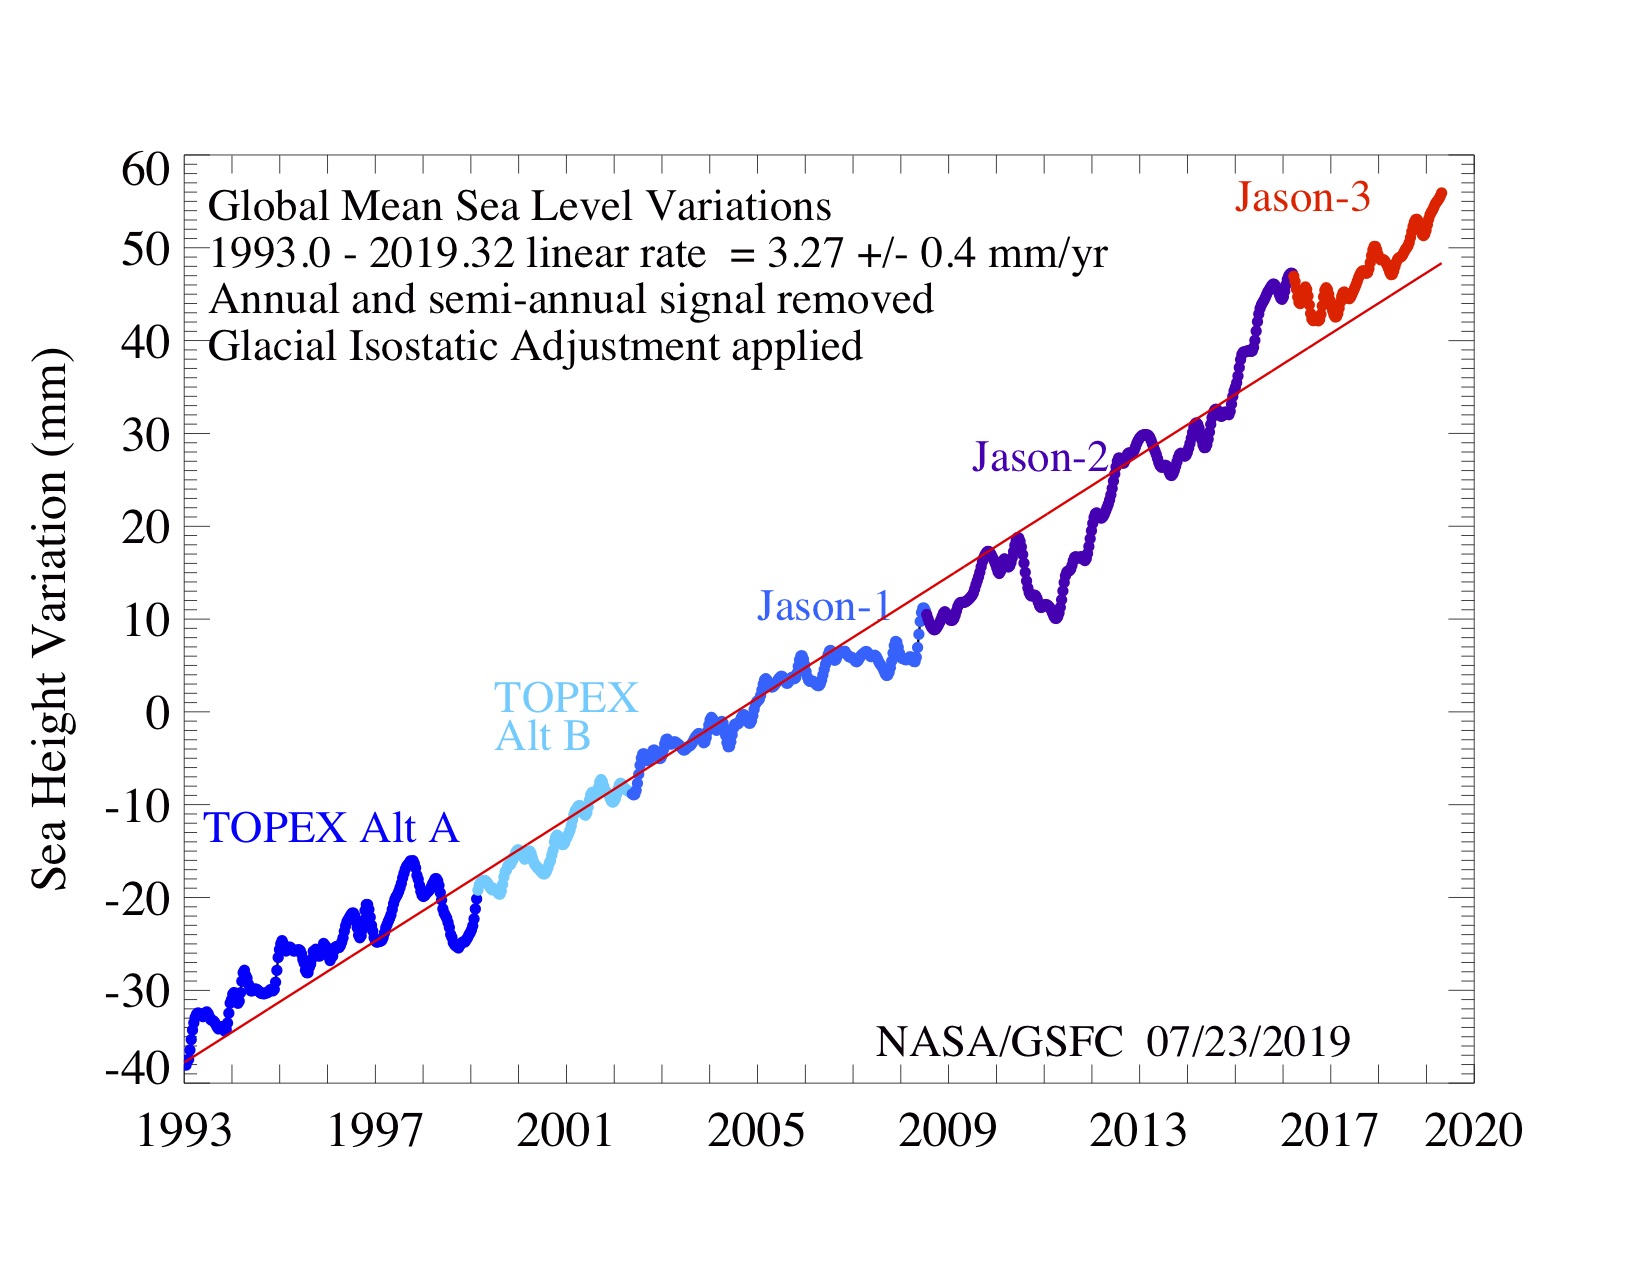
RBFOLLETT at 23:33 PM on 13 August 2019State of the climate: 2019 set to be second or third warmest year
And where is actual sea level in all this?
Moderator Response:[DB] Global sea levels are still rising:
-
RedBaron at 22:13 PM on 13 August 2019Can Land cause Climate Change? (new IPCC report)
You can start by actually reporting what they said, instead of what you wished they might say.
They did NOT say eating a lot less meat will save the planet. That’s a ridiculous statement in your video. But at least you immediately followed it up with a pretty smug disclaimer of your personal biases.While they occasionally make bloopers, they didn’t this time. What the report states with high confidence that balanced diets featuring plant-based and sustainably produced animal-sourced food
“present major opportunities for adaptation and mitigation while generating significant co-benefits in terms of human health”.
The key here is sustainably produced balanced diets. In some cases that might mean less meat, in many cases around the world it actually means we need more meat to make properly balanced sustainable diets.
Do I agree with the actual report when not misrepresented…..somewhat. The report also makes the claim we need to grow biofuels as a way to help mitigate AGW. Couldn’t be further from the truth.
It’s Time to Rethink America’s Corn System
That’s the real reason behind the big push to reduce meat consumption…Industry wants more corn and soy for biofuels like gasohol and the land will continue to degrade. Biofuels like corn are the absolute least efficient way to mitigate AGW. In fact most people think the net effect is actually causing more AGW.
Actually the way to mitigate AGW is to increase worldwide meat production by eliminating excess corn and soy for biofuels, and factory farms too. We need more animals on the land not fewer. -
michael sweet at 20:48 PM on 13 August 2019The History of Climate Science
keithwlarson,
The posts at SkS are written by vounteers. It is unlikely that someone will find the time to go back and edit the OP here. You are welcome to submit an OP that describes Eunice Foote's, and others who may have been previously left out, contributions. It is a simple process to submit an OP.
Make sure that you provide references to support all your claims.
-
william5331 at 19:09 PM on 13 August 20192019 SkS Weekly Climate Change & Global Warming Digest #32
A decrease in the nutrient concentration in our major food crops occured as people began to plant the crops developed in the much vaunted 1960's food revoltion. Crop yields shot ahead, some say trippled for some of our grain crops but without a commenserated increase in nutrients. Peasant farmers were saved from starvation for a couple of decades but suffered from nutrient dificiancy as the abandoned their traditional varieties in favor of the new high yielding ones. It is estimated that we now have 700m more people on the earth today due to this agricultural revolution.
https://mtkass.blogspot.com/2009/02/malthus-pyramid-schemes-starvation-and.html
-
eschwarzbach at 19:05 PM on 13 August 2019Skeptical Science New Research for Week #32, 2019
Unfortunately in the New Research for Week #32, 2019 all the articles in Nature Climate Change are erroneously not open access, but behind a paywall.
-
scaddenp at 13:29 PM on 13 August 2019The History of Climate Science
keithwlarson - you will like this blog post then.
-
rt.arnold at 12:17 PM on 13 August 2019Can Land cause Climate Change? (new IPCC report)
Along the line of other commentors, there are many issues that don't seem to be addressed in the IPCC report.
My main concern is that agricultural practices and impacts can vary massively for the same commodity (beef) or even production system (e.g. grazing). Scientists published about "grazing impacts" or even about "impacts from extensive grazing with low stocking density". As a trained Earth Scientist and farmer, I see that farm management is far more complex than "these academics" can imagine. I know very good grazing managers who likely have a net negative emissions from beef production, and many lazy grazers who degrade pasture and soil. Management is all that matters.
So any parts of this study which generically talk about specific land use practices (e.g. "grazing", "cropping", "forestry") can only be over simplistic. Remember: On average, every human has one female breast and one male ball. This statement is both true and nonsense - and is here as a reminder of aggregation errors. One must look at what actually happens microbiologically in the soil, not at what type of product is sold.
As for farming, there is no good or bad product - just good or bad production management. Cows can be good for the climate (though few are), or destructive (as most production is). Same as soybeans. This makes it darn hard to define a "regenerative diet"... unless we start measuring soil carbon impacts, as the Savory Institute is spear-heading.
For me, the IPCC report fails to highlight this management dimension in agricultural land management. This only reflects academic difficulties to quantify soil management efficiency (its easier to look at yields!), especially in the short duration of most projects. -
Philippe Chantreau at 09:31 AM on 13 August 2019Temp record is unreliable
rkcannon,
The abundance of the data is what makes it possible to narrow down the error range. Look it up. As indicated by mods higher the error range for NOAA is +/- 0.15. They have publications that detail their statistical methods and show where these numbers come from.
-
Philippe Chantreau at 09:26 AM on 13 August 2019Nuclear testing is causing global warming
Arnout,
The existence of a "pause" is entirely dependent on choosing 1998 as a start year, so there is in fact no pause, never was. CERN has demonstrated that cosmic rays were not a significant source of cloud seeding. Water vapor is greenhouse gas, there is no such thing as clouds that are gas, clouds are made of liquid or solid water and do not have any greenhouse effect, thay act in other ways. This has been extensively studied, check the litterature before arguing that the science forgot to take something in consideration.
-
rkcannon at 07:00 AM on 13 August 2019Temp record is unreliable
Weslsh I to wonder how such precision of 0.01C has any meaning. Tolerance is probably over 1 degree.
Also I wonder in post 516, the averages of the trend shown between 1900 and 2000 etc and compared with other averages, what do the other graphs look like? Seems there are better ways to compare trends, such as slope. Somewhat of a moving target taking an average of a trend.
Moderator Response:[DB] This is a moderated forum wherein all parties must use credible sources to support claims made. This claim of yours is unsupported and, frankly, wrong:
"I to wonder how such precision of 0.01C has any meaning. Tolerance is probably over 1 degree"Note the error bars in the following image clearly do not support your claims:

-
Arnout at 05:38 AM on 13 August 2019Nuclear testing is causing global warming
Ionic radiation forms clouds, a cloud chamber is a good example to show this. H2O Clouds are by far the most important greenhousegas.
People are debating about the influence of cosmic radiation from the sun, mainly to explain for the global warming pauze.
But what would be the influence of human made ionic radiation? It could explain the increased heating after wwII and the warming pauze at the beginning of the century
Moderator Response:[PS] Welcome to Skeptical Science and please read our commenting policy. In particular, note the ban on sloganeering. If you make a claim about science or what is said, then provide links to back your assertions.
Your comment is also offtopic. Please type "cosmic rays" into the search box on top left to find many articles testing the idea radiation might affect climate (no evidence at all compared to the overwhelming direct evidence that GHG affect climate).
-
keithwlarson at 18:12 PM on 12 August 2019The History of Climate Science
As I am relatively new to this site, I was wondering if you could make it more transparent about the contribution of Eunice Foote, note comments 31 and 32. Sadly as someone interested in the history of climate science I have come across here contribution very late. How about mentioning her specifically in the above story?
-
Eclectic at 13:23 PM on 12 August 2019Models are unreliable
Scaddenp @1148 ,
The Finn language is somewhat of an outlier from the mainstream European languages, so it may well be that an automated translation falls short of clarity. Still, the technical word "asymptotic" is hardly likely to be mis-translated.
Could it be that these two authors are holding on to the Climate Myth of CO2 "saturation" ?
It might explain some of their failure to understand the basic physics of GreenHouse Effect.
-
scaddenp at 12:28 PM on 12 August 2019Models are unreliable
Looks to me like they made no serious attempt to understand the greenhouse effect or even radiative transfer and so in the familiar territory for deniers of attacking a strawman. They are either unaware or have ignored direct measurements of the radiative properties in the atmosphere.
"4) "[The] influence of increase of linear emission coefficient on radiation isn’t progressive but asymptotic." This is gibberish to me. "
Translation is tricky but I am guessing this some acknowledgement of logarithmic relation to CO2 concentration rather linear. In assuming that this is news to physicists, they are demonstating they dont understand it all.
I cant imagine any real physicist spending more than a few minutes looking at this before binning it. If you really want to disprove GHE theory, then your replacement theory has to reproduce the spectra of radiation measured both at top of atmosphere looking down and at the surface looking up as GHG concentrations in the atmoshere change. Current theory matches the observations with exquisite accuracy. (see papers in article here.) Or recent very direct measurement here.
-
Rob Honeycutt at 08:45 AM on 12 August 2019Models are unreliable
Or, here with the following passage...
"Claim 1.5: Carbon dioxide in the atmosphere may increase the thermodynamic mean temperature of the ground by 2.1-4.1°C
According to the claim 1.5 increase of carbon dioxide in the atmosphere causes progressive increase of the global mean temperature of the lower atmosphere (the hockey stick theory). The hockey stick theory proves unfathomable ignorance on radiative heat transfer because influence of increase of linear emission coefficient on radiation isn’t progressive but asymptotic."
Again, maybe it's just the translation but this comes off as word salad.
1) What's the point of continually repeating the phrase "thermodynamic temperature"? Ironically, they state on page 8, "It is undisputable that increase of the thermodynamic mean temperature of the ground (hence forward the Temperature)..." but then continue to use the full phrasing another 30 times over the following 85 pages. In fact, their only use of the term "thermodynamic" comes when they use the full phrase "thermodynamic mean temperature." It's just weird.
2) 2.1-4.1°C isn't "ground temperature" it's surface temperature. Yes, there's a difference because surface includes sea and land, but "ground" would only refer to land. But maybe that's a translation issue.
3) The hockey stick isn't the same as greenhouse gas theory. The hockey stick is merely a graph of the past 1000+ years of global temperature.
4) "[The] influence of increase of linear emission coefficient on radiation isn’t progressive but asymptotic." This is gibberish to me.
-
Rob Honeycutt at 08:25 AM on 12 August 2019Models are unreliable
onhannoita... I'm sure climate scientists everywhere get submissions from all sorts of cranks claiming almost everything under the sun. Most are going to straight to the cylindrical filing cabinet (aka, trash can).
Here's one that should be fairly straight-forward: water vapor.
"Claim 1.4: Water vapor is not a greenhouse gas
The claim 1.4 proves unfathomable ignorance on radiative heat transfer of the thousands of authors of IPCC’s assessment reports. Even though water vapor differs from all other gases of the atmosphere by its thermostatic properties it is by far the “strongest greenhouse gas” of the atmosphere. In the lower atmosphere, mean linear emission coefficient of water vapor is about 27 times the linear emission coefficient of carbon dioxide.
Water is not only by far the “strongest greenhouse gas” but also by far the strongest “greenhouse liquid” and “greenhouse solid”. In the lower atmosphere, sum of the linear emission coefficients of water droplets and particles is at least as large as the linear emission coefficient of water vapor. Everybody knows that during cool nights, when linear emission coefficient of water vapor is small, air temperature may vary up to 10 oC, depending on cloudiness. Because the existing data is deficient, in the calculations of Appendix 4, the Authors have applied minimum realistic estimate of 1 m2/mole for the mean molar emission area of liquid and solid water. Even with this minimum value, water in its three entities dominates fully thermal and solar radiation to the ground and thus the thermodynamic mean temperature of the ground."
As far as I can tell, this is borderline word salad. I mean, "greenhouse liquid" and "greenhouse solid"? It's not even clear to me what they're claiming. Are the claiming the IPCC doesn't consider WV a greenhouse gas? (Which would clearly be wrong.)
-
nigelj at 08:04 AM on 12 August 20192019 SkS Weekly Climate Change & Global Warming News Roundup #32
Regarding the conversion of grasslands to forests, and how much area of grasslands could be converted to forests.
Grasslands are already being converted to forests in places like Brazil here. ironically perhaps. Forests are also naturally replacing grasslands in some places here.Research paper on the conversion of grassland to acacia forest as an effective option for net reduction in greenhouse gas emissions here.
It's difficult to get an idea of how many grasslands could be converted to forests, but its clearly significant in area. But does it make sense? It's a form of natural geoengineering, that will probably have unintended consequences (as in the Brazil example). However taking land originally in forests and converted to grasslands back to forestry looks sustainable.
-
nigelj at 07:28 AM on 12 August 2019The consensus on consensus messaging
I think we all need to push hard to try to get the consensus studies mentioned more in the daily newspaper media and the like. The media might resist this, because it suggests the scientific debate is really largely over, and the media prefer to keep controversies going because it gets people buying their product, but try anyway.
-
nigelj at 07:14 AM on 12 August 20192019 SkS Weekly Climate Change & Global Warming News Roundup #32
RedBaron @4
"Both views ignore the system most efficient at both feeding people, feeding wildlife and sequestering carbon.....Cows, Carbon and Climate"
I don't think I ignored the issue. I mentioned that grasslands cattle farming has some potential to sequester more soil carbon. I sincerely believe it does, just that I don't expect miracles.
The problem is cattle farming is not efficient in terms of resource use and food production, because it requires a huge voume of plants to produce a small volume of meat. However as others point out, a lot of land is only really suitable for cattle grazing. I dont have time to research exactly how much so I'm taking them at their word.
I therefore think my numbers of reducing grasslands cattle farming (including dairy farming) by 25% are probably ball park feasible. It looks plausible that people would reduce meat consumption about 25%, particularly red meat, based on trends were are already seeing especially in younger people, and noting OPOF's numbers on the issue. At a guess, or first appromimation, it looks like about 25% of grasslands might be potentially convertible to forests; clearly there are limits as others have pointed out.
This creates a large continent sized area of land for forests or other land uses, and still leaves vast grasslands that could sequester more carbon. We can have things both ways.
Grasslands might also suit fast growing grasses for a BECCS type of application, however there are many valid criticisms of BECCS.
-
MA Rodger at 06:38 AM on 12 August 2019Models are unreliable
The article linked @1143 runs to ninety-three pages and is the work of a couple of rather old Mechanical Engineering Professors, Pertti Sarkomaa & Seppo Ruotu (whose surname translates as 'Swedish'). Their work in thermodynamics explains their easy use of maths.
At first glance, their modelling does not appear to address the mechanisms of AGW so if they conclude that increased CO2 is not an agent of warming, that would be no surprise. The article is not well presented with presumably some of the problem resulting from language difficulties.
An account of their work more easily understood is presented in a blog on the site that holds the up-load of the article linked @1143. (Its comment thread may be worth examining.) Of course, the blog-page is in Finnish but that is no great barrier in this day & age. The blog runs to 700 words, not an impossible length for an SkS thread. A translation of it runs:-
Professors: The IPCC Climate Hysteria is a religion without logic
Professors Pertti Sarkomaa (Professor of Heat and Flow Technology and Combustion Engineering) and Seppo Ruottu (Professor Emeritus of Technical Thermodynamics) approached the Rural Media and sent their thoughts on the IPCC report, the IPCC Climate Hysteria. In their view, the IPCC's climate change projections are based on completely erroneous calculations.
IPCC calculations are based on climate models
The calculations in the IPCC monitoring reports are based on climate models that use heuristic parameters such as radiation constraint, cloud feedback, and climate sensitivity that have no physical equivalent or objectively correct value and are not known, required, or permitted by the exact laws of flow and thermal dynamics. The use of said heuristic quantities in climate models is in itself a fatal mistake and indicates that their users do not understand flow and thermal dynamics.
The meteorological scientific community recognizes that, despite decades of research, there is no certainty about the hallmark of cloud feedback. Every common sense person understands that even if the sign of a key parameter of a mathematical model is unknown, the results produced by the model are incorrect. Because cloud feedback is a heuristic that has no physical equivalent, there is no objectively correct value that can be determined. The decades-long study of Cloud Feedback is the most incomprehensible blunder in modern science.
Positive cloud feedback values have been used in the calculations accepted by the IPCC so that a staggering increase in carbon dioxide concentration from 300 ppm to 600 ppm, which would not actually occur, would increase the global mean global equilibrium temperature generated by the calculations by 2-5 ℃. Meteorologists call this change in temperature sensitive to climate sensitivity.
With positive cloud returns from calculations approved by the IPCC, the sensitivity of the climate is two to five times the warming of the lower atmosphere caused by the actual increase in atmospheric carbon dioxide from 280 ppm to the present 410 ppm. So climate sensitivity depends entirely on the cloud response you choose.
It follows from Planck's Law and the equation for spectral radiance that the effect of increasing atmospheric carbon dioxide on global temperatures is asymptotic, not progressive. If the atmospheric carbon dioxide concentration were to increase by the next 130 ppm, the effect of the increase on global average temperatures would be smaller than the increase that had already occurred. The climate sensitivity of the IPCC calculations is completely unrealistic.
Clouds are known to reduce the average solar energy flux on the Earth's surface by about 100 W / m2, so negative calculations should have been used instead of positives in calculations approved by the IPCC. Thus, the IPCC's climate change projections are based on completely erroneous calculations. When the effect of carbon dioxide on global average temperatures is calculated in accordance with the laws of flow and thermal dynamics, the effect is found to be insignificant.
We have provided our calculations to leading Finnish meteorological experts and asked them to prove their potential errors. No errors have been addressed. Nonetheless, the meteorologists who have committed themselves to the IPCC claim are categorically dogmatic, ”say Finnish professors Pertti Sarkomaa and Seppo Ruottu.
Carbon dioxide has no effect on global warming
The climate has changed during the Earth's existence and in the future. It is affected by a plurality of randomly variable quantities with their mutual random interconnections.
According to our research, the effect of atmospheric carbon dioxide on surface and ground-level temperature is insignificant, even if the atmospheric carbon dioxide content doubles compared to the present one. The change would be only a few hundredths of a degree Celsius.
According to our understanding, e.g. The IPCC climate models that underlie the Paris Climate Convention and the climate projections and key measures to "save the world" derived from them are both erroneous and illogical.
The efforts of the IPCC to minimize carbon in the natural cycle and the atmosphere and to switch from fossil fuels to electricity and mechanical energy generation to biofuels will lead to a reduction in energy and food production and biodiversity. Long-term adherence to the IPCC's aspirations and recommendations will lead to mankind's disaster as fossil fuels run out over the next 100 years.
Therefore, the remaining fossil fuels should be used in such a way that, when depleted, the Earth's carbon cycle, which sustains life in the world, produces the greatest amount of biodiversity-compatible biomass.
In Lappeenranta 03.08.2019, Best regards. Pertti Sarkomaa Seppo Ruottu - Professori, TKT.
-
Gingerbaker at 06:06 AM on 12 August 20192019 SkS Weekly Climate Change & Global Warming News Roundup #32
The vast majority of American grasslands which are used to graze beef cattle can not be used for anything else, they are too arid, and indeed face desertification by next century. You can not put new forests on them or grow crops there. But you raise beef to 2/3rds to 3/4's of their final weight there, on nothing but grass and rainfall. That is as efficient as agriculture gets.
Meanwhile, in the US, crop ag generates more GHG emissions than the entire livestock industry (which produces a ton of products besides milk and meat). 90% of crop ag is wastage, and a lot of that 'waste' becomes livestock feed. Globally, 86% of what a cow eats in unsuitable for human consumption, and that figure is almost certainly higher in the US.
So, depending on where you live, not eating meat may actually increase your carbon footprint. And the fact remains that meat is likely NOT the issue - the 80%+ of US GHG emissions and ~80% of global emissions are from fossil fuel burning, not livestock.
In any case, livestock ain't going away. But ICE engines and furnaces sure can.
-
onhannoita at 05:30 AM on 12 August 2019Models are unreliable
^ Yep, I know the normal approach in scientific research, peer reviews etc. According to the authors the article has been sent to some well-known climate scientists in Finland but authors have not yet received any response. Will wait and see what happens. The reason to post article here was just to get some comments from readers who understand physical theories presented in article when debunking IPCC claims better than me :-)
-
Rob Honeycutt at 04:45 AM on 12 August 2019Models are unreliable
onhannoita... Wow. Two people with no published research in any climate area have disproven 150 years of scientific research?
I guess that's possible but certainly not very likely. It might be worth a few chuckles to go through their "analysis," if you can call it that.
Just an FYI: a real scientist who thought they'd found an error on any climate topic would write up their research and get it published in a prestigious journal, and then let the broader scientific community hack away at it.
-
onhannoita at 04:05 AM on 12 August 2019Models are unreliable
The following article debunks IPCC claims and their climate models by using physics and math. Interesting but very scientific article. I'm not expert in physics and I would like to hear your comments about the subject.
Climate change and use of fossil fuels
www.maaseutumedia.fi/wp-content/uploads/2019/08/climate_change_and_use_of_fossil_fuels.pdf
-
One Planet Only Forever at 01:36 AM on 12 August 20192019 SkS Weekly Climate Change & Global Warming News Roundup #32
Improving the sustainability of how meat is produced (and how feed for meat is produced) is possible and would be helpful to the future of humanity. And it would be helpful to correct the diets of the 'supposedly most advanced humans setting the example that others aspire to' would also be helpful (like those supposedly more advanced humans setting the example of lower energy consumption, with all their consumed energy being sustainably sourced renewable energy, as the example for all others to aspire to)
There is already a robust, but still improving, understanding of protein needs of humans and the impacts of that human activity (like there is regarding human activity related to climate science).
There are many references for that understanding, but my internet search engine fairly responsibly put this Harvard School of Public Health item near the top of my search "The Nutrition Source -> What Should I Eat -> Protein"
The item states the following summary of research into health related to different sources of protein (about what you are eating along with the protein in the food item you consume) "...eating healthy protein sources like beans, nuts, fish, or poultry in place of red meat and processed meat can lower the risk of several diseases and premature death."
However a major point in the article is that 2 - 4 oz servings of meat provide more than the daily protein for most people (and that is excluding protein obtained from other consumed foods). And other research indicates that eating more than 4 oz of meat in a meal is a waste since a body will only process the protein from 4 oz in a meal. So a significant reduction of meat consumption can be achieved by people limiting their per-meal and total-daily meat consumption to amounts that their body will actually use, further reduced by accounting for the protein they get from other foods they eat like the beans in a chili mix.
Also note that Nuts grow on Trees - leads to thoughts of forests. However, being able to sustain tree growth of food is a function of climate. The current amount of tree based food production in California required an unsustainable over-consumption of water during the recent string of years with low rainfall in summer and low recharge of aquifers. Unlike annual crops that can be allowed to suffer in a severe drought and replanted the next year, trees must be kept alive. And a large amount of aquifer water has been needed to keep the California trees alive through the past several years.
The understanding of the required corrections is well established. The main thing keeping the corrections from being implemented is the power of correction resistant people, people who have developed unsustainable perceptions of success and status in the status quo system and can promote them, and fight against their correction, through the mechanisms explained by Edward S. Herman's Propaganda Model. The type of leadership that recently won power in Brazil, and how they did it, and the termination of the director of the National Institute for Space Research in Brazil for exposing that the New Government policies had resulted in increased Rain Forest cutting (mainly cut to expand beef production), is an example of that damaging power of harmfully correction resistant people.
-
RedBaron at 22:10 PM on 11 August 20192019 SkS Weekly Climate Change & Global Warming News Roundup #32
Both views ignore the system most efficient at both feeding people, feeding wildlife and sequestering carbon.
“Land can’t, at the same time, feed people, and grow trees to be burned for bioenergy, and store carbon,” Stabinsky said.
This quote is true, but it is because fundamentally they are attempting it with the wrong biome. There is clearly no concept of ecosystem services are supply by which.
While you can't do what Stabinsky said, you could use a far more efficient and productive biome (grasslands) to do all that and even more.
-
BaerbelW at 17:25 PM on 11 August 2019The consensus on consensus messaging
Loz73 @10
In Germany, Austria and Switzerland we have Scientists for Future (S4F) who do exactly what you'd like to see in Australia: it started as an organised effort to collect signatures for a statement in support of the Fridays for Future (FfF) movement, corroborating their demands. They managed to get 26,800 signatures within a couple of weeks from a wide variety of scientists and have been visible and vocal in the regular strikes and other activities organised by FfF. They also held a big press conference (in German) to publish their statement which in turn got a lot of press. Currently, S4F helps FfF - if asked - with material for presentations or provides speakers at strikes and other events - it's an impressive if still fledgling effort. Please feel free to touch base via our contact form if you'd like to know more (I'm involved with S4F in Germany).
-
nigelj at 11:57 AM on 11 August 20192019 SkS Weekly Climate Change & Global Warming News Roundup #32
Michael Sweet @2
Good point about cattle feed. I didn't think of that, because we dont rely as much on cattle feed as much some countries. Therefore reducing cattle grazed lands would indeed create a lot of space for forests, in theory.
I'm not so pessimistic about lower meat consumption. Granted most people do prefer a high meat diet, yet in fact several countries have declining meat consumption as below:
worldpreservationfoundation.org/business/meat-in-decline/
theconversation.com/meat-consumption-is-changing-but-its-not-because-of-vegans-112332
Of course there are likely to be limits as to how much people would reduce meat consumption. Lets assume meat consumption could be cut 25% globally, (more in rich countries less in poorer countries), which seems like a plausible number, then according to data on land use that would free up approx 12 million kms2 for forests, all other things being equal. That is approximately the area of Canada which is huge, and would make something like BECCS at large scale feasible and capable of sequestering a big chunk of carbon emissions. Of course it's all idealistic, but far from impossible.
-
Loz73 at 10:45 AM on 11 August 2019The consensus on consensus messaging
In Australia the reason that, “Voters believe that there is no consensus about global warming with the scientific community” (Nigelj) is that no Australian scientist has ever persisted in telling them otherwise. As a retired biological scientist with 10 years of activism in BREAZE (Ballarat Renewable Energy & Zero Emissions) I am in a state of despair. Parts of Australia are in the worst drought in history; the Barrier Reef and the Murray Darling basin are in terminal decline; our Prime Minister fondled a lump of coal in parliament and told us not to be afraid; and neither of the main political parties opposed the giant Adani mine. Virulent attacks on young Swedish activist Greta Thunberg and school strikers here confirm how terrified those on the hard right of politics and media are of the youthful threat but they’re nowhere near terrified enough yet. As the life support systems of all creatures face extinction, though, comment by Australia’s climate scientists continues to be so subdued as to be ineffectual.
Scientists have one last chance of redemption. It doesn't involve the safe pathway of publishing ever more articles in prestigious journals to fine-tune what we already know. Instead, we are suggesting that climate scientist show leadership and join students to form an alliance that cannot be silenced. If we are to avoid the catastrophe of a 2 degree temperature rise we need activism on the scale of the Vietnam era protests, with kids in every school screaming for action and screaming for their parents to support it, and we need to have kids supported by loud and hard evidence from fearless scientists. Now is the time for action and hope. -
michael sweet at 10:22 AM on 11 August 20192019 SkS Weekly Climate Change & Global Warming News Roundup #32
Nigelj,
My understanding is that if people eat less meat that much less land needs to be in cultivation, not more as you suggest. Since less land is in cultivation and less is needed for grazing livestock more can be used for forrests or biofuels.
Currently much of agricultural production of plant type foods like corn and soybeans is fed to animals. If we eat the corn and soybeans instead much less food needs to be produced. You have to feed an animal about 10 pounds of food to get one pound of meat. If you eat the feed you need less farm production because you directly eat the plants the farm grows.
Unfortunately, most people prefer a high meat diet.
-
One Planet Only Forever at 08:42 AM on 11 August 2019Can Land cause Climate Change? (new IPCC report)
The following 'Buisiness-Minded' way of thinking is a general problem that relates to the 'farming practices point' that william raises.
Return On Investment is desired. But discounting the future and having the ability to easily move wealth to other investment opportunities around the world leads to thinking that a good business opportunity is one where:
- the initial investment will be paid back within 3 years
- and the business will continue for about 10 years.
- Anything beyond 10 years is a bonus.
- And the business collapsing at 10 years is OK as long as there are ot end costs that cannot be minimized by things like bankrupcy protection that limit the loses. The money made can be invested in a new 'Best Investment Opportunity'.
The quest for those opportunities leads to the challenges that result in the industrial take-over of farmland that has no real future, but looks great on the balance sheet of today.
DIscounting the future combined with desires for maximum quickest personal gain is unsustainable and disaster creating.
Prev 220 221 222 223 224 225 226 227 228 229 230 231 232 233 234 235 Next


