


 Arguments


Recent Comments
Prev 2318 2319 2320 2321 2322 2323 2324 2325 2326 2327 2328 2329 2330 2331 2332 2333 Next
Comments 116251 to 116300:
-
Baa Humbug at 03:24 AM on 30 June 2010What causes the tropospheric hot spot?
Thanks Peter Short time series? How short? What is it's significance? The label says temperature trend. Trend since when? How does this relate to surface warming? These charts show warming of about 0.2-0.4. Not quite 2 to 2.5 times the surface warming. -
Peter Hogarth at 03:15 AM on 30 June 2010What causes the tropospheric hot spot?
Baa Humbug at 02:26 AM on 30 June, 2010 “So, what tropospheric warming and what stratospheric cooling? So far they only exist in the models”. This is from the AMSU satellite sensor so is a shorter time series. I have similar images for RSS and UAH which show more warming (since 1979), but I think the RSS one is even on Wikipedia.
-
HumanityRules at 02:58 AM on 30 June 2010Return to the Himalayas
I don't know where you live Doug but Western Europe has 'controlled' and reshaped every major river system in the region. And yet the earth continues to turn and the sun continues to rise. Those opposed to dams and the like need to realise we could be denying developing nations the benefits that have come with this successful Western European experiment. -
Peter Hogarth at 02:48 AM on 30 June 2010Astronomical cycles
Ken Lambert at 00:32 AM on 30 June, 2010 Are you looking at the image or the actual data? From JASON 1 data 2002 up to end 2009 I get a trend of 2.61 mm/year, inverse barometer applied, seasonal signals retained. Adding GIA corrections would add another 0.4mm (current estimate) as in the chart you refer to. JASON 2 has obviously not had enough time (2 years) to develop a meaningful trend of its own as yet but the high accuracy and successful calibration means that the data points can be added to the overall picture. I suspect this is what the final points are on the Colorado chart (ie Jason 2) but I will check. Envisat has been going since 2002 as with Jason 1, and TOPEX continues through to end 2005 so there is overlap rather than the step transition you imply. There are also a couple of other satellite altimeters which add to our knowledge. The chart I presented has an unweighted composite of all data, but you can check on several official sites for similar charts. I haven't looked at the data for a couple of months, I'll check and let you know if I find any surprises. -
Steven Sullivan at 02:46 AM on 30 June 2010How many climate scientists are climate skeptics?
omnilogos fudges a bit: "And what have you been reading at RealClimate? How about this: "we note that once the categorization goes beyond a self-declared policy position, one is on very thin ice because the danger of ‘guilt by association’. For instance, one of us (Eric) feels more strongly that some of Prall’s classifications in his dataset cross a line" I say, even the guys at RealClimate could see the "methodological issues" " I saw what you did there. *One* of the two authors of that article at RealClimate (Eric Steig) is on record as having issues with the paper (though from the looks of this article *he co-signed), he's dialed waaaaay back from being 'appalled'). Gavin Schmidt, not so much, apparently. The rest of the 'guys' at RC haven't chimed in. And of course, if you read the *whole* RC article, not just the sentence that looks most condemnatory, you'll get a different picture of what the 'RC guys' think of it, compared to what omnilogos claims. And of course, both 'guys' sign on to the fact that there really is a consensus: "They are misleading because as anyone with any familiarity with the field knows, the basic consensus is almost universally accepted. That is, the planet is warming, that human activities are contributing to the greenhouse gases in the atmosphere (chiefly, but not exclusively CO2), that these changes are playing a big role in the current warming, and thus, further increases in the levels of GHGs in the atmosphere are very likely to cause further warming which could have serious impacts. " All the angry buzzing of skeptic wasps over this paper, just shows how threatening scientific consensus is to them. Their 'successes' are occurring almost entirely in the public relations, not scientific, domains. Historically this isn't tenable; science will out. -
Doug Bostrom at 02:42 AM on 30 June 2010Return to the Himalayas
Thanks for the pointer to the paper, HR. More refinement with cautious conclusions. For me the takeaway on was that future behavior of monsoons is going to be a key determinant of how stable the region remains for cultivation, more so for those areas where solid-state storage counts and diminishes, and we need to understand monsoons better. W/regard to engineered structures they can certainly help but for me to the extent we can avoid stressing both nature and ourselves by avoiding the need to create dams and the like the better. I'm personally a fan of dams but we've sometimes been pretty thoughtless about where they're implemented and of course they cost money. As well, they sit in a nest of complications when transnational rivers are involved. For a truly astonishing example of engineered responses to climate change see this example: Chinese engineers propose world's biggest hydro-electric project in Tibet Comes with strings attached, because nothing's simple in the hands of us humans. China-India history, new dams across upper reaches of Brahmaputra, rationality about net effects downstream may well take a back seat to festering wounded feelings. -
barry1487 at 02:32 AM on 30 June 2010Perth forum on climate change: all the gory details
Simply point out that for it to be true global mean temperature would have to have remained at least the same since the MWP for the entire ocean to have warmed and reached a new, warmer equilibrium. The problem with this fantasy is the Little Ice Age.
Ha! I mentioned that too, in times past, but the rejoinder was that the lag will produce the same curve in CO2 as temps, just 800 years later. So CO2 will go down pretty soon, matching the downturn to LIA 800 years later. If you try to say that sustained warm temps are required, they will hit you with a handful of wiki graphs showing temps going up and down during deglaciation. When you try to point out the time scale of events, you will be informed that the resolution just isn't that good for ice ages. After that, most likely the discussion will descend to the political or personal. -
Baa Humbug at 02:26 AM on 30 June 2010What causes the tropospheric hot spot?
David #48 Thankyou for the reply I don't wish to argue anything, but I do wish to understand better. I'm personally not interested whether the IPCC has worded this well or not. The fact remains that if the surface has warmed, then the troposphere should have warmed by 2 to 2.5 times as much. Between satellites and radisondes this amount of warming should have been detected. It hasn't been. When you say "if the hot spot has not been found, I'd have to argue one of the 3 options you propose", I would contend that I don't have to argue any of that. It's the proponents of the hot spot (the IPCC) who have to argue one of those 3 options. Afterall, it is they who promoted the hot spot, anthropogenic or not. And they felt it was important enough to not only discuss in chp 9 but also in the faq's along with this in the synthesis report... "The observed pattern of tropospheric warming and stratospheric cooling is very likely due to the combined influences of GHG increases and stratospheric ozone depletion". (page 39) So, what tropospheric warming and what stratospheric cooling? So far they only exist in the models. The IPCC is quite clear in the passages that I cited. It is not the affect of warming that's distinguishable, it's the response to the warming. i.e. a troposphere that warms by 2 to 2.5 times that of the surface accompanied by a cooling stratosphere. Also, as much as I appreciate the charts you have posted, the AR4 makes it clear that the sun has had negligable affect on climate in the 2nd half of the 20thC, therefore, if a hot spot was to be detected, (along with a cooling stratosphere) it can only be a response to CO2 forcing, no? -
barry1487 at 02:23 AM on 30 June 2010Perth forum on climate change: all the gory details
My favourite skeptic argument of the evening was a new one to me (and I thought I'd heard them all). One audience member asked Malcolm if CO2 lagged temperature rise by 800 years, wasn't the current CO2 rise just a lagged response to the Medieval Warm Period?
I've come across this one a few times. My reply, FWIW as a layman, was that the lag started at ~800 years, but it was another 4k years before the atmospheric concentration of CO2 increased by 100 ppm. We've had an increase of 100 ppm in 100 years (carbon sinks accommodating excess anthropegenic CO2 up until around the end of the 19th century). This is a rate 40 times faster than ice age carbon cycles - or 20 times faster if we take the start point of modern CO2 rise as the beginning of the industrial revolution. Also, the 100ppm rise accompanied a global temp change of 5 - 6C through deglaciation. The MWP temp rise, at skeptics' highest posit, was less than half that. Therefore, the MWP can only have made a tiny contribution to post-industrial CO2 concentration in the atmosphere, if any. Please, correct any errors in my assumptions or reckoning. The objection is not common and I had only my probably faulty memory of the reams of stuff I've read hither and yon. -
Jim Eager at 02:16 AM on 30 June 2010Perth forum on climate change: all the gory details
John Cook, the "CO2 rise is just a lagged response to the Medieval Warm Period" argument is not at all uncommon, and it is rather easy to counter. Simply point out that for it to be true global mean temperature would have to have remained at least the same since the MWP for the entire ocean to have warmed and reached a new, warmer equilibrium. The problem with this fantasy is the Little Ice Age. This is another example of one "sceptic" argument that is contradicted by another. I've actually successfully stopped a hard-core "sceptic" cold by pointing this contradiction out to him, much to my own surprise. -
JMurphy at 01:55 AM on 30 June 2010Abraham reply to Monckton
AWoL, please provide more information as to your views on Venus - briefly, if you can. Also, with regard to us on this planet, you seem to have forgotten about : Population totals and density, National borders, The slowness of geological time as opposed to the quickness of present climate change, The recent credit crunch, The nonsense of skeptical arguments, and The rise and fall of civilisations. Aside from all that, erm, you have nothing new to add except wishful thinking. See further on this very website.Moderator Response: JMurphy is correct that other posts on this site are appropriate for AWoL's comments and for responses by other people. That conversation is diluting this thread, so further off topic comments will be deleted. Remember that you can see recent comments on all threads at once, by clicking the "Recent Comments" link in the blue horizontal bar at the top of every page on this site. Lots of people watch that page, so you need not worry about people missing your comment even if it is on a different thread than this one. -
David Grocott at 01:45 AM on 30 June 2010What causes the tropospheric hot spot?
Yes Albatross, I've now corrected it, thanks. Damn my frazzled brain. -
David Grocott at 01:44 AM on 30 June 2010What causes the tropospheric hot spot?
There was a documentary on the BBC last night called "Panorama: What's Up With the Weather?" In it Bjorn Lomborg and Prof. John Christy both happily accepted that CO2 has an effect on global temperatures. See here and here. Perhaps Nova's crowd will listen to them? -
Albatross at 01:40 AM on 30 June 2010What causes the tropospheric hot spot?
David and Peter, Thank you both for your very informative posts. David, in your post at #48, shouldn't the lower figure be for 2xCO2, and the top figure for 2% increase in solar forcing? -
Ned at 01:39 AM on 30 June 2010Temp record is unreliable
If anyone is uncertain about what to make of the conflicting claims from BP and me, please do the following: (1) Go here and download the spreadsheet that Zeke Hausfather compiled, showing annual global temperature reconstructions from many different analyses by many different people. The data are described in Zeke's post here. (2) Click on the tab labeled "Land Temp Reconstructions". If you want to see the effects of the GHCN adjustment, select columns A (year), E (v2.mean) and F (v2.mean_adj). (3) To see the effect of the adjustment, subtract column E from column F. To determine the trend in this adjustment over any period of time (like BP's weird choice of 1934-1994) select that range of years and fit a linear model to the differences, as a function of year (and multiply the slope by 100 to convert from degrees C/year to degrees C/century). For 1934-1994 the slope is 0.19 C/century. As stated above, over the past 30 years the adjustments have actually reduced the trend (slope -0.48 C/century). Contrary to what BP claims, it's really important to use some form of spatial weighting (e.g., gridding) when doing this, because the stations are not uniformly distributed. Taking a simple average would only be appropriate if there were no spatial autocorrelation in the adjustments. Given that stations in different countries have been administered differently, this seems like an extremely unlikely assumption. BP's claim that "more complicated" (that is, more correct) methods don't show the temporal evolution of adjustments is likewise inexplicable. All of the reconstructions produce annual temperature estimates. -
John Russell at 01:38 AM on 30 June 2010Perth forum on climate change: all the gory details
When the RTR FM interviewer asked you what you thought was "the most convincing skeptic argument", it was of course because -- being a journalist -- he had got completely the wrong end of the stick about what you represented, John. Did they take a poll at the end to ascertain how many people had been persuaded by what they had heard?Response: No, he got me, he started the segment saying "today we're going to get skeptical about global warming skepticism". I thought, hey that sounds catchy, then remembered that was the slogan at the top of the Skeptical Science website. It was just a clever question, I'm still undecided on what's the best answer (I went with using photos to cast doubt on the surface temperature record as pictures are so persuasive, then pointed out what that's irrelevant from a scientific point of view). -
Tom Dayton at 01:33 AM on 30 June 2010Abraham reply to Monckton
No, AWoL, there is not "a lot of controversy over the workings of the Venusian atmosphere." Perhaps you've been misled by the artificial controversy sparked by Goddard and Motl, and addressed in multiple places such as at Chris Colose's place. -
Rob Honeycutt at 01:31 AM on 30 June 2010What causes the tropospheric hot spot?
fydijkstra... I've not read enough of JoNova's post to comment on whether she rejects the basic theories behind AGW but the crowd who posts on her site most certainly does. I spent about two days posting on her site and was barraged with people telling me, in no uncertain terms, that CO2 has absolutely no affect on global temperature or climate. Arrhenius was wrong. When I posted a video of a simple lab experiment using a cylinder filled with CO2 and an infrared camera, it was brushed off as a trick. JoNova may not agree with that position but she, and a small handful of people who certainly know better, are not making even the slightest attempt to correct their errors. -
David Grocott at 01:17 AM on 30 June 2010What causes the tropospheric hot spot?
Baa Humbug, This is a difficult topic and unfortunately pages 674 and 675 of AR4 Chapter 9 are causing a great deal of confusion - although that's not to say they're wrong. You quote from the FAQs document, page 120 - 121. I repeat:Models and observations also both show warming in the lower part of the atmosphere (the troposphere) and cooling higher up in the stratosphere. This is another ‘fingerprint’ of change that reveals the effect of human influence on the climate. If, for example, an increase in solar output had been responsible for the recent climate warming, both the troposphere and the stratosphere would have warmed.
The quote above says that an increase in solar output, and anthropogenic contributions, should both result in a warming of the troposphere. As your quote testifies, this agrees with observations. It also says that anthropogenic contributions, but not an increase in solar output, should result in a cooling stratosphere. Once again, this prediction agrees with observations. The human 'fingerprint of change' to which the IPCC refers is not a warming troposphere alone (which could be induced by changes in solar output), but a warming troposphere combined with a cooling stratosphere. Your second quote is necessarily taken out of context, but in the process loses some of its intended meaning. The loss of meaning is exaggerated by the fact that it was poorly and ambiguously worded in the first place. The charts accompanying the quote (which are shown in Figure 1 of John's article) are labelled as follows:Figure 9.1. Zonal mean atmospheric temperature change from 1890 to 1999 (°C per century) as simulated by the PCM model from (a) solar forcing, (b) volcanoes, (c) wellmixed greenhouse gases, (d) tropospheric and stratospheric ozone changes, (e) direct sulphate aerosol forcing and (f) the sum of all forcings. Plot is from 1,000 hPa to 10 hPa(shown on left scale) and from 0 km to 30 km (shown on right). See Appendix 9.C for additional information. Based on Santer et al. (2003a).
That is to say that the charts model zonal mean atmospheric temperature change from 1890 to 1999, and assign varying proportions of this change to different forcings. The fact that since 1890 the largest forcing by far has been well-mixed greenhouse gases - or at least that's the 'assumption' the IPCC has based its model on - means (a), and also (f) - the sum of all forcings - show the most prominent hot spot. None of the other forcings have been sufficient in the last 100 years to create a hot spot of similar magnitude. As I pointed out at #2, non-CO2 forcings have been small, so the tropospheric response has been small. Figure 9.1a is not, I repeat not, a demonstration of the possible zonal mean atmospheric temperature changes associated with different forcings. It is merely a modelled image of changes over the last 100 or so years. The wording of the IPCC quote you provided is therefore very poor. It perhaps should have read "The simulated responses to natural forcing [over the last 100 years] have been distinct from those due to the anthropogenic forcings described above". If we run the GISS model equilibrium with 2xCO2 or a 2% increase in solar forcing (forcings in the same order of magnitude) we get the following pattern of zonal atmospheric temperatures: For 2% increase in solar forcing For 2xCO2
 As you can see, the main difference occurs in the cooling stratosphere, but the tropospheric hot spot is clearly evident in both.
You can also see this pattern in picture (a) on the charts you referred to, however, as a result of the lower levels of solar forcing the pattern is not as pronounced.
So to clarify, any warming of a sufficient magnitide should be expected to create a tropospheric hot spot.
If you then wish to propose that the hot spot has not been found, you have to argue for one of the three conclusions I highlight in #46.
By the sounds of it you'd like to argue point 3) - that there is in fact much less warming than our measurements tell us there is. In which case I refer you to 'Are surface temperature records reliable?'
Moderator Response:
As you can see, the main difference occurs in the cooling stratosphere, but the tropospheric hot spot is clearly evident in both.
You can also see this pattern in picture (a) on the charts you referred to, however, as a result of the lower levels of solar forcing the pattern is not as pronounced.
So to clarify, any warming of a sufficient magnitide should be expected to create a tropospheric hot spot.
If you then wish to propose that the hot spot has not been found, you have to argue for one of the three conclusions I highlight in #46.
By the sounds of it you'd like to argue point 3) - that there is in fact much less warming than our measurements tell us there is. In which case I refer you to 'Are surface temperature records reliable?'
Moderator Response:
I'd like to correct this post slightly, as I think part of it is misleading.
As 'andrew adams' and 'e' have alluded to, the wording of the IPCC quote is not in fact 'poor'. That adjective can be reserved for my interpretational ability.
The following quote is in fact perfectly accurate as it refers to the general pattern of warming troposphere/ cooling stratosphere, as opposed to the existence of a tropospheric hot spot, which is a seperate phenomenon:The simulated responses to natural forcing are distinct from those due to the anthropogenic forcings described above.
The confusion comes because it links to a set of charts which, by necessity, show the tropospheric hotspot in addition to the general pattern of tropospheric warming/ stratospheric cooling.
David -
AWoL at 01:10 AM on 30 June 2010Abraham reply to Monckton
scaddenp has given an answer of sorts,but I have to say I'm not entirely satisfied. The Venus comparison is no good as there is a lot of controversy over the workings of the Venusian atmosphere.Most agree that it is not comparable to Earth, and in fact the greenhouse effect of CO2 plays but a small part in explaining the high surface and atmospheric temperatures on that planet. Regarding the consequences of the overheated planet which you envision. Why all the doom and gloom? In the deltas that you mention, could not the farmland, assumimng that there is any, be replaced with fish-farming and shellfish production? People could live on man-made islands as have been constructed in Dubai.In Japan and Hong kong hasn't there been considerable land reclamation? Then there's the Dutch and their dykes.Isn't nature herself lending a hand in the creation of new land ie the Surtseys and the Icelandic Westmann Islands. Isn't isostatic rebound still underway from the last ice age? Or has that come to a stop? With regard to agricultural production, I can't help feel that you are miles off the beam. Wasn't it Herschel the astronomer, that correlated increased sunspot activity with lower grain prices? Everything starts from plants. What's good for plants is good for animals which is good for people.Plants like the heat,given adequate water, and they positively love CO2. Where you, scaddenp,see doom and disaster, I see formerly barren territories transformed into luxuriant swards and dense woodlands, inhabited by contented happy people. That's the bit I don't get. Why is climate change, ie getting hotter, always accompanied by doom and disaster,when if anything, it is more likely to be accompanied by happiness and prosperity? Any changes are not going to happen overnight, so there's plenty of time to react.And never before have people been able to move so rapidly, and easily establish new settlements, thanks to the extra power to their elbow of readily combustible,energy-dense hydrocarbons.Markets and the intiative of adaptable people will solve any problems far more effectively than any number of governmental organisations. The Sahara was once green. There was no UN in those days.The people didn't die, but moved, adapted and went forth and multiplied......and very good at multiplication they were ..... a bit too good, for their own good, I sometimes think. -
Ken Lambert at 00:32 AM on 30 June 2010Astronomical cycles
Chris#106 kdkd#108 Well no, Chris. The core of CO2GHG theory is a simple IPCC equation: F.CO2 = 5.35ln(CO2b/CO2a)W/sq.m where CO2a is the pre-indistrial CO2 concentration (280ppmv)and CO2b is the current concentration. This is logarithmic and monotonic. Every year the radiative energy flux imbalance F.CO2 increases with CO2 concentration. The argument that global 'noise' seriously distorts this heat accumulation assumes some sort of storage mechanism (where else but the oceans?), which can store heat and release it in noisy bursts globally. OHC in the top 700m has been flat for 6 years. Seems inconsistent with anything but a flattening sea level. Peter Hogarth #107 Had a good look at "Visual Depictions of Sea level Rise" and links from March10. Please explain the trend lines for the deployment of Jason 2 and Envisat. I am seeing Jason 1 with a linear trend for the last 8 years of about 2.1mm/year and an offset of 4-6mm at the start of the TOPEX-Jason transition in 2002 from here: http://sealevel.colorado.edu/current/sl_ib_ns_global.jpg -
JMurphy at 00:12 AM on 30 June 2010September 2010 Arctic Ice Extent Handicapping Via ARCUS
Arkadiusz Semczyszak wrote : "I recommend the latest post from Steven Goddard 28/06/1910 (WUWT)..." That's funny, but I recommend his post of 26 June (Latest Barrow Ice Breakup On Record?). There are many people on there showing him the error of his ways. The day after Steven Goddard wrote that post, hoping for the latest coast ice break up in Barrow, the ice vanished from the beach. Have a look at it now. Perhaps he was confused because the picture he shows has Barrow shrouded in mist : he couldn't see the ice but just assumed (hoped/prayed) it was there. It actually looks as if the ice broke off the day before Goddard wrote his post. Join in the laughter at Deltoid -
HumanityRules at 00:01 AM on 30 June 2010Return to the Himalayas
"It's easy to dismiss the loss of ten percent of a region's water supply as insignificant in the grand scheme of things, but imagine proposing to an engineer responsible for the operation of a municipal water district that ten percent of his reservoir capacity was to be removed for no reason but an anticipated accident that might be avoided." I'm not accusing you of anything here Doug but there seems buried in this comment one of the bigger problems of developing nation. They are more susceptible to the variations that nature can throw at them no matter what the underlying reason. One way to mitigate any future water shortages might be for these nations to produce more water engineers and take control of their water supplies. It's ironic dam projects in China and India, which might help these nations gain better control of this resource have often been criticized by the environmental lobby. On a more general point. It does seem the problem with this science is now it is expected to give more black and white answers to problem thrown at it by policy and politics were in fact the situation is more grey. Maybe New Scientist is pandering to much to this rather than remaining firmly buried in the science. -
Berényi Péter at 23:54 PM on 29 June 2010Temp record is unreliable
#73 Ned at 21:52 PM on 29 June, 2010 Here's a comparison of the gridded global land temperature trend, showing the negligible difference between GHCN raw and adjusted data What you call negligible is in fact a 0.35°C difference between adjustments for 1934 and 1994 in your graph. If it is based on Zeke Hausfather, then it's his assessment. Now, 0.35°C in sixty years makes a 0.58°C/century boost for that period. Hardly negligible. It is actually twice as much as the adjustment trend I have calculated above (0.26°C in ninety years, 0.29°C/century). About the same order of magnitude effect is seen for USHCN. It is 0.56°F (0.31°C) difference between 1934 and 1994, which makes a 0.52°C/century increase in trend for this period.
Therefore, if anything, my calculation was rather conservative relative to more careful calculations. It should also be clear it has nothing to do with the grid, so stop repeating that, please.
What is not shown by more complicated approaches is the curious temporal pattern of adjustments to primary data (because they tend to blur it).
Finally dear Ned, would you be so kind as to understand first what is said, then you may post a reply.
It is 0.56°F (0.31°C) difference between 1934 and 1994, which makes a 0.52°C/century increase in trend for this period.
Therefore, if anything, my calculation was rather conservative relative to more careful calculations. It should also be clear it has nothing to do with the grid, so stop repeating that, please.
What is not shown by more complicated approaches is the curious temporal pattern of adjustments to primary data (because they tend to blur it).
Finally dear Ned, would you be so kind as to understand first what is said, then you may post a reply.
-
Baa Humbug at 23:52 PM on 29 June 2010What causes the tropospheric hot spot?
Some commenters here are posing the question "would we see a hot spot if the warming was caused by solar output". I'm happy to let the IPCC AR4 answer that. From the FAQ’s document, page 120-121.. Models and observations also both show warming in the lower part of the atmosphere (the troposphere) and cooling higher up in the stratosphere. This is another ‘fingerprint’ of change that reveals the effect of human influence on the climate. If, for example, an increase in solar output had been responsible for the recent climate warming, both the troposphere and the stratosphere would have warmed. And from page 674 of Chapter 9 WG1 The simulated responses to natural forcing are distinct from those due to the anthropogenic forcings described above. Solar forcing results in a general warming of the atmosphere (Figure 9.1a) with a pattern of surface warming that is similar to that expected from greenhouse gas warming, but in contrast to the response to greenhouse warming" The charts regarding this hot spot are on the same page in the report, that is, the charts back-up what the report says. And it says that due to anthropogenic warming, there SHOULD be a hot spot that is about 2 to 2.5 times greater than the surface warming. If the surface has warmed by 0.7DegC then the hot spot should have warmed by 1.4 to 1.74DegC Surely large enough to detect. If however the hot spot hasn't warmed enough to detect, then the surface couldn't have warmed by 0.7DegC. One or the other, can't be both. Discuss -
Peter Hogarth at 23:50 PM on 29 June 2010September 2010 Arctic Ice Extent Handicapping Via ARCUS
Arkadiusz Semczyszak at 22:26 PM on 29 June, 2010 Goddard states: "You will also note that most of the world’s sea ice is located in the Antarctic" Antarctic: around 19 Million square km max extent at approx 0.87m thick average. Arctic: around 15 million square km max extent (limited by surrounding land masses) at average approx 2m thick. Which has more sea ice (at least for now)? I'll dig out references as this is from memory, but about right. I'll read the next paragraph now... -
johnd at 23:44 PM on 29 June 2010Abraham reply to Monckton
scaddenp at 08:14 AM, whilst the climate might be described as "stable", agriculture generally has continually had to deal with rapid climate change forcing farmers and all manner of farmed animals and plants to adapt quite rapidly. This is not by virtue of extreme changes in the weather, but by migration. Animals that had developed over generations under one set of climatic conditions, either gradually or suddenly find themselves in areas where conditions are totally different. Dairy cattle bred for the cold wet conditions of England or Europe find themselves being milked in a somewhat drier Australia for example or in a decidedly hotter tropical Asia. The Australian fine wool industry was largely built on sheep with origins in the dry and arid areas of northern Africa, then from the plains of Spain, within a few decades they adapted to the colder wetter conditions of southern Australia. These days with modern transportation, both for domestic movement and international, animals often have to adapt from one extreme to another very quickly. The limitation seems to be not so much of animals from colder wetter areas adapting to warmer drier conditions, but the reverse. Even with grain crops, they too have migrated, but here technology in the form of genetic modification, and breakthrough cultivation practices has allowed production to occur and increase in areas previously considered unviable. The changes that have occurred within ones lifetime would only have been imagined by those of the previous generation who had both imagination and vision, and choose to try and overcome what others saw as impossible obstacles. That is one thing that remains unchanged today. -
David Grocott at 23:01 PM on 29 June 2010What causes the tropospheric hot spot?
fydijkstra, You commend John for stating that "The hot spot is not a unique greenhouse signature", and then assert that not finding it must mean "that the greenhouse signature is weaker than most AGW advocates think". Actually, if we accept the large caveat that the hot spot hasn't yet been found (see Santer 2008 amongst others), we can conclude one of three things: 1) Our measurements have not been accurate enough; 2) The models that predict the tropospheric hot spot in response to warming are wrong; 3) There is in fact much less warming than our measurements tell us there is. Number one is not popular with the 'sceptics', which leaves numbers two and three. If we go with number two we have to accept that the laws of physics are wrong (at least that's my understanding - I'm not a modeller), and if we go with number three we have to accept that all of our surface and satellite measurements are wrong. Both of these arguments are difficult to make. As I pointed out at #17, the fact that the hot spot is not a unique greenhouse signature means that its perceived absence would have far wider ramifications than simply saying humans aren't causing global warming. In light of that, I find it far more conceivable to conclude that the hot spot has in fact been found (see Santer 2008), than that all of our surface and satellite temperature measurements are wrong, or that the laws of physics need revising. If the hot spot was unique to the greenhouse signature the 'sceptics' would have a much easier job. -
Arkadiusz Semczyszak at 22:26 PM on 29 June 2010September 2010 Arctic Ice Extent Handicapping Via ARCUS
I recommend the latest post from Steven Goddard 28/06/1910 (WUWT) - for me it is very comprehensive and shows that the Arctic ice surface is not what so fascinated. For me, the most effective there is this quote: The New York Times, 1969: "From the 9th century to the 13th century almost no ice was reported there. This was the period- of Norse colonization of' Iceland and Greenland. Then, conditions worsened and the Norse colonies declined. After the Little Ice Age of 1650 to 1840 the ice began to vanish near Iceland and had almost disappeared when the trend re versed, disastrously crippling Icelandic fisheries last year." At SH (http://arctic.atmos.uiuc.edu/cryosphere/IMAGES/seaice.anomaly.antarctic.png) the record probably will fall (as they say the forecast) but otherwise ... -
Ned at 22:24 PM on 29 June 2010Temp record is unreliable
BP writes: I have not written proper software either just used quick-and-dirty oneliners in a terminal window. Maybe you should stop making allegations of fraud based on "quick and dirty oneliners"? Especially on a topic where many people have invested huge amounts of their own time on far more sophisticated analyses? -
Ned at 22:18 PM on 29 June 2010Temp record is unreliable
In my comment above, the link associated with the phrase "many people have looked into this in vastly more detail than BP" is sub-optimal. The link there is to a cached page at google, when it should be to Zeke Hausfather's comparison of GHCN analyses. -
Berényi Péter at 22:11 PM on 29 June 2010Temp record is unreliable
#67 doug_bostrom at 12:44 PM on 29 June, 2010 how about explicitly publishing your (admittedly simple sounding but I'm a simpleton) arithmetic method you're using to produce your datapoints? Listen, I think the description of the procedure followed is clear enough, anyone can replicate it. I am not into "publishing" either, it not my job. It is not science proper. That would require far more resources and time. I am just trying to show you the gaps where PhD candidates could find their treasure. The trails can be followed, and if anyone is concerned about it, things I write here are published under the GNU Free Documentation License. I have not written proper software either just used quick-and-dirty oneliners in a terminal window. Anyway, here you go. This is what I did for USHCN as recovered from the .bash_history file.[Oops. Pressed the wrong button first] $ wget ftp://ftp.ncdc.noaa.gov/pub/data/ghcn/v2/v2.mean* $ grep '^425' v2.mean > ushcn.mean $ grep '^425' v2.mean_adj > ushcn.adj $ cat ushcn.mean|perl -e 'while (<>) {chomp; $id=substr($_,0,12); $y=substr($_,12,4); for ($m=1;$m<=12;$m++) {$t=substr($_,11+5*$m,5); printf "%s_%s_%02u %5d\n",$id,$y,$m,$t;} }'|grep -v ' [-]9999$' > ushcn.mean_monthly $ cat ushcn.adj|perl -e 'while (<>) {chomp; $id=substr($_,0,12); $y=substr($_,12,4); for ($m=1;$m<=12;$m++) {$t=substr($_,11+5*$m,5); printf "%s_%s_%02u %5d\n",$id,$y,$m,$t;} }'|grep -v ' [-]9999$' > ushcn.adj_monthly $ cut -c-20 ushcn.mean_monthly | sort > ushcn.mean_monthly_id $ cut -c-20 ushcn.adj_monthly | sort > ushcn.adj_monthly_id $ uniq -d ushcn.mean_monthly_id $ uniq -d ushcn.adj_monthly_id $ sort ushcn.mean_monthly_id ushcn.adj_monthly_id | uniq -d > ushcn.common_monthly_id $ (sed -e 's/^/0 /g' ushcn.mean_monthly; sed -e 's/^/1 /g' ushcn.adj_monthly; sed -e 's/^/2 /g' ushcn.common_monthly_id;)|sort +1 -2 +0 -1 > ushcn.composite_list $ sed -e 's/ */ /g' ushcn.composite_list|perl -e 'while (<>) {chomp; ($i,$id,$t)=split; if ($i==2 && $id eq $iid && $id eq $iiid) {$d=$tt-$ttt; printf "%s %d\n",$id,$d;} $iiid=$iid; $iid=$id; $ttt=$tt; $tt=$t;}' > ushcn.adjustments_monthly_by_station $ sed -e 's/^............_//g' -e 's/_.. / /g' ushcn.adjustments_monthly_by_station | sort > ushcn.adjustments_annual_list $ echo '#' >> ushcn.adjustments_annual_list $ cat ushcn.adjustments_annual_list | perl -e 'while (<>) {chomp; ($d,$t)=split; if ($d ne $dd && $dd ne "") {$x/=$n*10; printf "%s\t%.3f\n",$dd,$x; $n=0; $x=0;} $n++; $x+=$t; $dd=$d;}' > ushcn.adjustments_annual.txt $ openoffice -calc ushcn.adjustments_annual.txt -
fydijkstra at 22:00 PM on 29 June 2010What causes the tropospheric hot spot?
The hot spot is not a unique greenhouse signature and finding the hot spot doen't prove that humans are causing global warming. That's true, John. The hot spot may be caused by more than one phenomenon. But what does not finding the hotspot mean? That means at least, that the greenhouse signature is weaker than most AGW advocates think. And that is exactly what Jo Nova is telling us. Climate sceptics do not deny the fundemental physics underlying the AGW-theory. Their message is: (1) global warming is less then we are told, (2) the warming is less caused by the greenhouse effect then we are told and (3) the catastrophic effects of the warming are les then we are told. The problems that John Cook and others have with identifying the hot spot confirm the second point of the sceptic views. -
Ned at 21:52 PM on 29 June 2010Temp record is unreliable
How depressing. In post #62 BP makes a whole series of very specific claims about the satellite temperature record, all of which are stated as factual with no qualifiers or caveats. Then, two posts later in #64, he casually mentions that those earlier statements were actually "just a guess, I have not looked into the issue deeply enough, yet." Then, to compound this, BP proceeds to claim to have discovered evidence of "tampering" (his own word) with the GHCN data set, based on comparing the raw and adjusted GHCN data sets using a naive unspatial averaging of all station data. I have pointed out to BP previously that you cannot compare the results of a simple global average of all stations to the gridded global temperature data sets because the stations are not distributed uniformly. Given that many people have looked into this in vastly more detail than BP, and have done it right instead of doing it wrong, I cannot fathom why BP thinks his analysis adds any value, let alone why it would justify sweeping claims about "tampering". Here's a comparison of the gridded global land temperature trend, showing the negligible difference between GHCN raw and adjusted data: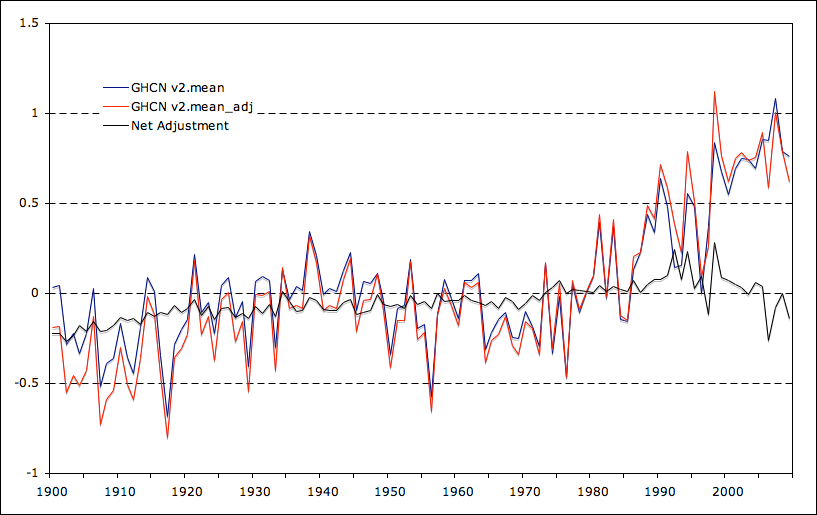 This is based on results from Zeke Hausfather, one of a large and growing number of people who have done independent, gridded analyses of global temperature using open-source data and software.
BP claims that the GHCN adjustment added "0.26 C" to the warming trend over the last 90 years (is that 0.26 C per 90 years, or is it 0.26 C per century over the last 90 years? "0.26 C" is not a trend).
Using a gridded analysis, the actual difference in the trends is 0.04 C/century over the last 90 years. Over the last 30 years, the difference in trend between the raw and adjusted data is 0.48 C/century ... with the adjusted trend being lower than the raw trend. In other words, the "tampering" that BP has detected is, over the past 30 years, reducing the magnitude of the warming trend.
Then, of course, there's the issue that land is only about 30% of the earth's surface. Presumably the effect of any adjustment to the land data needs to be divided by 3.33 to compare its magnitude to the global temperature trend.
Once again, BP has drawn extreme and completely unjustified conclusions ("tampering") based on a very weak analysis. Personally, I am getting really tired of seeing this here.
This is based on results from Zeke Hausfather, one of a large and growing number of people who have done independent, gridded analyses of global temperature using open-source data and software.
BP claims that the GHCN adjustment added "0.26 C" to the warming trend over the last 90 years (is that 0.26 C per 90 years, or is it 0.26 C per century over the last 90 years? "0.26 C" is not a trend).
Using a gridded analysis, the actual difference in the trends is 0.04 C/century over the last 90 years. Over the last 30 years, the difference in trend between the raw and adjusted data is 0.48 C/century ... with the adjusted trend being lower than the raw trend. In other words, the "tampering" that BP has detected is, over the past 30 years, reducing the magnitude of the warming trend.
Then, of course, there's the issue that land is only about 30% of the earth's surface. Presumably the effect of any adjustment to the land data needs to be divided by 3.33 to compare its magnitude to the global temperature trend.
Once again, BP has drawn extreme and completely unjustified conclusions ("tampering") based on a very weak analysis. Personally, I am getting really tired of seeing this here.
-
kdkd at 21:44 PM on 29 June 2010Temp record is unreliable
BP #64 I suggest you have a look at what the Clear climate project has to say about the ghcn data you've examined. Scientific code is almost never pretty - the goals are very different to what commercial programmers would expect, and technical debt accumulates at far faster rates compared even to poorly managed commercial projects. This is caused by the two camps having distinctly different goals (technical incompetence on the side of the scientists, and scientific incompetence on the side of the programmers, to be uncharitable). -
HumanityRules at 21:16 PM on 29 June 2010Return to the Himalayas
Thanks Doug, I'll just offer this new paper for now which raises the idea that the Himalayan catchment areas may be less susceptible to glacier mass balance changes than believed. Suggesting precipitation dominates the hydrological system of the region. -
Berényi Péter at 21:14 PM on 29 June 2010Temp record is unreliable
#65 scaddenp at 12:39 PM on 29 June, 2010 I believe the papers used for homogenization are listed here.USHCN Do you have a problem with the methodology used here? According to the USHCN page you have linked they do adjustments in 6 steps. The first one "with the development at the NCDC of more sophisticated QC procedures [...] has been found to be unnecessary" Otherwise the procedure goes like this: RAW -> TOBS -> MMTS -> SHAP -> FILNET -> FINAL Proper process audit is impossible, because- unified documentation of the procedure, including scientific justification and specification of algorithms applied is not available
- for step 2, 3, 4 & 6 at least references to papers are provided, for step 5 not even that
- neither executables nor source code and program documentation is provided for programs TOBS, MMTS, SHAP & FILNET.
- metadata used by the programs above to do their job is missing and/or unspecified
- clear statement whether the same automatic procedure were applied to GHCN v2 which is hinted at the USHCN Version 1 site is missing (if the arcane wording "GHCN Global Gridded Data" in the HTML header of that page is dismissed)
I do not know how authoritative it is. But I do know much better documentation is needed even on low budget projects, not to mention one multi thousand billion bucks policy decisions are supposed to be based on. The "Pairwise Homogeneity Algorithm (PHA)" promoted (but not specified) in this document is not referenced on any other USHCN or GHCN page. Google search "Pairwise Homogeneity Algorithm" site:gov returns empty. It would be a major job to do the usual software audit on this thing. One has to hire & pay people with the right expertise for it, then publish the report along with data. However, any scientist would run away screaming upon seeing a calibration curve like this, wouldn't she? It is V shaped with clear trends and multiple step-like changes. One would think with 6736 stations spread all over the world and 176 years in time providing 4,864,014 individual data points errors would be a little bit more independent allowing for the central limit theorem to kick in. At least some very detailed explanation is needed why are there unmistakable trends in adjustments commensurate with the effect to be uncovered and why this trend has a steep downward slope for the first half of epoch while just the opposite is true for the second half? BTW, the situation with USHCN is a little bit worse. Adjustment for 1934 is -0.465°C relative to those applied to 2007-2010 (like 0.6°C/century?). I'll post the USHCN graph later. #66 scaddenp at 12:39 PM on 29 June, 2010 you think that you can explain warming in ocean, satellite, and surface record away as "anomalies" as poor instrumental records, and then explain the loss of ice/snow around the world purely by black soot? And the sealevel rise as by soot-induced melting alone without thermal expansion? I guess similar strange measurement anomalies will explain upper stratospheric cooling and the IR spectrum changes at TOS and at surface. That is drawing one very long bow One thing at a time, please. Let's focus on the problem at hand first, the rest can wait.USHCN Version 2.0 Update v1.0Processing System Documentation(another version number here?)Draft August 46, 2009 Claude Williams Matthew Menne -
Peter Hogarth at 20:17 PM on 29 June 2010What causes the tropospheric hot spot?
SNRatio at 16:30 PM on 29 June, 2010 (or related anyway) Bengtsson 2009 suggests Lower Troposphere Temperature minus Mid Troposphere Temperature (TLT-TMT, or T2LT-T2) is a servicable approximation to lapse rate. Sorry for not pointing this out explicitly above after my table, but this has increased unambiguously over the record. Even between the analysis in the papers referenced. Santer (data up to 2000) gets 0.024 and 0.023 for RSS and UAH data respectively. Bengtsson (data up to 2008) gets 0.035 and 0.036, and the May 2010 values give 0.037 and 0.035 (RSS and UAH respectively). On this the satellite records agree very well. It should also be appreciated that the TLT and TMT are not measurements within distinct layers, but represent weighted sums as we ascend so that for example 90% of T2 data is from troposphere surface to 18km, whilst 90% of T2LT is surface to 8km. Radiosondes can of course give data at specific heights, the four most recent primary sonde data sets show clear tropospheric warming higher than at surface, see figure above. -
JMurphy at 19:47 PM on 29 June 2010Temp record is unreliable
doug_bostrom wrote : "...but on the other hand we're also sometimes treated to interesting little essays like this". And to add one last comment on this diversion : that comment just proves my point. Anywhere else you care to research the subject of the Dialogo, you will find Simplicio described as a combination of two contemporary philosophers : Cesare Cremonini who famously refused to look through the telescope; and Ludovico delle Colombe, one of Galileo's main detractors. You will also find evidence of Galileo's good connections with Maffeo Barberini (later Urban VIII), who had written a poem in praise of Galileo's telescopic discoveries and actually agreed to the publication of the Dialogo. Why, then, would Simplicio be a parody of Urban ? It's all part of a pattern : BP finds the evidence he likes and agrees with and everything else (and everyone else) is wrong, fraudulent or part of the conspiracy. -
Doug Bostrom at 18:35 PM on 29 June 2010Temp record is unreliable
Not to swerve completely off-topic JMurphy but I'm not sure I can think of a single other skeptic I've witnessed actually admitting an error other than BP, here, though I can't remember exactly what was about or where, just that it was striking in its very novelty. I'm bothered by the fraud thing, very much so because it's hard to talk with somebody who starts with an assumption that data is cooked and I have to wonder how virtually all of our instrumental records could be either hopelessly flawed or run by the Mafia but on the other hand we're also sometimes treated to interesting little essays like this. I've spent (wasted according to some people) a lot of time in the past 3 years hanging out on climate blogs and Berényi Péter is quite unlike any other doubter I've run across. -
JMurphy at 18:11 PM on 29 June 2010Temp record is unreliable
I used to be impressed with the allowances you grant to BP and his wild (and long) meanderings laced with accusations (such as 'tampering') and insinuations, but it is starting to get very boring and frustrating. How many times can such accusations be allowed without proof, even if followed by apologies - although the apologies are never (as far as I can see) related to the accusations made, as can be seen for his 'apology' on the Ocean acidification thread, where he apologised for getting angry but not for the general accusations against 'climate science'. -
andrew adams at 17:48 PM on 29 June 2010What causes the tropospheric hot spot?
robhon, They did point to the particular passage in the IPCC report - I don't think they misquoted it, it just doesn't support the point they were making. -
SNRatio at 16:30 PM on 29 June 2010What causes the tropospheric hot spot?
Isn't the GHG fingerprint the _divergence_ of stratospheric and tropospheric temps? I.e. the stratosphere constant or cooling while troposphere is warming, or the stratosphere cooling with the trop. constant or warming? And that fingerprint does not have to be very strong. -
Doug Bostrom at 12:44 PM on 29 June 2010Temp record is unreliable
BP, what act of contrition will you offer should your remark of "tampered with" prove faulty? Perhaps a more careful choice of words would be better? Also, this isn't some kind of fad thing you're bringing from elsewhere, is it? I'm not being nasty, just am bothered with words smacking of fraud and am really bored with impressionist fads. As I've said before, you make an effort but that makes it -more- disappointing when you succumb to the freshly-revealed-climate-science-conspiracy-of-the-week. Anyway how about explicitly publishing your (admittedly simple sounding but I'm a simpleton) arithmetic method you're using to produce your datapoints? -
scaddenp at 12:39 PM on 29 June 2010Temp record is unreliable
"without soot pollution on ice & snow" - you mean you think that you can explain warming in ocean, satellite, and surface record away as "anomalies" as poor instrumental records, and then explain the loss of ice/snow around the world purely by black soot? And the sealevel rise as by soot-induced melting alone without thermal expansion? I guess similar strange measurement anomalies will explain upper stratospheric cooling and the IR spectrum changes at TOS and at surface. That is drawing one very long bow, BP. You could be right but I will stick with the simpler explanation - we ARE warming and our emissions are the major cause of it. -
Doug Bostrom at 12:32 PM on 29 June 2010How many climate scientists are climate skeptics?
The complete Revkin comment omnologos believes dramatic: For starters, one aspect of such efforts that I find troubling is the definition of categories. Convinced/unconvinced begs a question: Convinced of what? That human-driven warming is real, is dangerous, requires a response focused on emissions reductions (or adaptation), or…? There is such a continuum of reasoning on the part of those lumped as “unconvinced” that the entire effort threatens to lose meaning. Not exactly an excoriation, I'd say. It would indeed be nice if some folks w/core activity in social sciences took up this topic, especially as there's been such a concerted effort to deceive the public on what's what in mainstream climate research. Anderegg et al are filling a vacuum but it's beginning to leak. See my post immediately above this one. -
scaddenp at 12:27 PM on 29 June 2010Temp record is unreliable
BP - a script and post on this. do climatologists falsify data?. I believe the papers used for homogenization are listed here.USHCN Do you have a problem with the methodology used here? -
Doug Bostrom at 12:24 PM on 29 June 2010How many climate scientists are climate skeptics?
Folks interested in a formal social sciences approach to expert thinking about climate change might want to check out this paper: Expert judgments about transient climate response to alternative future trajectories of radiative forcing -
Berényi Péter at 12:16 PM on 29 June 2010Temp record is unreliable
#63 CBDunkerson at 20:40 PM on 27 June, 2010 though in fact UAH originally came up with results significantly different from the surface results and only later came to line up after several errors were identified Yes. And the motivation for debugging was the discrepancy. But the thing about conversion of brightness temperatures to proper temperatures using an atmospheric model was just a guess, I have not looked into the issue deeply enough, yet. However, I am pretty sure the surface database is tampered with. I have downloaded both v2.mean.Z and v2.mean_adj.Z from the GHCN v2 ftp site. According to the readme file data in the latter one are "adjusted to account for various non-climatic inhomogeneities". Then selected pairs of temperature values where for a 12 character station ID (includes country code, nearest WMO station number, modifier and duplicate number), a specific year and month both files contained valid temperatures (4,864,014 pairs for 1835-2010). For each pair I have calculated the adjustment as the difference of the value found in v2.mean_adj and v2.mean. Having done that, I have taken the average of adjustments for each year. It looks like this: It is really hard to come up with an error model that would justify this particular pattern of adjustments. One is inclined to think it's impossible.
Note that for the last ninety years adjustments for various non-climatic inhomogeneities alone add about 0.26°C to the warming trend. If we also take into account the UHI effect which is not adjusted for properly, not much warming is left. Without soot pollution on ice and snow, we probably would have severe cooling.
It is really hard to come up with an error model that would justify this particular pattern of adjustments. One is inclined to think it's impossible.
Note that for the last ninety years adjustments for various non-climatic inhomogeneities alone add about 0.26°C to the warming trend. If we also take into account the UHI effect which is not adjusted for properly, not much warming is left. Without soot pollution on ice and snow, we probably would have severe cooling.
-
Doug Bostrom at 11:49 AM on 29 June 2010Sea level rise is exaggerated
I've been inspired by Daniel to scrutinize Donnelly et al more closely. One thing to note right away: I'm struck by Daniel's powerful rhetoric (Donnelly's paper is an "utter joke") compare to Donnelly's measured language in his conclusions: The likely increase in the rate of SLR in the late 19th century A.D. is roughly coincident in time with climate warming observed in both instrumental and proxy records [e.g., Mann et al., 1998; Pollack et al., 1998]. The results indicate that this recent increase in the rate of SLR may be associated with recent warming of the global climate system. Daniel might have a point about uncertainties, if Donnelly's stratigraphic conclusions were taken in isolation and were naively dated, and if Donnelly's main objective was to derive a reasonable absolute measure of sea level for each stratigraphic sample. However, Donnelly's dating interpretation of the sequence is consistent with independent markers and in any case Donnelly's objective is not to obtain a series of accurate historical sea levels attributed to particular years over a 700 year period but rather to form an estimate of rate of rise over that entire span. That means that if the samples can be boxed into periods of a few years they're suitable for Donnelly's requirements. It turns out that markers constrain the uncertainties of individual measurements sufficient to eliminate extended large excursions of the type Daniel hypothesizes making it quite unlikely that the bulk of the rise indicated by the sequence was concentrated in short bursts. The various tools deployed by Donnelly to constrain dates are exactly what I'm talking about when I say the neither Daniel nor I are equipped to offer criticism of this work with an eye to disproving it. Here's a typical example: To further refine our C-14 chronology, we used fossil pollen evidence of European clearance/agriculture and industrial revolution-related heavy metal pollution horizons (Figure 3). Peat samples for pollen and metals analysis were also taken from just above the contact with the erratic. The initial rise in Rumex spp. pollen (a native weed) (-46.5 to -50.5 cm) coincides with land clearance for agriculture between 1650 and 1700 A.D. [Clark and Patterson, 1985; Donnelly et al., 2001]. An uncertainty box has been plotted (light gray) based on the presence of Jg and Sp remains at this interval (indicative meaning of 6.7 ± 10.4 cm above MHW) and the time interval of initial land clearance (box with diagonal line fill; Figure 2). The combination of the indicative meaning of the sample (including 2s uncertainty) with its accepted age range yields boxes representing the most likely elevation of MHW in the past (Figure 2). The appearance of Plantago lanceolata (an introduced species) between -32.5 and -35.5 cm (Figure 3) suggests deposition in the early 19th century [Clark and Patterson, 1985]. Based on the presence of Jg and Sp remains at this interval we plotted a box representing the indicative meaning of this interval (vertical line fill) and the associated uncertainty box (light gray) (Figure 2). Other methods were used to constrain other samples, methods of which Daniel and I know nothing. This is what I mean when I refer to unearned hubris; dismissing a paper as "junk" from a position of ignorance of the specialized tools used to produce it is foolish. Daniel complains There is more than enough slack in this data to periodically reproduce the apparently rapid sea level rise of 2.8mm/year in the NYC tide gauge data of the last ~150 years but that's speculation. The conservative way to interpret the data is to take it for what can say. Donnelly: A linear rate of rise of 1.0 ± 0.2 mm/year intersects all the 2 [sigma] uncertainty boxes of the record from the 14th to the mid-19th century. That's it, and in any case we've already seen that wild slews in rate changes don't seem to fit the C14-independent constraints of the samples. Donnelly himself is carefully circumspect about his conclusions: Coupling the Barn Island record and regional tide-gauge data indicates that the rate of SLR increased to modern levels in the 19th century (Figure 2). However, given that the center of each uncertainty box has the highest probability the most conservative interpretation of the data is that the SLR increase to modern values occurred in the late 19thcentury (Figure 2). Daniel needs to do better than Donnelly at performing this same work in order to dismiss Donnelly's paper but he can't because he's not trained in Donnelly's area of specialization. Because Daniel cannot address the paper at this level of detail but can only use general purpose adjectives to support his case, I'm with Donnelly on this matter. What choice do I have? Donnelly makes a reasonable case using tools he describes adequately but which I'm unqualified to judge, as is Daniel. I suggested an attack via uncertainty to Daniel because that's the only technique I could use in this case, lacking the disciplinary tools to address Donnelly's methods as I do, and in all probability that's true of Daniel as well.
Prev 2318 2319 2320 2321 2322 2323 2324 2325 2326 2327 2328 2329 2330 2331 2332 2333 Next


