


 Arguments


Recent Comments
Prev 2323 2324 2325 2326 2327 2328 2329 2330 2331 2332 2333 2334 2335 2336 2337 2338 Next
Comments 116501 to 116550:
-
scaddenp at 08:22 AM on 14 July 2010Hotties vs Frosties?
BP - I thought you would have known where I came from due to recent email corresponse For 2007, the number for NZ is 94 (I misremembered), the 146 no. I believe includes directly exported energy (petroleum, coal). I did the calculations in gory detail for a MacKay style analysis from NZ Energy file. -
Berényi Péter at 08:09 AM on 14 July 2010Hotties vs Frosties?
#168 scaddenp at 07:09 AM on 14 July, 2010 Your point? [...] The 91kWh/p/d I quoted was for NZ (consumption). Sorry, I've misunderstood you. I had no way to know you were from New Zealand. However, total primary energy consumption in NZ is 146 kWh/p/d, not 91. That's only the approximate portion coming from coal, oil and natural gas (more like 95 kWh/p/d). The 35% renewable is nice (15% in the US), but you are lucky. Low population density, high geopotential and precipitation makes hydro an option. -
chris at 08:08 AM on 14 July 2010Watts Up With That concludes Greenland is not melting without looking at any actual ice mass data
Berényi Péter at 05:05 AM on 14 July, 2010 No, that's not correct Peter. Remember that the thermal expansion coefficient of water has a strong temperature dependence, and temperature obviously isn't constant as in your statement. The thermal expansion coefficient is larger for warmer waters than cooler waters. The consequence is that the deposition of 1 kcal (say) of thermal energy in the warmer upper mixed-layer of the ocean will cause a larger volume expansion than if the same quantity of heat is deposited in the cold deeper ocean (say below the thermocline). This effect of depth (temperature)-dependent thermosteric contributions to sea level rise have been described in early studies of sea level responses to warming: e.g. Wigley, TML and Raper SCB (1987) Thermal-expansion of sea-water associated with global warming Nature 330, 127-131. and you can find it stated rather explicitly in Trenberth's review that I linked to in a post above. e.g. see bottom of page 21 to top page 22:"Sea level rise from thermal expansion depends greatly on where the heat is deposited as the coefficient of thermal expansion varies with temperature and pressure. The warming required to produce 1 mm SLR if the heat is deposited in the top 700 m of the ocean can take from 50 to 75 x 10^20 J, or ~ 110 x 10^20 J if deposited below 700 m depth [14]."
In other words, some of the apparent shortfall in the thermosteric (ocean heat absorption) contribution to sea level rise during the period ~ 2003/4-2007/8 may be due to a larger than "average" transfer of heat to the somewhat deeper layers of the ocean. -
villabolo at 07:45 AM on 14 July 2010Watts Up With That concludes Greenland is not melting without looking at any actual ice mass data
For those who could use a few laughs please link up to WUWT where Steven Goddard is getting pummeled by several posters on that issue. I provide an example below. _____________________________________________________ stevengoddard says: July 13, 2010 at 11:52 am Jeff P I am talking about rates of sea level rise. If the rate of ice loss has doubled, then sea level rise would also have to double. ***************************************************** Jeff P says: July 13, 2010 at 12:36 pm “I am talking about rates of sea level rise. If the rate of ice loss has doubled, then sea level rise would also have to double.” ————— This is false. This would only be true if the cause of sea level rise was ONLY from ice loss. Clearly this is not the case. If ice loss has gone from something like 50 Gt a year to 100 Gt it has doubled but the impact on sea level rise would be tiny and far below the margin of error for the measurement of sea level rise. A 50 Gt increase in Ice loss would be less than 0.1 mm increase. If you’re saying that ice loss could not have possibly doubled (or even increased) because we aren’t seeing a 3+mm increase in the rate of sea level rise you’re way off base. ****************************************************** stevengoddard says: July 13, 2010 at 1:25 pm Jeff P Uhhmm… You might want to think your sea level argument through a little more carefully. Increasing ocean heat content will also tend to raise sea levels, and makes the the ice melting argument even less tenable. ***************************************************** villabolo says: July 13, 2010 at 1:32 pm Ahhhh . . . Steve, with all due respect. Thermal increase would simply be a CO-FACTOR with ice melt. And where would both come from? -
muoncounter at 07:28 AM on 14 July 2010Watts Up With That concludes Greenland is not melting without looking at any actual ice mass data
NewYorkJ #21: Your map compares the 2000 decade with the 1930s; there's not much difference between those two decades on the graph I snipped from the WUWT article. It would be more informative to map the comparison between the 1980s and the current decade. -
scaddenp at 07:09 AM on 14 July 2010Hotties vs Frosties?
BP - you keep showing this graph as proof of something but you have yet to tell us of what. How does this prove fraud? How about you find us one station where you think the adjustment procedure has been fraudulently done and show us how the adjustment should have been done? "No. In 2004 US primary energy comsumption (achievement at primary energy carriers stressed on the average) was 10,460 Watts/head. If you do the math that comes out as 251.04 kWh/p/d." Which is close enough to 250kWh/p/d which I quoted. Your point? MacKay is giving everyone 125kWh/p/d which is obviously a problem for US citizen but an increase for most of the world. The 91kWh/p/d I quoted was for NZ (consumption). "Think globally, act locally. " Umm, I was. I dont think we are on the same wavelength. And I'll add another defense for windmills. If you find another way to generate energy, then they are relatively easy to remove unlike say hydro. A personal distaste for the aesthetics of windmills (you prefer the look of coal stations?) doesnt seem to stack up against the negative effects from rapid climate change. -
Berényi Péter at 06:35 AM on 14 July 2010Hotties vs Frosties?
#165 Ned at 05:03 AM on 14 July, 2010 The relevance of this all escapes me Don't mull over it too much, I tell you. If wind power is to supply a significant portion of energy on a global scale, the area of industrial wasteland increases by orders of magnitude. Land use is inversely proportional to energy density. It's as simple as that. And Chernobyl does not belong here. It was an absolutely flawed & irresponsible soviet design with no built in structural safety whatsoever. Modern (30+ years old) models can't possibly blow up. -
dansat at 06:34 AM on 14 July 2010Watts Up With That concludes Greenland is not melting without looking at any actual ice mass data
I am about to make my second trip to Greenland. This time to visit the NEEM ice core site. I can tell you there are very few people in Greenland (Scientist or not) who will tell you that Greenland is NOT melting. Dan S WHNT Huntsville AL -
muoncounter at 05:34 AM on 14 July 2010What's in a trend?
I guess I'm not seeing the relationship between these ocean oscillations and the UAH temperatures. Here's a graph of AMO and SOI straight off the PSD data selection plotter. Here are UAH N hemi ocean LT temps with a smooth curve extracted in the same manner as the polar data in this article. Similarly, I found a long term trend in the AMO time series.
 Here are UAH S hemi ocean LT temps with the same curve fit and a long term trend extracted from the SOI.
 The two ocean oscillations are certainly out of phase (most of the time); they reach their respective extrema in the late 80's and their long term trends do indeed cross over from time to time. But when the AMO started down, the N hemi LT temps kept going up. And when the SOI started up, the S hemi LT temps also went up. Where's the connection?
-
DarkSkywise at 05:14 AM on 14 July 2010Hotties vs Frosties?
....and BP #163: Carrizo Plain Solar Power Plant – Southern California, USA Another "oldie"... but the photovoltaic panels are now in use elsewhere, which isn't too shabby either. So, um, your problem is that they haven't demolished the original sturcture yet? (Like Ned, I don't really get the point here.) -
Berényi Péter at 05:05 AM on 14 July 2010Watts Up With That concludes Greenland is not melting without looking at any actual ice mass data
#25 chris at 04:00 AM on 14 July, 2010 the thermosteric contribution apparently went down a bit (either due to reduced absorption of heat into the ocean or a redistribution of heat to somewhat deeper levels where the thermosteric contribution is suppressed) What do you mean by "to somewhat deeper levels where the thermosteric contribution is suppressed"? In fact at constant temperature volumetric thermal expansion coefficient of seawater increases steadily with pressure. It also increases with pressure if kept at constant potential temperature (when sinking adiabatically). It means if you succeed to push down a body of water with a slightly higher temperature, the deeper it goes the higher its heat content anomaly pushes sea level. Therefore thermosteric contribution is not suppressed by redistribution of heat to somewhat deeper levels, just the opposite. You can check it yourself with this Sea Water Equation of State Calculator tool. -
Ned at 05:03 AM on 14 July 2010Hotties vs Frosties?
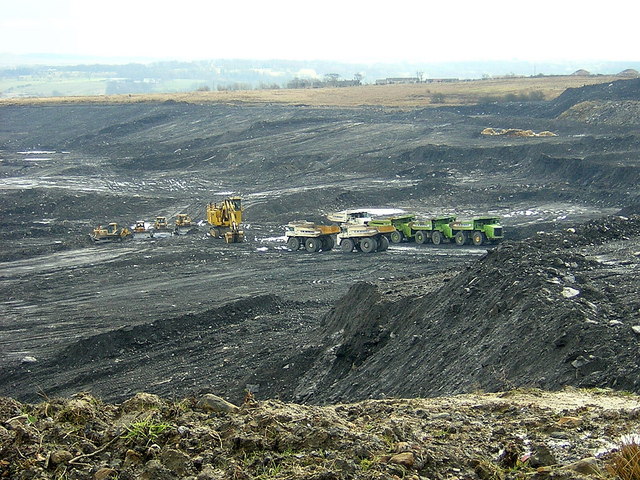
For the sake of completeness, here's an abandoned nuclear reactor: and here's a coal mine:
 and here's an abandoned oil field:
 and here's a failed dam:
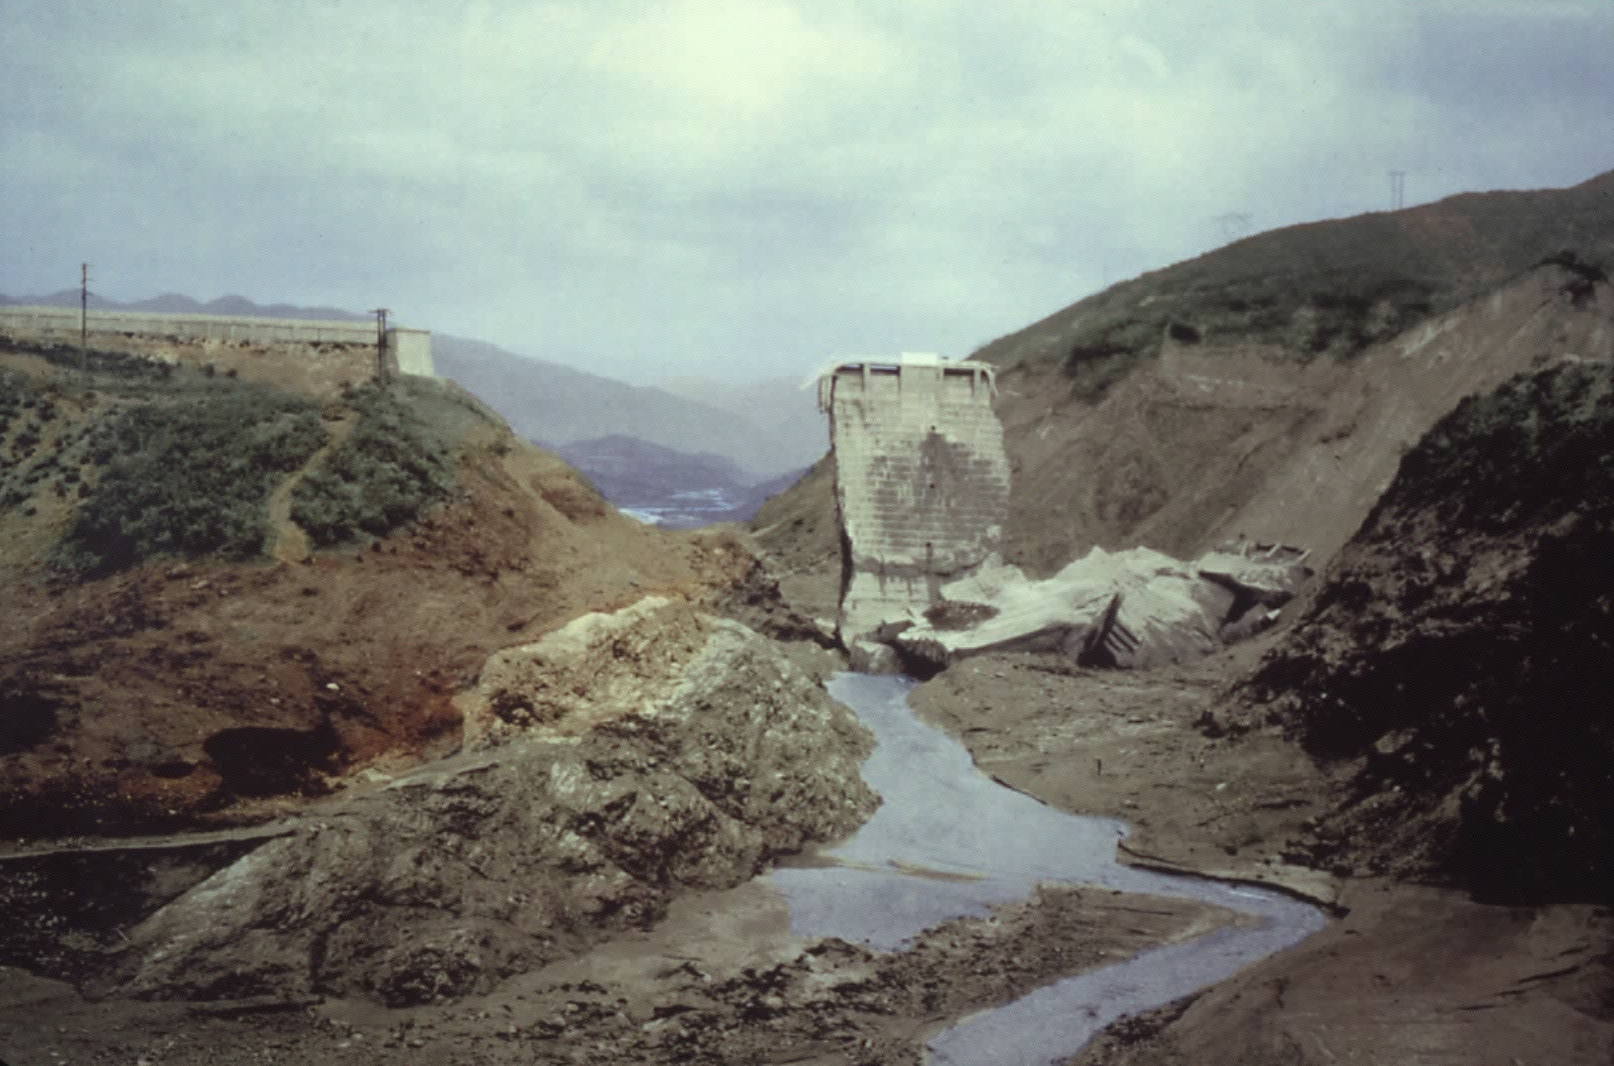 The relevance of this all escapes me, but it seems to be highly meaningful to Berényi Péter....
-
DarkSkywise at 05:02 AM on 14 July 2010Hotties vs Frosties?
@BP #161: Kamaoa Wind Farm, South Point, Hawaii, USA I'm curious... what's exactly wrong with early model wind turbines breaking down after 19 years of service? Modern turbines have a life expectancy of 20-30 years, so for a 1987 model, I'd say they held up pretty good. -
Berényi Péter at 04:28 AM on 14 July 2010Hotties vs Frosties?
That's how abandoned solar looks like. Carrizo Plain Solar Power Plant – Southern California, USA
-
chris at 04:25 AM on 14 July 2010Watts Up With That concludes Greenland is not melting without looking at any actual ice mass data
CBDunkerson at 04:14 AM on 14 July, 2010 hmmm....I hadn't thought of that. The answer must be known, but a simple consideration of geometry would tend to support your point. I wonder how significant it is... -
CBDunkerson at 04:14 AM on 14 July 2010Watts Up With That concludes Greenland is not melting without looking at any actual ice mass data
On sea level rise... if we assume that the influx of water and/or thermal expansion are constant then would we not perforce have to expect the rate of sea level rise to decline over time? After all, when sea level goes up X amount it then covers a larger surface area of the planet... which means a greater volume of water will be required to go up X again. So, in order for the rate of sea level rise to increase we'd have to see melt / thermal expansion increasing fast enough to exceed this 'diminishing returns' factor. -
Berényi Péter at 04:07 AM on 14 July 2010Hotties vs Frosties?
And dream version of the one above, for comparison.
-
AuntSally at 04:05 AM on 14 July 2010Watts Up With That concludes Greenland is not melting without looking at any actual ice mass data
Re: 19, Dave Springer... Careful not to fall into the trap of viewing sea level as a 1-parameter system. Greenland icemelt is not the only contributing factor to sea level rise. In particular, thermal expansion is the single largest influence. I'm not an expert in the field and I imagine the dynamics are complicated. Nevertheless, I think I can say with confidence that the rate of thermal expansion is tied to where the heat is being transported in the ocean -- tropical vs. polar; surface vs. deep. So just because the Greenland icemelt has increased, other influences -- most likely thermal expansion -- are also playing a significant role. It's like cranking up the furnace in winter and wondering why the house isn't warming as fast as before, without also noting that you also opened a few windows. :) -
Berényi Péter at 04:03 AM on 14 July 2010Hotties vs Frosties?
#160 chris at 02:43 AM on 14 July, 2010 ..it's not like we would run out of wind! I don't think we need to contemplate your unhappy vision of "broken windmills", "dropping parts" and (the horror!) "leaking oil"... It's already happening. Kamaoa Wind Farm, South Point, Hawaii, USA (click on image for details)
-
chris at 04:00 AM on 14 July 2010Watts Up With That concludes Greenland is not melting without looking at any actual ice mass data
Dave Springer at 02:24 AM on 14 July, 2010 I’m not sure that the sea level data merits such detailed analysis. Regression of the satellite data indicates that the sea level rise "flattened" for a period especially between 2006-2008, but has “recovered” such that the current sea level is pretty much smack on the longish term trend. Sea level can vary in the short term by quite large amounts especially during La Nina’s and El Nino’s partly due to water volume expansion changes from changes in shallow water heat content but mostly from changes in surface evaporation and enhanced rainfall on land during La Nina’s (and vice versa for El Nino’s; see for example the top of the left hand column of page 25 of a recent review). That’s likely the cause of the anomalous temporary slow down in sea level during 2006-2008. Otherwise in the period of your graph, the mass volume contribution (from glacier melt) seemingly went up a bit while the thermosteric contribution apparently went down a bit (either due to reduced absorption of heat into the ocean or a redistribution of heat to somewhat deeper levels where the thermosteric contribution is suppressed). That’s the interpretation from direct analyses of mass and heat contributions to sea level rise as described by Cazenve and Llovel earlier this year. I do agree with you that once this internal variability is “averaged out”, one would expect the rate of sea level rise to increase a little if polar ice melt continues to be enhanced. Time will tell…. -
Albatross at 03:47 AM on 14 July 2010Watts Up With That concludes Greenland is not melting without looking at any actual ice mass data
Dave @18, Not sure which data you are looking at. One should look at the data calculated after applying the inverse barometer correction and removing the seasonal signal. Then one gets this. Looking at those U of Colorado data, I cannot see any significant change in the rate of increase over the 2002-2009 period. There was a slow down in 2007-2008, but that may have been associated with the La Nina event. Which goes to illustrate that loss of terrestrial land ice is not the only contributing factor to sea levels. -
robert way at 03:21 AM on 14 July 2010Watts Up With That concludes Greenland is not melting without looking at any actual ice mass data
For the record, not to nitpick. But Altimetry is not used to measure glacier speeds. Radar interferometry is...Response: Nitpick away! Have updated the post, thanks for the correction. -
Jim Eager at 03:07 AM on 14 July 2010Watts Up With That concludes Greenland is not melting without looking at any actual ice mass data
Dave Springer, re the short term negative acceleration in sea level rise, I wonder if the increase in atmospheric water vapour can account for at least part of this. -
MarkR at 03:00 AM on 14 July 2010Watts Up With That concludes Greenland is not melting without looking at any actual ice mass data
I think maybe you missed a trick here John: several papers have used altimetry JUST of the interior and there has been good evidence of thickening in the interior (e.g. Johannesen iirc?). Altimeter data has regularly had problems at getting low elevation (e.g. coastal) ice. This is expected with increased snowfall from greater water vapour content - but it's confusing when you first hear about it and the likes of Monckton and WUWT prey on that. -
NewYorkJ at 02:58 AM on 14 July 2010Watts Up With That concludes Greenland is not melting without looking at any actual ice mass data
Muoncounter (#13), That graph also appears to be just the raw data, lacking the homogeneity adjustment. Nuuk Most of Greenland was indeed on par with today temperature-wise, as was east of the Rockies in the CONUS. That's about the extent of it. Nearly everywhere else (Arctic included) it was consirably warmer. recent decade vs 1930's The double-whammy of greenhouse gases and black carbon is overwhelming a robust natural variation in the Arctic. -
JMurphy at 02:50 AM on 14 July 2010Medieval Warm Period was warmer
MrOTLChamp, firstly you can't use the temperature at one particular spot, in one particular period, to prove a global MWP - which is why you see a difference between the graph and the paper you mention. As for the Northern Hemisphere being warmer than the Southern Hemisphere, have a look at this NASA GISS graph to see the difference between Northern and Southern Hemisphere temperatures in recent times. I'm not directly comparing between now and then but it shows that there is/can be a difference (without the Earth necessarily tipping over too much), particularly due to the amounts of land and sea surfaces. KR has already given you the evidence for the extra reconstructions produced by others apart from Mann. Finally, can you give any other more representative examples as to why you 'don't have much faith in science lately' ? In the meantime, would you know whether the Geological Society of America (Climate Change statement) receives government funds ? If so, how much do they receive ? -
chris at 02:43 AM on 14 July 2010Hotties vs Frosties?
Ned at 01:18 AM on 14 July, 2010 Yes I noticed that Ned. Luckily we posted at more or less the same time, else everyone might have assumed I'd just copied you ;- } Berényi Péter at 01:58 AM on 14 July, 2010 I wonder whether one would need to decommission a wind farm Peter. I would have thought the turbines could simply be replaced/upgraded as required, and as new technologies came on line. It just requires a little bit of creative planning... ..it's not like we would run out of wind! I don't think we need to contemplate your unhappy vision of "broken windmills", "dropping parts" and (the horror!) "leaking oil"... -
Dave Springer at 02:29 AM on 14 July 2010Watts Up With That concludes Greenland is not melting without looking at any actual ice mass data
Didn't mean to say sea level went steadily down. Meant to say the annual rate of sea level rise went steadily down. If rate of meltwater pouring into the ocean doubled one wouldn't reasonably expect that the rate the oceans are rising would decline during the same period. -
Dave Springer at 02:24 AM on 14 July 2010Watts Up With That concludes Greenland is not melting without looking at any actual ice mass data
Sea level change doesn't appear to be reflecting the melt... http://img709.imageshack.us/img709/8536/sealevelchange.gif During the period of time (2002-2009) when GRACE gravitational anomalies implied a doubling of ice mass loss the global average sea level went steadily down. Can anyone here explain that? -
HumanityRules at 02:20 AM on 14 July 2010Watts Up With That concludes Greenland is not melting without looking at any actual ice mass data
I take your point John but The WUWT article mainly focuses on the temperature record with a few spurious comments on mass balance while you seem to focus on mass balance. The WUWT temp stuff seems fairly accurate, there is plenty of science that suggests the 1940's and the recent period temperature records are not too dis-similar. I think figure 10 from this CRU paper is essentially showing what WUWT are arguing with regard to the Greenland temperatures. It peeves me that we don't have accurate mass balance data for 1930-1940. -
Albatross at 02:18 AM on 14 July 2010Hotties vs Frosties?
Some cheering news today on the success of renewable energy in Europe Whatever the doubts the contrarians may have (both legitimate and not)governments are moving forward. Nice to see that people discussing how we can limit our GHG emissions. -
Phila at 02:11 AM on 14 July 2010Watts Up With That concludes Greenland is not melting without looking at any actual ice mass data
#15 Message garbled, please resend. I had to stop reading Arkadiusz some time ago, because the stylistic quirks and lack of formatting produce instant eyestrain. I'd prefer to read all the comments here, even the ones I almost invariably disagree with, so I hope Arkadiusz will make an effort to present his opinions in a format that's a little easier to decipher. -
Berényi Péter at 01:58 AM on 14 July 2010Hotties vs Frosties?
#155 Ned at 00:54 AM on 14 July, 2010 Want to compare the costs (economic and environmental) of decommissioning a wind farm to the costs of a dam, an oil field, or a nuclear power plant? Yes, that would be nice. To be fair projects with the same actual lifetime power output should be compared. -
MrOTLChamp at 01:55 AM on 14 July 2010Medieval Warm Period was warmer
"They quote the paper "The Little Ice Age and Medieval Warm Period in the Sargasso Sea Lloyd D. Keigwin, Science, New Series, Vol. 274, No. 5292 (Nov. 29, 1996), pp. 1504-1508". I looked at it, and it seems that by using sediment cores he can give some evidence that at least locally, at the "Bermuda rise" in the Sargasso sea, the MWP was indeed 1 degree warmer." Looking at the temperature graph for the MWP, it shows that it wasn't 1 degree warmer. Infact it shows it's average. Which to me means that the graphs that relate to earlier times are not accurate at all. it doesn't make sense to me that just the northern hemisphere would be warmer than everywhere else. For that to happen it seems that the earth would have to tip over on it's axis pointing the northern hemiphere directly at the sun. And I sure wouldn't give Mann much credibility due to his "hockeystick graph" as a global temperature, which no other scientist was able to reconstruct. Needless to say, I don't have much faith in the science lately. There's too much money at stake for a bias not to be considered. Is there any science organizations that are not recieving government funds that have come to the conclusion that the warming of the planet is man-made? -
muoncounter at 01:44 AM on 14 July 2010What's in a trend?
#10: "I'm not exactly why you're picking on UAH for using single trend lines" Its not so much 'picking on', as it is citing UAH as a specific example. I saw the blogpost about this past June's temperatures, which mentioned UAH specifically and used their straight line trend as a standard. Prior to reading that, I've seen straight line fits all over, but mostly disregarded them. #11: "but you can't say much about the global climate trends looking at a few months or years." All too true. However, when you see a pattern that persists on a 15 year time scale abruptly change, you have to wonder whats going on. -
CBW at 01:20 AM on 14 July 2010What's in a trend?
It's SOP because climate scientists know that thirty years is about what is necessary to declare a climatic trend. People looking at shorter time intervals can find interesting phenomena (and a lot of scatter), but you can't say much about the global climate trends looking at a few months or years. -
ScaredAmoeba at 01:18 AM on 14 July 2010Watts Up With That concludes Greenland is not melting without looking at any actual ice mass data
Arkadiusz @ 11 Message garbled, please resend. -
Ned at 01:18 AM on 14 July 2010Hotties vs Frosties?
Re: preceding two comments: Believe it or not, chris and I actually are different people..... :-) -
KR at 00:58 AM on 14 July 2010Sea level rise is exaggerated
daniel - or more, properly for those reading daniel's comments, since he's apparently missed the point: The data referred to comes from two different data sources measuring the same quantity. The first is recent tide gauge data (last 150 years), indicating a sea level rise (SLR) of 2.4 mm/yr. The second data set comes from a fairly sparsely but well distributed sampled set of paleo data, based on core sample species abundance, indicating sea levels at various points over the last 1000 years, with a statistically tight best fit of ~1 +/- 0.2 mm/year. The Donnelly paper (single paper) daniel has been discussing therefore concludes that SLR increased from ~1 to 2.4 mm/year starting ~150 years ago, a conclusion completely in agreement with all other data sets (which daniel does not discuss). Daniels argument appears to be that natural variation could account for the last 150 years of 2.4 mm/year SLR. In other words, the ocean isn't warming (contradicts the data), icecaps aren't melting (contradicts the data), it's variability, not global warming. Any similar 2.4 mm/year rise extending over 100+ years in the past would have greatly offset later paleo data points. It's barely statistically possible (but certainly not the statistically justified hypothesis!) that such a rise could have occurred, if a corresponding <1.0 or even negative SLR trend balanced it out, returning later paleo samples to the ~1 mm/year trend. If there was a situation of high variability, that would have to cycle +/- around the 1.0 mm/year level to still show that on the long term averages. This is exceedingly physically unlikely, however, as sea level is driven by steric expansion and icecap/glacial melt, rather low variability processes. In addition, no records, evidence, or data supports sufficient temperature drops or increased icecap/glaciation in the past 1000 years. Additional data sets for paleo sea level also fall on the ~1.0 mm/year slope, with a total sample spacing much closer than the 11 samples in the Donnelly paper, thus leaving no room for such high variability periods. Claiming extreme variability that is somehow missed in the paleo data for even this single paper under discussion is not justified by the evidence. And opening your view to additional data clearly eliminates such variability in the time period under discussion. Asserting that it somehow snuck in between the data points is simply wishful thinking, not science. -
HumanityRules at 00:58 AM on 14 July 2010What's in a trend?
muoncounter The asymmetry is there because of the GHG trend. Once this trend is removed from the arctic and antarctic the symmetry looks good. Have a look at the paper if you can get passed the paywall. I'm not exactly why you're picking on UAH for using single trend lines. it seems like SOP for climate science. -
chris at 00:58 AM on 14 July 2010Hotties vs Frosties?
Berényi Péter at 00:33 AM on 14 July, 2010 "My point was windfarms render huge areas uninhabitable (much larger than anyhing else). It's a valid one. What else do you need?" Do they Peter? Not if you put them in shallow coastal seas. Not if you put them on windy peat moors. Not if you put them on rough moors suitable only for sheep and goat grazing. None of these really take up much space at all and allow the original land use to be maintained (O.K. perhaps one wouldn't wish to go grouse shooting on a peat moor with wind turbines!). But what's wrong with a wind turbines on a sheep farm - a wind farm where sheep may safely graze ("Schafe können sicher weiden" as JS Bach might have put it if he was considering the delights of wind power). As for...."If you switch technology without improving regulations....", isn't there an obvious answer to that? I hope you're not suggesting we consider installing wind turbines without appropriate regulations for their maintenance and decommissioning. In any case I expect the latter might be a teeny bit more tractable that decommissioning coal plants, let alone nuclear power plants... I wonder whether you're being deliberately obtuse now (piling up fanciful objections!) -
Ned at 00:54 AM on 14 July 2010Hotties vs Frosties?
My point was windfarms render huge areas uninhabitable (much larger than anyhing else). It's a valid one. What else do you need? Stop exaggerating, please. Some windfarms are offshore. Some windfarms are in very sparsely populated regions. Some windfarms are in agricultural areas, where power companies rent space from farmers. In the latter case, normal economic activity (growing crops) generally proceeds more or less uninterrupted around the wind turbines. You tossed out a bunch of anecdotal Youtube videos and a vague implication that somebody in Vinalhaven, Maine is unhappy with wind turbines. I pointed out that one recent poll shows support for wind power in Maine running at about 90%. Who's got the stronger case here? This, however, is a valid point: If you switch technology without improving regulations, in a couple of decades you'll be left with broken windmills dotting the landscape, dropping parts, leaking oil and other chemicals, making it unsafe to even walk among them, not to mention farming. Then you'll have a choice to spend public money on decommissioning or abandon the place and move on. Of course, that applies to every power generating technology. Want to compare the costs (economic and environmental) of decommissioning a wind farm to the costs of a dam, an oil field, or a nuclear power plant? -
Jim Eager at 00:44 AM on 14 July 2010Watts Up With That concludes Greenland is not melting without looking at any actual ice mass data
CoalGeologist, hence the very large number. -
daniel at 00:36 AM on 14 July 2010Sea level rise is exaggerated
Peter Hogarth at 02:45 AM on 13 July, 2010 The 1 sigma bounds are irrelevant Peter. I've already commented on this. Do you see the overlay of the tide gauge data on sample 1? That's right, it crosses the uncertainty box at the mean height and date range extreme. That is the most probable height of sample 1 has a date at the 2 sigma extreme in the date range, the least probable according to you. On this one Donnelly sees it my way since his linear fit does this also at samples 11, 10, 5 and 4 not to mention the extra paleo data used to constrain the C14 ranges. -
Berényi Péter at 00:33 AM on 14 July 2010Hotties vs Frosties?
#150 CBDunkerson at 23:40 PM on 13 July, 2010 In short, you are maintaining a belief in the inadequacy of wind power by closing your eyes to information to the contrary My point was windfarms render huge areas uninhabitable (much larger than anyhing else). It's a valid one. What else do you need? The sad image you've painted of an ill-managed coal region is striking. Especially because this, far from being unavoidable, is the consequence of insufficient local regulations. Proper recultivation is possible, but pricy. It should be enforced on coal mining companies. Soot and sulphur can be filtered out, scale as well with most of the radioactive materials in it. If you switch technology without improving regulations, in a couple of decades you'll be left with broken windmills dotting the landscape, dropping parts, leaking oil and other chemicals, making it unsafe to even walk among them, not to mention farming. Then you'll have a choice to spend public money on decommissioning or abandon the place and move on. -
muoncounter at 00:30 AM on 14 July 2010Watts Up With That concludes Greenland is not melting without looking at any actual ice mass data
Kudos to John for wading into the fray. #11:""Cherry picking" is different - simply: incomplete information." More than incomplete, this pejorative suggests that one has actively selected only those data that agrees with his/her POV, as in only those cherries that are ripe. Here is one of the graphs posted as a counter-example: The author doesn't appear to notice what happened from the early 80's onwards: approx 4 deg in 30ish years, or a resounding 1.3 deg/decade! Alarming trend, no?
But the surface temperature data are suspect, the gravity data are immaterial, the satellite temperatures are cooked. And the Greenlanders farming where their grandfathers couldn't are clearly drinking the vodka they can make from their own crops:
" ... pulled 20 tons of potatoes from the earth last summer, and his harvests have been growing larger each year. "It's already staying warm until November now, ..." says Egede. And if this is what faraway scientists call the greenhouse effect, it's certainly a welcome phenomenon ...."
Who knows, maybe they'll be planting cherries in Greenland one of these days?
The author doesn't appear to notice what happened from the early 80's onwards: approx 4 deg in 30ish years, or a resounding 1.3 deg/decade! Alarming trend, no?
But the surface temperature data are suspect, the gravity data are immaterial, the satellite temperatures are cooked. And the Greenlanders farming where their grandfathers couldn't are clearly drinking the vodka they can make from their own crops:
" ... pulled 20 tons of potatoes from the earth last summer, and his harvests have been growing larger each year. "It's already staying warm until November now, ..." says Egede. And if this is what faraway scientists call the greenhouse effect, it's certainly a welcome phenomenon ...."
Who knows, maybe they'll be planting cherries in Greenland one of these days?
-
Jeff T at 00:29 AM on 14 July 2010Watts Up With That concludes Greenland is not melting without looking at any actual ice mass data
Wikipedia says that Greenland contains 2,850,000 cubic kilometers of ice. Since one cubic kilometer of ice is nearly 1 gigaton, the current loss rate is 0.05%/year. It doesn't seem like a lot. The acceleration apparent in Figure 2 ought to be a concern, however. @Arkadiusz, I'd like to understand what you are saying, but the abbreviations and hyphenations make it difficult.Response: It's not just the acceleration in ice loss that gives us cause for concern. The various lines of evidence that show Greenland is highly sensitive to temperature and expected to contribute significant sea level rise in future decades/centuries are examined in why Greenland's ice loss matters. -
Arkadiusz Semczyszak at 23:55 PM on 13 July 2010Watts Up With That concludes Greenland is not melting without looking at any actual ice mass data
"Cherry picking" is different - simply: incomplete information. To post J.C. was full - not "cherry picking" - like now - I am please let me know: whether the whole area of the Greenland ice mass is decreasing? If not, why? Perhaps the close vicinity of the mass of Greenland's glaciers are growing somewhere? Is solely responsible for changing our warming, or as we wanted in 1978 Stone (always quoted when it comes to oceanic transport of energy) - are the most important cyclical changes in Earth's rotation and ocean circulation? I advise you also read "whole" last SG - there is much more "one knows why" the arguments skipped by JC (for example, Greenland ice in 1920 -30 years). -
CBDunkerson at 23:54 PM on 13 July 2010Hotties vs Frosties?
BTW, some less one-sided stories on Vinalhaven can be found here and here. Vastly reduced power bills, no pollution, only a few people complaining, and the company working on noise reduction options for those few. Doesn't really sound so bad. -
CoalGeologist at 23:54 PM on 13 July 2010Watts Up With That concludes Greenland is not melting without looking at any actual ice mass data
@Jim Eager #7 Bill Keller, former Managing Editor of the New York Times, observed that a substantial proportion of the [American] public does not look to the [news] media to provide them with a factual accounting of the news, but rather to confirm the beliefs they already hold. WUWT fulfills this function quite well for many of its readership. When you consider some of the things that people choose to believe, the present example is not particularly surprising.
Prev 2323 2324 2325 2326 2327 2328 2329 2330 2331 2332 2333 2334 2335 2336 2337 2338 Next


